Trade ideas

GOLD (XAU/USD) – Safe & Sure Buy Signal💰 GOLD (XAU/USD) – Safe & Sure Buy Signal
📈 Buy Entry: 4109
🎯 Targets: 4135 – 4155 – 4176 (Final Target)
🛡️ Stop Loss: 4088 (Safe Zone Protection)
Analysis:
Gold is showing strong bullish momentum from the 4109 support level. As long as price stays above this zone, buyers are likely to push the market toward the 4176 resistance area. This setup is a safe and sure buy opportunity with a clear upside path and controlled risk.

XAUUSD Bearish Short-Term, Bullish Longer-TermFundamental approach:
- Gold prices traded lower this week after setting fresh record highs earlier in Oct, pressured by profit-taking and cautious sentiment ahead of delayed US inflation data.
- Geopolitical uncertainty and expectations of further Fed easing continued to support underlying demand for safe havens in the longer term.
- US President Trump'sTrump's new sanctions on Russia and export restrictions toward China, alongside the prolonged US government shutdown, reinforced demand early in the week. At the same time, stabilization in trade rhetoric and rising yields curbed momentum later.
- However, a stronger US dollar and rising Treasury yields amid improved global risk appetite and optimism around an upcoming US. China dialogue also reduced safe-haven demand in the short term, especially with today's CPI, which is expected to rise.
Technical approach:
- Gold consolidated within the range of 4054-4113. The price is below the converging EMAs, indicating that a bearish momentum persists.
- If the XAUUSD breaches the support at 4054, the price may decline further toward the next support level at 3950.
- On the contrary, remaining above 4054 may prompt a retest of the upper range at 4143, confluenced with the EMA21.
Analysis by: Dat Tong, Senior Financial Markets Strategist at Exness

XAU/USD – 4H Demand Zone Reaction | Bullish Reversal SetupAfter an extended bullish run, Gold has seen a clean correction back into a 4H demand zone near $4,075–$4,110.
Price is now showing rejection wicks and early signs of absorption, suggesting that buyers may step back in.
🔍 Technical Outlook
Major trend remains bullish on higher timeframes.
4H demand zone aligned with previous structure break area.
Expecting potential retracement back toward $4,200 → $4,280 → $4,380, $4410
💰 Trade Plan (Example)
Entry: 4,110
Stop Loss: Below 4,075
Take Profit: 4,280 → 4,410
🧠 Bias: Bullish
🎯 Focus on confirmation from 4H close or retest before entering.
#XAUUSD #Gold #Forex #TradingView #PriceAction #TechnicalAnalysis #SwingTrade #SmartMoneyConcepts #GoldAnalysis #FXTrading

Watch for opportunities around 4218-4220!
Technically, the daily K-line chart shows a stair-step upward trend, with rising lows and rising highs. As long as this rhythm is maintained, the overall trend is bullish, with a northbound trendline. The medium-term bull-bear watershed is 4145. Above this level, the bullish trend remains unchanged, focusing on the swing and mid-line. As the market moves upward, we should actively support the rise above the short-term watershed of 4200. If this level is broken, the price will likely continue to fall southward in the short term. If 4200 is broken, the lows of 4180-60 will likely be retested. From a spatial perspective, if a retracement retests these two levels, the short-term trend is basically confirmed. A rebound below 4200 will support a short-term decline until 4145! Regarding the potential for gains in the Asian session, 4218 was broken, initially retracing back to 10 points before bottoming out and rebounding to a new high of 4235. Looking at the potential, a pullback to 4218-4220 would be the initial uptrend. A second opportunity would be to watch for 4205-4203.
Thus, overall, a short-term buy signal on a rebound is recommended (watch for pressure signals at 4200 for a continued short-term decline). Long positions above 4218-4220 represent the initial uptrend. A second opportunity would be to watch for 4205-4203. For upward shorting opportunities, watch for 4248-4250, with a 10-15 point pullback. Today's Asian session target of 4215-4217 is rapidly approaching, with a target of 40. My strength is undeniable!

Gold consolidating Bullish maintain another leg HigherGold has been consolidating after a strong bullish rally, suggesting a possible correction phase before another leg higher. Last week’s price movement hinted at a short-term bearish retracement as investors locked in profits. However, the underlying momentum remains positive, supported by strong demand from emerging markets and institutional investors.
Gold continues to deliver a windfall across emerging economies, boosting investor confidence in countries that mine and accumulate the metal The surge in gold prices has created a “wealth effect,” benefiting producers and investors holding significant gold positions Goldman Sachs strategists recently reaffirmed gold’s potential as a hedge asset amid global uncertainty and central bank accumulation.
Technical Outlook
A deeper correction toward 4200 may precede a bullish rebound, confirming accumulation and potential continuation toward 4300 to 4355 may price could test the support after bounced back to upside lets we how the price react.
You may find more details in the chart.
Trade wisely best of Luck buddies.
Ps; Support with like and comments for better analysis Thanks for Supporitng.

Gold Trade Plan 22/10/205Dear Traders,
The 4050–4060 zone should be the reversal area for gold. Considering gold’s panic moves, be cautious — the price could drop down to the 1.27 Fibonacci level around 3950 if that level is broken. However, if today the price closes above 4120, it will enter the 4200 channel.
Regards,
Alireza!

Short term correction - down below 4300⭐️GOLDEN INFORMATION:
Gold (XAU/USD) dips to around $4,245 in early Asian trading on Monday, pausing after its record-breaking rally. The pullback comes as physical demand eases following the festive surge, while traders await China’s Q3 GDP, Industrial Production, and Retail Sales data later in the day. Last week, the metal gained support from India’s festive demand and robust ETF inflows. However, with fundamentals largely priced in, a short-term correction or consolidation appears likely.
⭐️Personal comments NOVA:
Gold price started to accumulate, adjusted down below 4300 at the beginning of the week. Short-term downtrend
⭐️SET UP GOLD PRICE:
🔥SELL GOLD zone: 4320 - 4322 SL 4327
TP1: $4310
TP2: $4300
TP3: $4283
🔥BUY GOLD zone: $4222-$4224 SL $4217
TP1: $4235
TP2: $4250
TP3: $4270
⭐️Technical analysis:
Based on technical indicators EMA 34, EMA89 and support resistance areas to set up a reasonable SELL order.
⭐️NOTE:
Note: Nova wishes traders to manage their capital well
- take the number of lots that match your capital
- Takeprofit equal to 4-6% of capital account
- Stoplose equal to 2-3% of capital account
$Gold Technical Analysis October 2025 📊 #GOLDUSD Update
🔑 Key Zones
PRZ: $4,371 (Gold stopped nicely at $4,381!)
Local Support Zone: $4,180–$4,050
Holding this range can send Gold soaring again toward:
➡️ $4,500 → $4,750 → $5,200
If these supports are lost, → next downside zones are:
➡️ $3,950 → $3,850 → $3,750
📅 Timeframe & View
Short-term:
Gold trading between $4,180–$4,050 — key range before the next big leg.
Long-term:
ATH projection levels:
💎 $5,300 → $5,700 → $7,300 → $7,700
These correspond with critical years for the global cycle:
2025 (Oct–Nov) performance
2027
2031
2033
Every pullback in this decade-long uptrend remains a buy opportunity.
⚖️ Gold or BTC?
For the short term, my focus shifts to BTC.
But once that phase completes, I’ll move back to Gold for the long wave.
💰 Long-Term Holders
For those holding gold long-term (1 year+):
Any pullback below $3750 remains a strong buy zone for adding.
✅ Quick Recap
📍 PRZ hit: $4,371–$4,381
🛡 Support: $4,180–$4,050
🚀 Upside Targets: $4,500–$4,750–$5,200
⚠️ Downside Risk: $3,950–$3,850–$3,750
🧭 Cycle Years: 2025, 2027, 2031, 2033
💰 Focus: Short-term BTC → Long-term Gold
🧭 Personal Trading Note
I only trade Gold in the real market, and use the demo setup here purely for tracking and study.
⚓ Renzo Tip
“When the tide turns, the wise trader doesn’t fight it — he rides one wave, then waits for the next.”
🤲 Prayer
May Allah bless us with patience in the long waves, wisdom in every entry,
and reward us with clarity in both gold and time.

XAUUSD is going downGold (XAUUSD) is showing signs of potential downside continuation after a sharp rejection from recent highs. The daily candle formed a long upper wick and closed below the midline of the green band — indicating profit-taking and emerging selling pressure.
Bearish Influences
Rejection Candle: Strong upper wick signals sellers defending resistance near the 4,180–4,200 zone.
Loss of Momentum: Price slipped below the short-term support band, suggesting weakening bullish control.
EMA / Structure Confluence: The current pullback aligns with the lower trendline slope and prior breakout structure — a likely retracement phase forming.
🎯 Fibonacci Bearish Targets
If price fails to reclaim the 4,180 level and bearish momentum persists, look for these downside targets:
Target 1 (0.382 Fib) → $4,047 – $4,050
Minor support and initial retracement level.
Target 2 (0.618 Fib) → $3,943 – $3,950
Key Fibonacci confluence and previous structure support zone.
Target 3 (1.000 Fib) → $3,814 – $3,820
Full retracement target aligning with the lower green volatility band — potential swing low zone.

Gold Retest of a Daily Demand and Inverse H&S on M15 TFPrice has pulled back to a daily demand zone and there is an entry confirmation pattern on the M15 TF.
As long as the demand zone holds, the bulls will take over. Your position size should be determined by your entry and SL.
Good Luck folks.

Gold Price Outlook | Buyers Stay in Full ControlGold remains firmly positioned within its broader bullish trajectory, supported by consistent demand from both institutional and retail investors. The market has shown strong resilience, forming a well-defined higher-low structure, which reflects continued accumulation. Price action indicates that buyers are confidently stepping in after each controlled pullback, maintaining upward momentum.
The current market tone favors continuation toward the 4,180–4,250 range if momentum persists. Short-term retracements into the 4,070–4,090 area may offer new buying opportunities for position traders aligning with the prevailing trend. Macroeconomic factors such as ongoing inflation concerns, geopolitical instability, and cautious monetary policy stance continue to underpin gold’s strength.


Gold. Where to sell for 5300 pips? 22/Oct/25XAUUSD finally having deep correction just in 1 daily bar! almost 6% the biggest single day drop in 12 years.. Where can we play the knife jump games in gold with rare golden opportunity for few thousands pips just in 2,3 days?

XAUUSD 4H – Pullback to Test, Then Push HigherHello everyone,
Gold is still maintaining a strong uptrend on the 4H timeframe, even though it shows signs of stalling in the supply zone around 4.34–4.36. Given the wick candle formed there, I lean toward the scenario where price pulls back in the short term to the 4.26–4.24 zone to fill FVG and gather liquidity before moving up again to retest 4.34–4.36. If that area is decisively broken, the upward momentum could extend toward 4.39–4.40 and even into the 4.43x region.
Conversely, only a 4H close below 4.20 will make me consider a deeper decline toward 4.17–4.145.
Macro backdrop: News still backing the bulls
This week, gold has repeatedly hit record highs above 4,200 USD, driven by expectations of Fed rate cuts and intensifying geopolitical/trade tensions. The highs of recent sessions around 4.12k – 4.22k – 4.21k validate the already strong trend.
Fed cut expectations: According to CME FedWatch, the market is nearly certain (97–98%) that the Fed will cut 25 bps in October and possibly again in December. Comments from official Waller — advocating a 25 bps cut due to weaker labor conditions — further underpin this anticipation.
US–China rare earth tensions: Beijing has tightened export licensing, while Washington lashes out — Bloomberg calls this a “rare earth shock,” a new geopolitical lever sustaining global risk.
US shutdown risk: The Treasury estimates that a prolonged government shutdown could cost up to $15 billion a week — this uncertainty often drives safe-haven flows into gold.
Solid base demand: According to WGC, central banks continued net purchases (19 tonnes in August), helping form a resilient floor for gold prices in 2025.
With the macro narrative still tilted supportive, the current pullback on 4H is most likely a healthy retracement to fill FVG and rebalance positions, before price retests 4.36 and eyes 4.40–4.43x.
Short-term risks include a surprise hawkish Fed statement or a strong bounce in DXY / yields. In such a case, gold could dip toward 4.22–4.20 (the 4H trend buffer). However, the larger uptrend remains intact as long as 4.20 holds.
What do you think — will gold successfully retest before climbing again, or see a deeper pullback first?

Gold Trade Plan 20/10/2025Dear Traders,
The higher timeframe is still in an uptrend. It seems that the price is currently in a corrective phase, and I expect it to rise from the 4200 zone to around 4300.
Regards,
Alireza!

GOLD – History Never Lies! Are We Close to Major Correction ?Hello Traders 🐺
As I expected, gold is now creating new all-time highs — but the real question is: how far can this rally actually go? Let’s take a closer look, because this chart might reveal a lot more than you think!
Let’s go back in time — all the way to when gold was still in the early stages of its first major rally and reached the top around $890 in 1980.
If you zoom in a little bit, you can clearly see that once the RSI reached around 90 (showing an extreme overbought condition), gold entered a massive bear market, dropping nearly 60% — something almost nobody expected back then.
Now, of course, we can’t rely only on the RSI overbought signal to predict the current situation, but when we use the Fibonacci Trend-Based Tool and measure the rally from its beginning to the bottom of its correction — that’s when things get really interesting!
Look closely: the 0.618 Fibonacci level — also known as the golden ratio — actually predicted the next major top years before it even happened.
When price reached $1880 in 2011, the RSI again entered the overbought zone, and we saw another strong 45% correction right after that!
But what about now?
The RSI is again approaching the same zone, and price is very close to the 0.88 Fibonacci level.
So, what do you think?
Is this the end of the bull run and the right time to start taking profits?
Let’s talk about it in the comments — because in my opinion, we might be about to see another correction, at least down to the 0.618 level, which perfectly aligns with the previous all-time high for gold!

THE KOG REPORT - UpdateEnd of day update from us here at KOG:
Bullish day's are nothing new lately on gold and today believe it or not, was another one! We had the higher oval as a potential target which was completed, then the red boxes with the break above 4240 which consequently led to all the targets being completed again!
Now, just like yesterday, the same plan. Unless we get a deep pull back, not interested in going long up here unless they're quick scalps level to level. Otherwise, the oval again, potential region to watch for an attack!
Price: 4229
RED BOXES:
Break above 4240 for 4250✅, 4255✅ and 4265✅ in extension of the move
Break below 4220 for 4210, 4203 and 4190 in extension of the move
As always, trade safe.
KOG

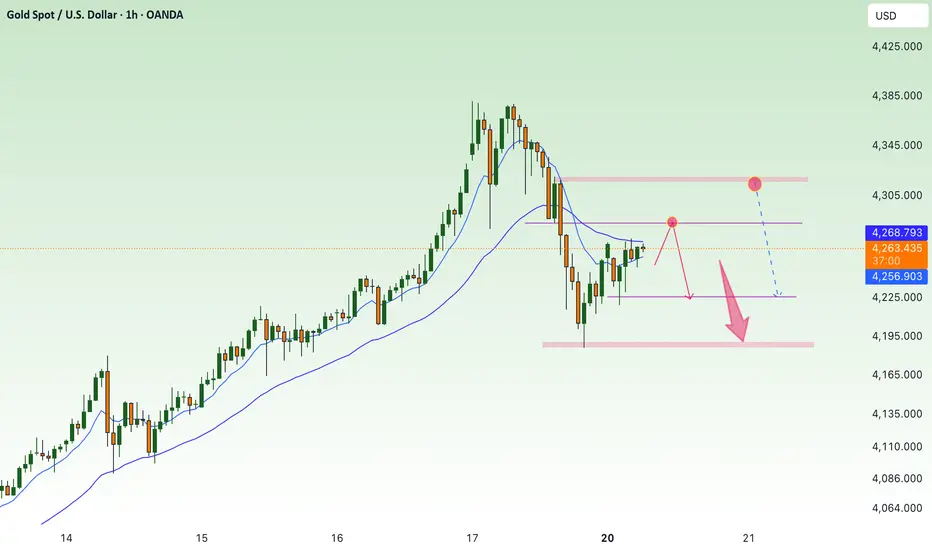
GOLDGOLD next reaction is 4300 and if consolidates then further upside to take 4400 otherwise a break down from 4300 to 4200 and below.
Disclosure: We are part of Trade Nation's Influencer program and receive a monthly fee for using their TradingView charts in our analysis.

Xau updates.Moved off well from entry point!!!! 📍
Reduce the loss here. Needs to break and hold $4285 once interacted with and will be its biggest test to getting back over $4318….
If she can push it over.. it’s a bag day… 🏦

GOLD at current support? holds or not??#GOLD.. market have current supporting area is 4024-25
holdings means again bounce expected..
good luck
trade wisely

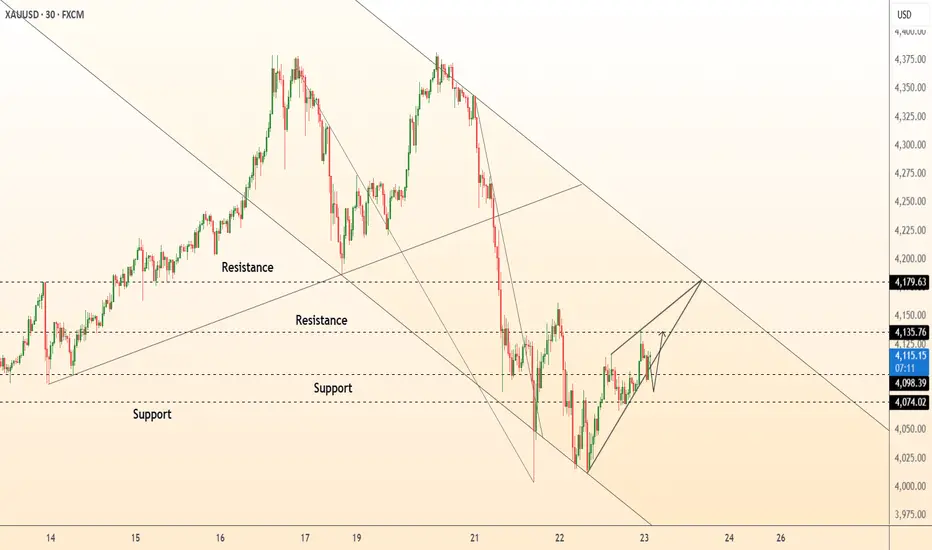
DeGRAM | GOLD rebounded in a descending channel📊 Technical Analysis
● XAU/USD is consolidating between 4,074 and 4,179, forming a short-term ascending structure within a broader descending channel.
● Price action suggests a potential breakout attempt above 4,135 toward 4,179, supported by higher lows and tightening range momentum.
💡 Fundamental Analysis
● Gold gains traction as traders anticipate weaker U.S. PMI data, which could limit dollar strength and revive demand for safe-haven assets.
✨ Summary
● Long bias above 4,100; targets 4,179. Technical compression and macro softness support short-term bullish continuation.
-------------------
Share your opinion in the comments and support the idea with a like. Thanks for your support!
GOLD leveled off after its strongest rally since 1979OANDA:XAUUSD Falls After Trump's 'Softening' Comments on China
Gold Spot gold fell nearly 2% on Friday (October 17), ending a long rally after hitting a new record, as a stronger US dollar and President Donald Trump's soft remarks dampened demand for safe-haven assets.
Spot gold ended the session at $4,250.91 an ounce, down 1.74%, after peaking at $4,379.94 earlier in the session. The US dollar index rose 0.2%, making gold more expensive for foreign investors. Earlier, gold recorded its biggest weekly gain since the Lehman Brothers crisis in 2008.
Trump Calms Trade Tensions, Gold Loses Safe-haven Momentum
Speaking at the White House, Trump admitted that 100% tariffs on Chinese goods were “unsustainable” and confirmed plans to meet President Xi Jinping in the near future. The comments quickly changed market sentiment, easing expectations of an escalation in the trade conflict and pulling safe-haven demand away from gold.
FXStreet commented: “Gold prices fell about 2% from a historic peak as Trump eased his tone with Beijing. The recovery in risk sentiment kept the dollar strong and gold under pressure.”
The yield on the 10-year US Treasury note rose 3 basis points to 4.01%, while real yields rose nearly 2.5 basis points to 1.72%, further pressuring non-yielding assets like gold.
Medium-term outlook remains positive
Despite the short-term correction, gold prices have risen more than 64% year-to-date, boosted by expectations that the Federal Reserve will begin a rate-cutting cycle. The market is now pricing in a 25 basis point cut at its October meeting, and another in December.
HSBC has raised its 2025 average gold price forecast by $100 to $3,455 an ounce, and expects prices to reach $5,000 by 2026.
Some fresh concerns about credit risks emerged after two regional US banks reported $50 million in bad loans, but White House Senior Advisor Kevin Hassett reassured that the banking system remains liquid and “credit conditions are generally stable.”
Goldman Sachs: Gold Price Rally “Real-Based,” Not Speculative Bubble
Gold prices continued to hit records this week, surpassing $4,300 an ounce on October 16, marking a four-session winning streak and a gain of about 65% year-to-date, the strongest since 1979. However, according to Goldman Sachs Group Inc., this is not a speculative frenzy, but reflects real demand from institutions and central banks.
“The current momentum in gold is not driven by euphoria,” Goldman Sachs said in a video conference. “Central banks continue to buy at record levels, while private investors are only gradually rebalancing their portfolios as the Fed accelerates the pace of rate cuts.”
After years of low asset allocations to gold, the market is now returning to a more reasonable balance, not a “gold bubble,” Goldman Sachs said.
Goldman Sachs raised its December 2026 gold price forecast from $4,300 to $4,900 an ounce, highlighting two key drivers: strong inflows into Western gold ETFs and sustained net buying by central banks, particularly in Asia and the Middle East.
Echoes of the 1970s: History Repeats in a New Way
Let’s compare the current cycle to the “gold rush” of the 1970s, when the US ended the Bretton Woods system, inflation soared and the oil crisis pushed the price of gold many times higher.
“Back then, budget deficits and policy uncertainty led investors to seek refuge outside the official monetary system. And now, similar factors are emerging, from US fiscal risks to geopolitical divergence, making gold continue to be a popular hedge.”
According to Goldman Sachs, the gold market is still relatively small compared to the scale of global capital flows, so each shift in capital flows greatly amplifies price fluctuations.
Technical outlook analysis of OANDA:XAUUSD
The daily chart of gold is still in a medium-long term uptrend, as shown by the price remaining above the MA21 and still in the uptrend channel despite the correction. After reaching a historical peak of 4,379, the price has dropped to around 4,250 USD/ounce, corresponding to the Fibonacci retracement level of 0.382.
• Current candlestick structure: a strong correction candle appears but has not broken the bullish structure.
• Important technical support zones:
o 4.216 – 4.160 (Fibo 0.382 – 0.5): potential short-term support zone.
o 4.110 (Fibo 0.618): stronger support, if this zone is broken, it can move into a deep correction phase.
• RSI: still above 70, showing that the market is still in the overbought zone, prone to strong short-term fluctuations but has not confirmed a reversal.
=> Conclusion of the main trend: Gold is still in the main uptrend, currently only in a technical correction phase after reaching the peak, there is no signal of a medium-term reversal.
SELL XAUUSD PRICE 4309 - 4307⚡️
↠↠ Stop Loss 4313
→Take Profit 1 4301
↨
→Take Profit 2 4295
BUY XAUUSD PRICE 4160 - 4162⚡️
↠↠ Stop Loss 4156
→Take Profit 1 4168
↨
→Take Profit 2 4174
