GOLD → Fundamental background boosts interest FX:XAUUSD is recovering after a correction, trading in the range of 4060-4120 amid geopolitical tensions and risks of an escalating trade war.
Key supporting factors: New threats from the US against China, which is responding with additional measures. Trump imposed sanctions against Russian oil companies, accusing Moscow of lack of progress on Ukraine. US inflation data (CPI) on Friday may cause volatility, although the Fed's rate cut next week is likely already priced in.
The meeting between Trump and Xi Jinping next week remains uncertain.
Gold remains a safe haven, but near-term dynamics depend on the balance between dollar strength and geopolitical risks.
Resistance levels: 4116, 4163, 4200
Support levels: 4082, 4060, 4002
A retest of support at 4082-4060, as well as a breakout of resistance at 4116, could trigger a bullish reaction—a rise to the resistance level or imbalance zones. Against the backdrop of the escalating trade war, gold is becoming attractive again.
Best regards, R. Linda!
Trade ideas

Gold price tries to recover back to 4200⭐️GOLDEN INFORMATION:
Gold (XAU/USD) drops below $4,100 in Wednesday’s Asian session, extending its sharpest selloff in over a decade as traders lock in profits after a nine-week record-breaking rally. Easing US-China trade tensions ahead of the November 1 tariff deadline further dampen safe-haven demand.
⭐️Personal comments NOVA:
Gold price is accumulating, trying to recover back to 4163, 4200
⭐️SET UP GOLD PRICE:
🔥SELL GOLD zone: 4163 - 4165 SL 4170
TP1: $4150
TP2: $4135
TP3: $4120
🔥BUY GOLD zone: 4003 - 4001 SL 3996
TP1: $4020
TP2: $4035
TP3: $4050
⭐️Technical analysis:
Based on technical indicators EMA 34, EMA89 and support resistance areas to set up a reasonable SELL order.
⭐️NOTE:
Note: Nova wishes traders to manage their capital well
- take the number of lots that match your capital
- Takeprofit equal to 4-6% of capital account
- Stoplose equal to 2-3% of capital account

XAUUSD: 800 Pips Secured, but Is the Correction Really Over?Yesterday, after revisiting the 4,000 support zone as expected and explained in my previous analysis, Gold bounced strongly and tested the area above 4,100.
That rally delivered around 800 pips profit on my long trade, and now the market is showing a mild pullback, consolidating around 4,085.
The key question now:
👉 Is the overall correction over, or is there still more to unfold?
From a technical perspective, as long as 4,000 remains intact, Gold retains its bullish potential toward the 4,200 resistance zone.
However, I prefer to stay patient at the moment — being flat at the time of writing — and will wait for a potential dip toward 4,050 or slightly below.
If the price shows a positive reaction in that area, I’ll consider re-entering long positions.
🎯 Upside targets:
• First: 4,150
• Second: 4,200
Keeping a positive risk-reward balance remains the main priority.
🚀 Let’s see if the market confirms the plan.

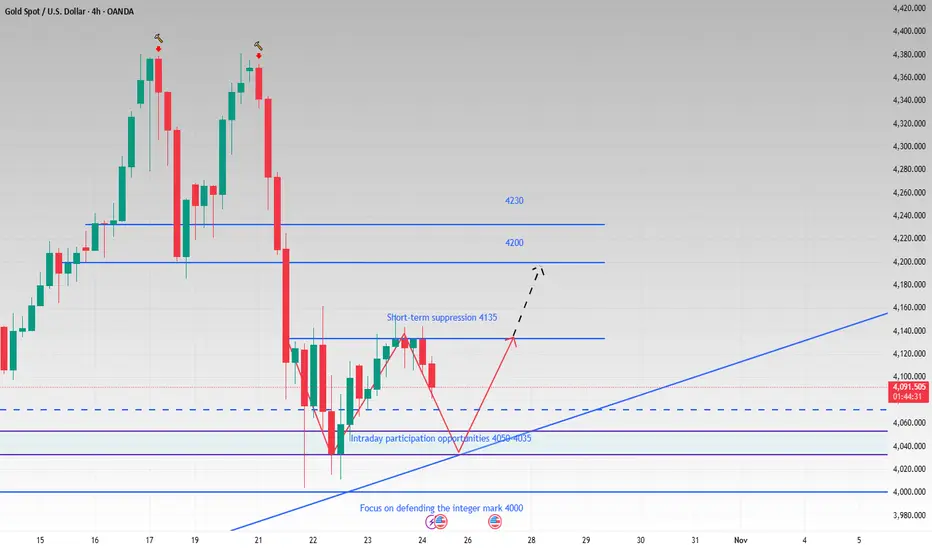
4H see W shape. Support is not broken and it is still bullish.Although gold has experienced a temporary pullback today, we remain bullish as long as the price remains above the upward trend line. While the hourly chart shows a downward trend, with moving averages diverging downward and technical indicators like the MACD forming a death cross, it appears that bears have regained control of the market in the short term.
But from the 4H perspective, if the short-term decline continues and it can effectively rebound after touching the trend line and move out of the W-shaped structure, then gold will be expected to hit the 4135-4145 pressure again, and then gradually hit the 4160, 4200 and other periodic resistance levels until the bulls return. As time goes by, the support points on the short-term trend line are constantly moving up. If it falls back to 4050-4035, try to go long on gold in batches with light positions, and the target is 4090-4130.
OANDA:XAUUSD
Gold’s $4000 Rebound🟡 Gold’s $4000 Rebound
After touching the $4000 support zone, gold has started moving upward toward $4150.
According to the TSD (Trend Strength Detector) indicator, the bearish momentum is weakening, suggesting a potential shift or consolidation phase.
As mentioned in the previous analysis, $4000 remains a strong technical level — both as psychological and structural support.
If buyers maintain control, we could see another attempt toward the $4200–$4250 area in the coming sessions.
💡 This post is for educational purposes only and not financial advice.
#Gold #XAUUSD #TradingView #TSD #TechnicalAnalysis #RMBS #TrendAnalysis

XAUUSD Buy SetupHey Guyx,
Lets dive in with good RR again. If this works then we'll get good profit.

XAUUSD possible scenarios trade accordinglyI have shown possible movement that can trigger next week … I personally feel it can go 4200 and then fall below 4000 , let us see how it plays out

GOLD cooling down, correction or signal of new cycle?Summary
“After three consecutive sessions of declines, gold is experiencing a short-term correction after a rally that has lasted more than two months. Despite falling nearly 6% from its recent peak, the medium-term uptrend remains solid as prices remain above the psychological level of $4,000 per ounce. This move reflects a technical cooling of an overbought market, rather than a fundamental reversal.
With the Fed expected to cut interest rates before the end of the year, geopolitical tensions lingering and the trend of “de-dollarization” spreading, gold continues to play a central role in the global safe-haven portfolio. Investors are now closely watching the price reaction around the $4,000 region, the balance point between short-term profit-taking pressure and medium-term accumulation momentum, while the technical outlook still favors a recovery trend if this support level holds.”
OANDA:XAUUSD corrects after 3-day decline, medium-term uptrend remains strong
Gold has fallen for three consecutive days, marking a technical correction after a long rally. Spot gold was hovering around $4,080/ounce on Tuesday morning, nearly 6% below its recent peak, reflecting a necessary pullback in an overbought market.
The decline comes amid global markets being cautious about the latest developments in US-China trade talks and unclear signals on the Federal Reserve’s interest rate path. Despite short-term pressure, gold remains a central part of the safe-haven portfolio, especially as geopolitical risks increase and major currencies face “soft devaluation” pressure.
Comment: “After a period of excessive growth, gold is correcting like an overstretched spring. The fact that the price is still holding above the $4,000 mark shows that this is a technical cooling process, not a fundamental reversal. The need for safe haven and defensive trades in the Dollar still exists.”
Gold has risen more than 55% year-to-date since mid-August, boosted by expectations of at least a 25 basis point cut by the Fed before the end of the year, along with a trend to hedge against inflation and widening budget deficits. The stability of the US dollar and ETF inflows supported gold prices, while silver and platinum recorded consecutive losses due to profit-taking pressure.
Traders are also focusing on new political-trade signals. US President Trump expressed optimism about a “good deal” at the upcoming meeting with Asian leaders, but admitted that a delay scenario is still possible. This situation has made the market sentiment “cautious but realistically optimistic,”.
The current decline reflects a technical correction, not a trend reversal. With the Fed likely to cut interest rates, persistent geopolitical tensions and the “de-dollarization” trend of some economies, gold remains a pillar in the global safe-haven structure. Investors should monitor the price reaction around the $4,000 mark, the balance point between short-term profit-taking and medium-term accumulation.
Technical outlook analysis of OANDA:XAUUSD
Gold Technical Outlook: Bulls Keep the Initiated Around $4,000
Gold prices are experiencing a short-term but strong correction, after a long rally since mid-August. On the daily chart, the decline has brought the price to test the important support cluster around $4,000–$4,050/oz, corresponding to the Fibonacci 0.618 zone and the MA50 average, which acts as a key “psychological milestone” for the bulls.
The RSI has retreated to near the neutral level of 50, reflecting a temporary cooling rather than a trend reversal. The major trend structure remains clearly bullish, as evidenced by the intact upward price channel.
If the $4,000 zone is maintained, gold is likely to enter an accumulation-recovery phase, with the nearest resistance zones at $4,160–$4,180 (Fibo 0.5) and $4,210–$4,275 (Fibo 0.382–0.236). Conversely, a loss of the $4,000 mark would trigger deeper profit-taking towards the extended support zone of $3,950.
The current correction suggests the market is consolidating its medium-term uptrend, with no signs of breaking the trend. Once sentiment stabilizes around the $4,000 threshold, new buying pressure is likely to return, especially if there are supportive signals from US economic data or expectations of a Fed rate cut.
SELL XAUUSD PRICE 4231 - 4229⚡️
↠↠ Stop Loss 4235
→Take Profit 1 4223
↨
→Take Profit 2 4217
BUY XAUUSD PRICE 4001 - 4003⚡️
↠↠ Stop Loss 3997
→Take Profit 1 4009
↨
→Take Profit 2 4015
XAUUSD- Is the Correction Really Over?Yesterday, after revisiting the 4,000 support zone as expected and explained in my previous analysis, Gold bounced strongly and tested the area above 4,100.
That rally delivered around 800 pips profit on my long trade, and now the market is showing a mild pullback, consolidating around 4,085.
The key question now:
Is the overall correction over, or is there still more to unfold?
From a technical perspective, as long as 4,000 remains intact, Gold retains its bullish potential toward the 4,200 resistance zone.
However, I prefer to stay patient at the moment — being flat at the time of writing — and will wait for a potential dip toward 4,050 or slightly below.
If the price shows a positive reaction in that area, I’ll consider re-entering long positions.
Upside targets:
• First: 4,150
• Second: 4,200
Keeping a positive risk-reward balance remains the main priority.

Gold price analysis on March 24XAUUSD – Bears Still in Control
Gold is trading sideways around the key resistance zone of 4145, indicating a strong struggle between buyers and sellers. However, the price has been repeatedly rejected at this zone, indicating that the bearish pressure is still dominant.
If the current trend is maintained, the support zone of 3946 will be the next potential target for the sellers. Only when the price clearly breaks above 4145, the current bearish structure can be broken and the new buying trend is confirmed.
📊 Trading Strategy:
SELL now at 4110
Target: 4022 – 3946
BUY setup: When the price breaks decisively above 4145

Is the Yellow Metal Ready to BUST Out?Hold onto your hats, traders!
It's been a very wild ride in the FX_IDC:XAUUSD market, proving that what goes up (to a Double Top 🏔️🏔️) must come down (with a vengeance!). After a decisive rejection at the $4381 peak, Gold took a spectacular 8.64% dive last Tuesday, landing sharply at the $4002 low 📉. Talk about a waterfall! 🌊
But don't count the bulls out yet! Gold showed some backbone, bouncing 3.97% back up to $4161 before settling into a cage match. It's now consolidating in a classic Triangle pattern (a.k.a. Compression) 📐, ranging from the $4002 floor up to the stronger resistance near $4135.
The Great Consolidation: Triangle Tension 😮💨
The key takeaway? That $4000 psychological support is a BEAST. 💪 It survived test after test during the Asia, EU, and US sessions last Tuesday and Wednesday! This resilience allowed Gold to build support: first at the $4065 level (the Fib 0.382) and then down to the $4043 low, followed by rock-solid support near the $4000 zone.
As Friday closed out the week, Gold was still testing the lower $4100 area, pulling back to $4096. So, what’s next for the shiny metal?
That $33 candle Friday, was a direct reaction to the release of the slightly softer-than-expected US September Consumer Price Index (CPI) inflation data.
My Outlook: Patience is Gold, But the FED is Key 🔑
While some market watchers are singing a bearish tune 🐻, I see this as a healthy consolidation phase. Gold has already corrected 50% from its massive move (from $3631 low to the $4381 high). While a deeper correction to the 0.618 Fib at $3918 is possible, I don't see the catalyst right now to push it that far.
My bet? Gold will continue to consolidate in $4050 - $4150 range until the major announcement from the FED 🏦. The sharp reversal from the Double Top might just be the clean-out needed to launch prices higher once the rate cut announcement (or even just the dovish talk of future cuts) takes place! The last inflation data was a mixed bag, which gives the FED room to sound reassuringly dovish.
The FED Announcement is the main event this week. Mark your calendars! 🗓️
🔥 Key Economic Events: Central Bank Super Week! 🔥
This week is absolutely jammed with market-moving events across the globe. Get ready for volatility! 🌪️
Monday, October 27, 2025
8:30 AM ET: USD 🇺🇸 Durable Goods Orders (MoM) (Sep)
10:00 AM ET: USD 🇺🇸 New Home Sales (Sep)
Tuesday, October 28, 2025
10:00 AM ET: USD CB Consumer Confidence (Oct)
Wednesday, October 29, 2025 (The Fed Day) 🏦
All Day: HKD Holiday - Chung Yeung Day
9:45 AM ET: CAD BoC Interest Rate Decision
10:30 AM ET: USD Crude Oil Inventories
2:00 PM ET: USD Fed Interest Rate Decision
2:30 PM ET: USD FOMC Press Conference
10:00 PM ET (Approx.): JPY BoJ Interest Rate Decision
Thursday, October 30, 2025 (ECB and GDP Day)
2:00 AM ET: EUR German GDP (QoQ) (Q3)
4:00 AM ET: EUR German CPI (MoM) (Oct)
8:15 AM ET: EUR Deposit Facility Rate (Oct)
8:15 AM ET: EUR ECB Interest Rate Decision (Oct)
8:30 AM ET: USD GDP (QoQ) (Q3)
8:45 AM ET: EUR ECB Press Conference
9:30 PM ET: CNY Manufacturing PMI (Oct)
Friday, October 31, 2025 (Inflation and Month End)
6:00 AM ET: EUR CPI (YoY) (Oct)
8:30 AM ET: USD Core PCE Price Index (MoM) (Sep)
8:30 AM ET: USD Core PCE Price Index (YoY) (Sep)
9:45 AM ET: USD Chicago PMI (Oct)
-------------------------------------------------------------------------
This is just my personal market idea and not financial advice! 📢 Trading gold and other financial instruments carries risks – only invest what you can afford to lose. Always do your own analysis, use solid risk management, and trade responsibly.
Good luck and safe trading! 🚀📊

XAUUSD – Waiting for a Breakout to Confirm the Next Bullish WaveGold remains under pressure, trading slightly below 4,100 USD/oz despite ongoing geopolitical tensions and weak global sentiment.
On the higher timeframe, the structure still respects its ascending channel, showing no signs of a deep breakdown yet.
During the early Asian session, renewed buying interest has started to emerge, supported by a stable inflow of safe-haven demand.
Technically, price is attempting to form a bullish continuation structure (Dow wave) around the 4,110 zone.
If a breakout above this key level occurs, gold could accelerate toward 4,155, and potentially extend into a corrective bullish wave targeting 4,220–4,260, aligning with the Fibonacci retracement confluence and the CP/OBS sell zone on the chart.
Technical Outlook (M30):
Price action suggests a potential wave recovery structure forming after last week’s steep decline.
The 4,155 level acts as a key inflection point — it will decide whether bulls regain control or bears push for another correction.
Key Levels:
CP Zone Up / Breakout Base: 4,053 – 4,055
Short-Term Key Level: 4,110 – 4,115
Mid-Level Resistance: 4,155 (structure pivot)
Fibo Sell Zone / Wave End Target: 4,220 – 4,263
Trading Plan:
🔹 BUY Setup #1
Entry: 4,020 – 4,018
Stop Loss: 4,010
Take Profit: 4,030 → 4,035 → 4,040 → 4,050 → 4,060 → 4,100
Bias: Reaccumulation Phase (structure support)
🔹 BUY Setup #2 (Scalp Play)
Entry: 4,053 – 4,051
Stop Loss: 4,043
Take Profit: 4,060 → 4,070 → 4,080 → 4,090 → 4,100 → 4,150
Note: Ideal for intraday traders watching the breakout base.
🔹 SELL Setup (Liquidity Reaction Zone)
Entry: 4,263 – 4,265
Stop Loss: 4,273
Take Profit: 4,255 → 4,250 → 4,240 → 4,230 → 4,220 → 4,210 → 4,200
Summary:
Gold continues to consolidate above 4,050, showing signs of early recovery after the recent 3,000-pip correction.
The 4,155 level remains the key pivot for short-term direction — a breakout here could confirm a Wave 3–5 recovery structure, while rejection could bring one more pullback.
Macro and geopolitical uncertainty still favour safe-haven flows, keeping the bullish scenario valid as long as 4,000–4,020 holds.
📊 What’s your take — will gold break above 4,155 to start a new bullish wave, or reject and extend the correction further?
👉 Follow MMFLOW TRADING for institutional-style updates and daily structure-based setups.

Gold finally has a supply range! Time for bullish correction?I talked about everything but the obvious inverse head and shoulders/Quasimodo forming the right shoulder now. If everything goes right can we expect an arm to extend upwards here during the stochastic buy cycle?
Let me know what you think and be sure to share and care for others if you found this helpful.
Also talked about the "REAPER WARNING" as we have a reaper inversion range actively terrorizing price 🧩

Gold - Possible intermediate topAfter the multi week rally we are heading into the DCL.
The first stop during this drop will be the tag of the 200 EMA on the hourly at 4129$.
Daily chart will be posted after after the close.

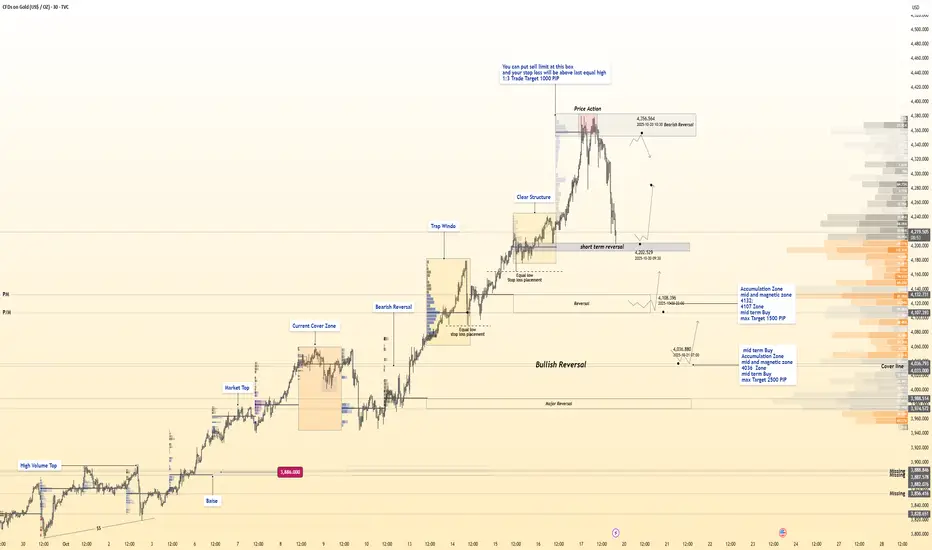
The Ultimate GOLD Reversal Map📊 Hanzo Protocol Note
Every marked level reflects precision between liquidity, delta reaction, and volume logic —
Only structure and flow decide — not bias.
Mid-Term SELL Zone — 4360
Setup: Limit Sell Recommended
Stop Loss: Above recent equal highs
Target: +1000 Pips (1:3 RR)
Reasons:
Liquidity pool above previous equal highs
Institutional distribution volume at upper range
HVN (High Volume Node) cluster acting as resistance wall
Delta shift showing heavy sell absorption
Imbalance re-test aligned with order block
4H premium pricing zone within range top
Price deviation above value area high
Stop hunt confirmation wick
Momentum divergence vs delta
Hidden distribution footprint visible on volume profile
Short-Term BUY Zone — 4202
Setup: Reactive Buy Opportunity
Target: 500–1000 Pips
Reasons:
Ultra-volume spike with no price continuation
Delta flip confirming buyer absorption
Trap formation below session low
Volume exhaustion beneath POC
Smart Money re-entry point after sell-side clear
Strong 30M reversal wick with liquidity gap
Reaction from prior fixed HVN
Internal structure shift with micro CHoCH
Buyer cluster confirmed under equilibrium
Perfect liquidity grab setup before new leg
Mid-Term BUY Zone — 4132 – 4107
Setup: Accumulation & Magnetic Demand Area
Target: Up to 1500 Pips
Reasons:
Multi-session HVN alignment
Strong accumulation footprint on delta flow
Reactive rejection at discounted price zone
Liquidity engineered below equilibrium
Large volume imbalance correction
Compression channel breakout origin
Major liquidity gap filled
High-probability reversal range from fixed profile
Delta divergence showing quiet buyer absorption
Institutional order flow detected at low volume shelf
Long-Term BUY Zone — 4036
Setup: Deep Accumulation Zone
Target: Up to 2500 Pips
Reasons:
Major 4H structural base confirmed
Deep liquidity flush below quarterly low
Volume absorption + delta compression zone
Institutional reloading pattern visible
Smart Money demand block within discount 0.79 level
Magnet zone aligning with historical POC
Strong rejection from fixed range low
Major delta shift to positive
Buyer footprint expansion in lower volume node
Final liquidity grab before long-term accumulation move
Gold’s recent rollercoaster- A Lifetime of LessonsThere are plenty of lessons to take from Gold’s recent rollercoaster — lessons about volatility, psychology, and how easily conviction can turn into chaos.
But before we get into technicalities, let’s look at what really happened… and what it means for us as traders.
________________________________________
1️⃣ The Illusion of Strength
When Gold went straight from 4000 to 4400 in just a few days, the move looked unstoppable.
Social media was full of confidence — “China is buying”, “5k incoming”, “This is the new era for Gold.”
But markets don’t move in straight lines forever.
Every parabolic rise eventually collapses under its own weight.
And when it does, it doesn’t just destroy buy positions — it destroys false convictions.
The first lesson?
Moves that look too strong to fade are usually too weak to sustain.
________________________________________
2️⃣ Confidence Can Be Expensive
Believing too much in one direction — especially when price already exploded (see the rise from 3300 to 4k in one month) — is one of the fastest ways to lose money.
A trader who bought at 4350 because he was “sure” China would keep buying quickly learned how expensive “sure” can be.
The market doesn’t reward conviction.
It rewards discipline, flexibility, and risk control.
Confidence without control is just another form of gambling.
________________________________________
3️⃣ Trading ≠ Investing
This move also reminded everyone of a fundamental truth:
You are not China.
China buys Gold as a store of value, not as a speculative trade.
They bought at 2500, 3k, 3.5k and 4400 — not to take profit in two days, but to build long-term reserves.
You, as a trader, operate in a completely different universe.
Mixing trading logic with investment narratives is a silent killer.
You might tell yourself, “If China buys, I’m safe.”
But China doesn’t use a stop loss and don't trade in margin (use laverage),— YOU DO.
If you don’t understand the difference, better stay on the sidelines and watch.
At least you won’t lose money while learning the hard way.
And if you want a more down-to-earth comparison — my mother started buying Gold in the early ’70s, as a store of value through the communist period.
She bought through the gold bubble of the late 1970s, bought at the bottom afterward, continued through the 1990s, and kept doing it until she retired in 2005.
She wasn’t trading — she was preserving value.
That’s what investing is.
What we do here, every day, is something entirely different.
________________________________________
4️⃣ Right vs. Wrong? It’s Not About That
And now that we’ve made the distinction between investing and trading clear,we must also understand something even more important:
Trading is not about being right or wrong — it’s about timing, money management, and perspective.
Let’s take a few real examples from last few day's chaos:
• On Friday, if you bought at 4275 and the price spiked overnight, you could’ve closed with 1000 pips profit — you were “right.”
• But if someone else sold at 4370 during that same night, they were also “right,” catching the drop.
• If you had bought the dip from the all-time high, around 4300, you’d likely be down 1000 pips in drawdown quickly same Friday — and let’s be honest, who really holds that?
• If you sold at 4300 on Monday near resistance, you would have been stopped out as price revisited the ATH — even though your direction was correct eventually.
• Likewise, if you bought yesterday at 4200 during the drop, you’d have been liquidated on the next 2000-pip fall. And if Gold now rises again to 4400 or even 5000 — how does that help you?
Obviously, these are illustrative examples, just to express the point — not literal trades.
And for those who commented under previous posts — either out of boredom or the need to contradict — I have two things to say:
1️⃣ If you don’t understand what I just explained, you have no business being in trading.
2️⃣ If you do understand but still feel the urge to argue, your comment is nothing more than trolling and emotional projection.
Because this isn’t about numbers or ego — it’s about understanding how the market really works, beyond the noise and the narratives.
________________________________________
5️⃣ The Real Lesson
The 4000–4400 move wasn’t just a chart pattern.
It was a psychological test — a reminder that the market exists to expose overconfidence.
When something looks “certain,” that’s usually when it’s most dangerous.
In trading, survival matters more than prediction.
And sometimes, the smartest trade is no trade at all.
________________________________________
6️⃣ Final Thoughts
Gold’s rollercoaster taught more than a dozen books on trading psychology ever could.
It reminded us that:
• Parabolic moves end violently.
• Overconfidence without a stop loss is suicide.
• You’re not an investor — you’re a trader.
• Being “right” means nothing without timing.
• And sometimes, the best position is to stay out.
The market didn’t just move from 4000 to 4400 and back.
It moved through the hearts and minds of every trader watching it —and left behind a few lessons worth remembering for a lifetime.

XAUUSD next week (October 27, 2025 - October 31, 2025)After yesterday's CPI news on 24/10/2025, we saw interest rates unfavorable for the USD. This makes gold continue its upward trend in the coming time. Targets are 4380-4475 respectively.

Gold at Crossroads: Supply Pressure vs Demand Rejection1. Market Structure
Overall, gold is currently in a corrective phase following a strong bullish rally. The latest move formed a Higher High (HH) around 4,350–4,360, followed by a sharp rejection — signaling that supply pressure has started to take control.
2. Supply Zone & SELL Potential
Strong Supply Zone (4,336–4,350): This is a key resistance area where price previously faced heavy rejection. If price retests this level, it could provide a potential SELL setup, especially if a clear reversal candle such as a bearish engulfing or shooting star appears.
However, if this zone is broken with a solid bullish candle, the market could likely print a new All-Time High (ATH) in line with the medium-term bullish momentum.
3. Golden Ratio Supply Area (around 4,246–4,264)
This area acts as both a Take Profit zone for prior long positions and a directional confirmation zone. A failure to break above could trigger another rejection and deeper pullback, strengthening short-term bearish pressure.
4. Secondary Reaction Area (around 4,150)
This zone has been tested three times, confirming a strong short-term supply presence.
Plan: wait for a strong bullish breakout candle above this area to validate a continuation move. If another rejection forms, price could head back toward the Demand Area (4,065–4,043).
5. Demand Area (4,065–4,043)
A key level for potential BUY setups. Look for a clear bullish reversal candle before entering. If this zone holds, the market could rebound higher.
But if it breaks down, price may extend lower toward the Major Demand zone (3,974–3,986).
6. Major Demand (3,974–3,986)
A strong base zone capable of halting further downside movement. Suitable for swing BUY setups with a favorable risk-reward ratio, as long as price stays above this level.
Trading Plan Summary
BUY PLAN:
Wait for bullish confirmation near Demand Area (4,065–4,043) or Major Demand (3,974–3,986).
First targets: Secondary Reaction Area (4,150) and Golden Ratio Supply (4,246).
SELL PLAN:
Wait for clear rejection or reversal candle near Golden Ratio Supply (4,246) or Strong Supply (4,336–4,350).
Target: Demand Area (4,065–4,043).
Conclusion
Gold is currently in a neutral strategic zone, squeezed between strong supply and solid demand. The next directional move will largely depend on how price reacts around the Secondary Reaction Area and Demand Area.
The key principle: don’t predict—react to confirmation.


XAUUSD 1H Analysis(27th October 2025) ASIA/LondonBUY/SELL SCENARIOS:
BUYS:
1) Body candle close above 4096.72 level.
2) Retest the failed 1H Bearish FVG at 4096.72
3) Create a 3/5m Bullish Engulfing Candle to capitalize on BUYS.
SELLS:
1) Retest the 1H Bearish FVG at the 4088.59
2) Create 1 3/5m Bearish CHOCH with a body candle close (with a FVG)
3) Retest the 3/5m Bearish CHOCH Level to capitalize on SELLS towards the 4000 level.
Trade smart, Trade safe guys. Execute trades only with these confirmations!!

XAUUSD Update === Consolidation ZoneIf we pay attention to the weekly and monthly candles, this is very interesting, because in this area we will see whether there will be a continuous correction or just a moment to go back up.
We believe it fell by 3700 pips, it was not coincidence.
We should extra carefully on this area, because a reversal / deep correction also have a potential.
And also now is a Q4 of 2025.
Have a blessing week ahead !

GOLD ANYLSISStop-loss: 4050
Target: 4250
(Assuming entry around 4100)
That means you’re risking about 50 points to potentially make 150 points — a 3:1 risk–reward ratio.
That’s a solid setup — you’d be earning three times what you risk if the trade hits target.

Gold ready for another spike 4380Gold (XAU/USD) is holding above the support trend line, showing potential for a bullish rebound. As long as price stays above the 4,220 support area, it may target the next resistance near 4,380.
