XAU/USD Metals Outlook: Bullish Path with Layered Buy Entry Plan🔥 XAU/USD: Thief’s Gold Heist Strategy Map (Swing/Day Trade) 💰
🎯 Asset: XAU/USD (Gold vs. U.S. Dollar) — The Shiny Metal’s Wealth Hunt!📈
Market: Metals Market
🏆 Strategy Vibe: Bullish Bandit Plan with a Thief-Style Layering Twist! 😎
🕵️♂️ The Thief’s Bullish Plan: Steal the Gold!
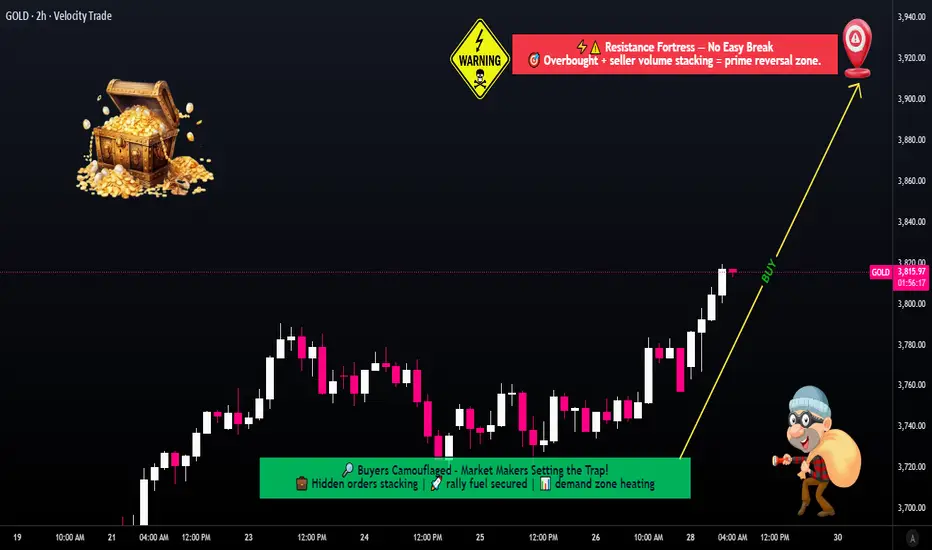
We’re diving into the XAU/USD market with a bullish swing/day trade setup using a slick Thief Layering Strategy. This involves stacking multiple buy limit orders to catch the price at key levels. No boring single entries here — we’re building a multi-layered trap to snag those pips! 🪤
📊 Key Setup Details
🎯 Entry Levels:
Deploy the Thief Layering Strategy with multiple buy limit orders at:
💰 3760
💰 3780
💰 3800
Pro Tip: Feel free to add more layers based on your risk appetite! Stack those limits like a master thief planning a heist. 😏
🛑 Stop Loss:
Thief’s SL set at 3720.
Note: Dear Ladies & Gentlemen (Thief OG’s), this SL is my take — you’re the boss of your trades! Set your stop loss based on your risk tolerance. Trade smart, steal smarter! 💡
🎉 Take Profit Target:
Aim for the Electric Shop High Voltage Trap at 3920. This zone screams strong resistance, overbought signals, and a potential trap for the unprepared. Escape with your profits before the market zaps you! ⚡️
Note: Thief OG’s, this TP is my suggestion. Grab your profits at your own pace and risk level — make it rain when you’re ready! 💸
🔗 Related Pairs to Watch (Dollar-Based Correlations)
Keep an eye on these USD-based pairs for market synergy and correlation:
FX:USDJPY : A stronger USD could pressure gold prices, so watch for inverse moves. If USD/JPY spikes, XAU/USD might dip. 📉
OANDA:USDCHF : Another safe-haven pair. If CHF strengthens, it could signal risk-off vibes impacting gold. 👀
TVC:DXY (U.S. Dollar Index): Gold often moves inversely to the dollar. A rising DXY could cap XAU/USD’s upside — stay sharp! 🧠
OANDA:XAGUSD (Silver): Gold’s shiny cousin often follows XAU/USD’s lead. Check for confirmation in silver’s price action. ✨
Why Watch These? Correlations help you spot market sentiment. If USD strengthens across pairs, gold’s bullish run might face resistance. Use these as your Thief’s Radar to time your entries! 🕵️♀️
🔑 Key Points of the Thief Strategy
Layering Entries: Multiple buy limits spread risk and increase chances of catching a favorable entry. Think of it as setting multiple traps for the price! 🪤
Risk Management: The suggested SL at 3720 keeps losses tight, but adjust based on your account size and risk tolerance.
Resistance Watch: The 3920 zone is a high-voltage trap with overbought signals. Secure profits early to avoid getting caught in a reversal. ⚡️
Market Context: Gold thrives in uncertainty, so keep an eye on global events, Fed news, or inflation data that could spark volatility. 📡
⚠️ Disclaimer
This is a Thief-Style Trading Strategy crafted for fun and educational purposes. Trading involves risks, and past performance doesn’t guarantee future results. Always conduct your own analysis and trade at your own risk. Stay sneaky, stay safe! 😎
✨ If you find value in my analysis, a 👍 and 🚀 boost is much appreciated — it helps me share more setups with the community!
#️⃣ #XAUUSD #GoldTrading #ThiefStrategy #SwingTrading #DayTrading #BullishSetup #ForexTrading #TradingView
Trade ideas
XAU/USD Technical Setup ‖ Bullish Momentum or Smart Trap?🏆 XAU/USD: The Golden Heist Blueprint | Swing & Scalp Strategy 💰
📊 Market Overview
Asset: XAU/USD (Gold vs U.S. Dollar)
Market: Precious Metals
Strategy Type: Dual Setup - Swing Trading (Bullish) & Day Trading/Scalping (Bearish)
Risk Level: High Volatility Zone ⚠️
🎯 The Master Plan
🚀 Bullish Scenario: "To The Moon" Setup
Breakout Level: $4,400.00
Action: Direct long entry on confirmed breakout above resistance
Logic: Clean break = institutional momentum shift
🔻 Bearish Scenario: Scalping/Day Trade Setup
Breakdown Level: $4,050.00
Action: Short positions on confirmed break below support
⚠️ Trap Alert: Any pullback above $4,050.00 post-breakdown = potential smart money trap. Watch for false breakouts!
🛡️ Risk Management Zone
Stop Loss (Pullback Buy Plan): $3,950.00
⚠️ Disclaimer: This SL is based on my analysis for the bullish pullback scenario. You're the captain of your own ship! Adjust stops according to your risk tolerance, account size, and trading style. Never risk more than you can afford to lose.
🎖️ Profit Targets
Buy Side Target: $4,600.00
Exit Strategy Notes:
Strong resistance confluence at this level
Overbought conditions likely
Potential trap zone for late entries
Recommendation: Scale out profits gradually rather than waiting for the full target
Sell Side Target: $4,050.00
Exit Strategy Notes:
Major support level - expect bounces
High probability of liquidity grab at this zone
Consider partial profit taking before reaching full target
Recommendation: Trail stops as price moves in your favor
⚠️ Disclaimer: These targets are MY analysis, not financial advice. Take profits when YOUR strategy signals, not mine. Trail stops, scale out, or exit based on YOUR plan. Your money, your rules! 💪
🔗 Related Markets to Watch
Correlated Assets:
DXY (U.S. Dollar Index): Inverse correlation - Dollar strength = Gold weakness
GC (Gold Futures): Direct correlation - Institutional positioning indicator
XAUEUR (Gold vs Euro): Alternative safe-haven flow gauge
US10Y (10-Year Treasury Yield): Inverse correlation - Rising yields pressure Gold
BTCUSD (Bitcoin): Risk-on/risk-off sentiment indicator
Key Fundamental Drivers:
Fed monetary policy & interest rate decisions
Inflation data (CPI/PCE reports)
Geopolitical tensions (safe-haven demand)
Real yields & opportunity cost
🔑 Key Technical Points
✅ Breakout Confirmation: Wait for candle close above/below key levels
✅ Volume Analysis: High volume breakouts = higher probability
✅ Smart Money Traps: Watch for failed breakouts and liquidity grabs
✅ Risk-Reward Ratio: Calculate before entry - minimum 1:2 recommended
✅ Market Structure: Respect higher timeframe trends
🎭 Trading Psychology Reminder
This strategy has a playful "heist" theme for entertainment, but make no mistake — treat your capital with serious respect. The market doesn't care about our plans. Adapt, manage risk, and preserve capital above all else.
Remember:
No setup is guaranteed
Always use stop losses
Never risk your rent money
Emotions are the enemy
The market pays patient traders
✨ If you find value in my analysis, a 👍 and 🚀 boost is much appreciated — it helps me share more setups with the community!
#XAUUSD #Gold #GoldTrading #ForexTrading #SwingTrading #DayTrading #Scalping #TechnicalAnalysis #PreciousMetals #TradingStrategy #RiskManagement #Forex #GoldAnalysis #TradingIdeas #MarketAnalysis #PriceAction #Breakout #SupportAndResistance #TradingView #ForexSignals
Happy trading, and may the pips be ever in your favor! 🎯💎

The Ultimate GOLD || Intraday Trading Plan (10/23/2025)Welcome to Trade with Decrypters!
DETAILED AND COMPLETE ANALYSIS ( 5 TRADE SETUPS )
Central Bank Buying
Central banks added net 19t in August led by Kazakhstan (14t), Bulgaria and El Salvador, Q3 on pace for 1,000t+ annually up 41% from historical norms. BRICS drivers like China (300t+ YTD) and India's $100B reserves fuel de-dollarization and inflation hedges; Poland reaffirms targets amid risks. Silver links to EV/solar boom (+70% China demand). Outlook: Unfazed 1,000t buys lift prices into 2026.
ETF Inflows & Sentiment
Gold ETFs hit $472B AUM in Q3 (+23% q/q) with $64B YTD inflows, September $17B record led by North America/Europe; Asia minor outflows. Safe-haven rush amid trade wars, minor profit-taking post $4k peak. RSI 75 overbought, $3,900 support holds. Silver +$2B YTD on industry bets. Forecast: Gold $4,200 test, silver $50+.
Macro & Geopolitical Events
Fed Oct cut vs. 2.9% inflation/shutdown-delayed jobs—labor firmer but risks grow.
Trump's China tariffs fuel wars; BRICS stalls de-dollarization but boosts gold; Ukraine/Mideast hikes energy/inflation. Drives 50%+ YTD metals gains; tariffs add 1–2% CPI.
Silver Deficit
Fifth straight deficit at 118M oz in 2025 (down 21% YoY), demand stable 1.20B oz vs supply +3% to 1.05B oz, industrial record 680M+ oz from solar/EVs. Renewables offset jewelry drops
Futures & Options Flow
CME gold OI ~528k contracts, steady amid volumes; CVOL moderate, call/put skew bullish for rate-cut squeezes
Fundamentals & Forecast
Gold +51% to $4,062, silver +43% to $48—via 1,000t+ CB buys, inflation, cuts, 7% GDP deficits. De-dollarization/geo-risks dominate. Projection: Gold $4,400 Q4, silver $57 mid-2026

Gold Sell IdeaGold is still strongly bearish on the daily timeframe, though there is a slight pullback. Dialing back to the 6hr timeframe, the Aroon (1) gave a sell signal and the RSI (3) dipped below 50. On the 2hr timeframe, a Supertrend (2, 1.2) has also fully formed. SL at high of recent pullback and RR is 1:2. Gl

Gold Retest of a Daily Demand and Inverse H&S on M15 TFPrice has pulled back to a daily demand zone and there is an entry confirmation pattern on the M15 TF.
As long as the demand zone holds, the bulls will take over. Your position size should be determined by your entry and SL.
Good Luck folks.

XAU LONGSLast post moving fast here….
$4236 flat and 34 entries!!!
Going with stops at $4200 flat, ZERO Allowance!!!
Refer to previous posts for handles and currently working with $4281 into 85 for breach.
Let’s see! 🏦

XAUUSD is showing a clear technical shift to the upside🔍 Technical Overview
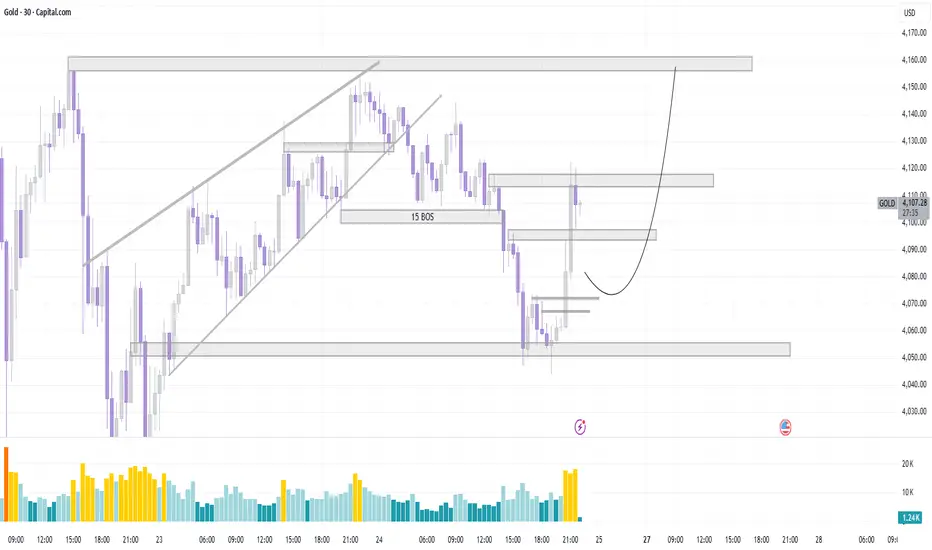
Structure: The market previously formed a bearish structure, confirmed by a Break of Structure (BOS) labeled near the 15-min level.
Recent Move: Price made a strong impulsive bullish push upward, showing a clear change in short-term momentum.
Volume Spike: Noticeable increase in volume during the breakout — this often signals smart money entering the market or short covering.
📈 Current Scenario
Support Zone (Demand Area): Around 4,090–4,095, marked as a potential retest area where price could pull back before continuing higher.
Resistance Zones:
Minor resistance near 4,115–4,120
Major resistance / liquidity zone around 4,165–4,175
Projection: The curved arrow suggests a bullish retracement scenario — a pullback into the 4,090–4,100 area followed by continuation to the 4,170 zone.
🧭 Trading Idea
Bullish Bias as long as price holds above 4,085 (previous breakout base).
Look for:
Pullback entry: around 4,095–4,100
Target 1: 4,130 (intra-day resistance)
Target 2: 4,170 (major liquidity area)
Invalidation: If price breaks below 4,080, structure may shift bearish again.
Gold: Double Bottom or Five-Wave Decline?After rising to the MA60 area on the 4-hour chart, gold faced significant selling pressure, and the price has now pulled back to around 4050, which lies near the short-term support zone. Over time, the MA20 support on the daily chart has moved up to around 4055, while the MA30 currently sits near 3942.
On the 1-hour chart, the downtrend appears not yet complete, so pay attention to the next two closing candles. For now, key support levels to watch are 4014–4000, followed by 3978–3937.
If the price stabilizes around 4000, a double-bottom pattern could potentially form. However, if it falls further toward the MA30, a head-and-shoulders pattern may come into play. In case the rebound fails to break above resistance, be cautious of a five-wave decline, as that could trigger another sharp correction, with a high likelihood of filling the gap near 3887.
In terms of trading strategy, the focus should still be on finding buying opportunities.
For medium-term setups, you can hold positions patiently; for short-term intraday trades, pay close attention to the key supports mentioned above, and use the MA20/60 on the 30-minute chart as reference points for resistance.

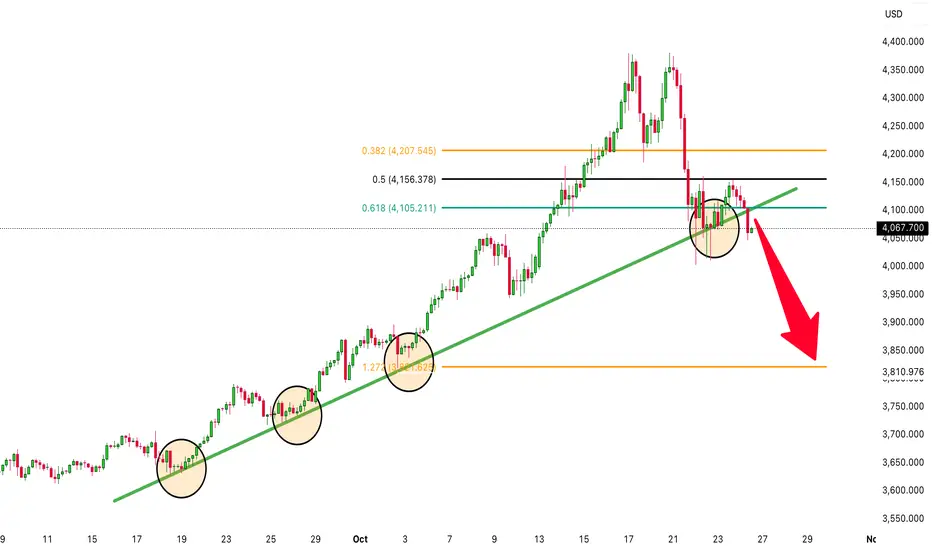
Time for GOLD To DROP! (XAUUSD is heading to the downside!)For many weeks gold (XAUUSD) has been sky rocketing to the upside, however there have been many new signals indicating that it could be a bearish move to the downside. Nothing keeps going up forever! Gold has broken major support levels including the trendline that has been holding it up for weeks. It has also been struggling to break above the fibonacci level of 0.50! Time to sell!
Gold longAfter manipulating asian lows and 4h lows , time for some new longs.
I think during cpi this will send it.

GOLD Has buyers area at 4000 demand zone buy possible from that🚀 GOLD BULLISH OUTLOOK (1H Timeframe) 🏆
📉 Price showing strong demand zone support around 4000 — buyers stepping in with momentum!
💰 Buying Opportunity: 4000 zone
🎯 Technical Targets:
1️⃣ 4074
2️⃣ 4156
📊 Structure remains bullish as long as price holds above 4000 zone. Watch for confirmation candles before entry ✅
#Gold #XAUUSD #PriceAction #TechnicalAnalysis #TradingSetup #BullishMomentum

Gold Intraday Trading Plan 10/21/2025Yesterday gold found support around 4220 and rose by more than 1600 pips to reach previous ATH around 4380. This is crazy, one single day of 1.6k pips difference. As forecasted in my weekly post, I did mention that I see the upside in the initial stage of the week.
Currently gold is at the resistance and if this holds, we could see it drop to 4280. If 4380 resistance is broken, gold could rise to 4425 and even 4481. Otherwise, we could see price actions when it reach 4280.

GOLD BUY!its is time to buy the Gold as well. I will risk 2% per the trade and will expecting 4% of return. Gold is bounce from a strong support area and now heading to the above supply zone.

ANALYSIS FOR THE WEEK Gold retraced down on Friday to create a higher low and tested a major zone around 4190 area, if it closed below 4190 it would have triggered more sells but it didn't and got rejected thereby closing above 4200 and this is a sign of bullish resumption and as a trader with fair understanding of the market the next thing to look for is a buy and the first best place to buy is at 4235-30 and hold it but if you want to really manage your trade, i suggest you close at 4335-40 and if it closes above 4365 then you target a buy again at 4365-60 area and hold for ever,
price could be rejected at 4340 or anywhere within the upper rectangular block and sell to close below 4190 for it to sell more for some days, so to prevent losing gained profits you can close at 4340 in order to be at the safer side incase the market decides to change to long term sells, if you have the courage to hold, then you can hold because the trend is bullish overall and i will update it too, if it decides to change direction i will signal it early before it becomes late.
Clue: if Monday closes with a bullish candle especially above 4365 then we are buying from Tuesday going, but if it closes bearish on Monday (D1) then we will definitely sell from Tuesday going especially if it closes below 4190.
2

GOLD sellsSells idea for continuation bears if friday US CPI data comes in as expected or even higher. which could signical that inflation is still persistant so the FEd my be hesitant to continue any future rate cuts which can results in more capital investor inflows due to the higher returns offered by higher rates.

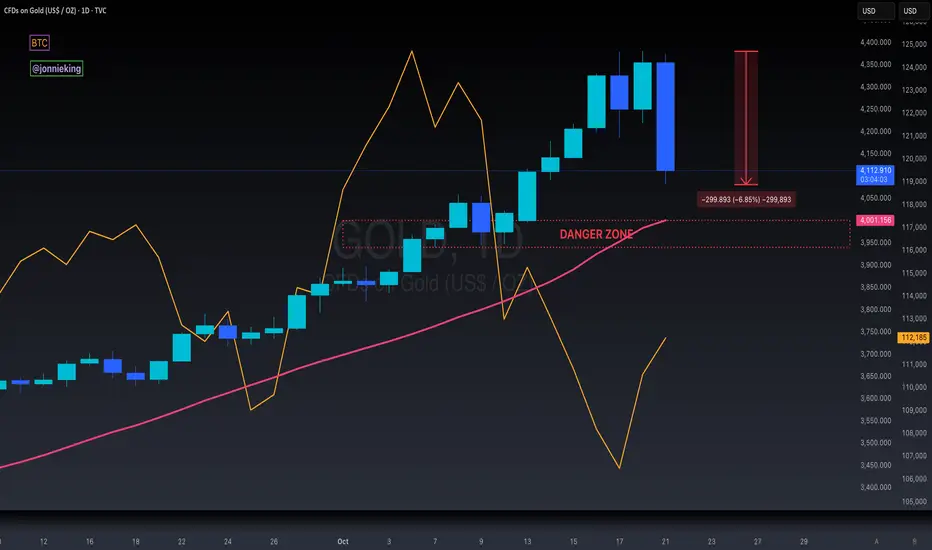
$GOLD Bearish Engulfing on Daily - Rotation to $BTC Incoming!MASSIVE BEARISH ENGULFING FORMING ON THE TVC:GOLD DAILY CHART.
Down ~7% just on the day alone.
~$2 TRILLION has been wiped out on its market cap,
the equivalent of Bitcoin’s entire MC.
We can see the rotation into CRYPTOCAP:BTC in real-time here.
If GOLD Closes below the DANGER ZONE,
it’s game-over for everyone’s favorite pet rock 🪙
XAU/USD – Gold Technical Rebound Prepares for Next Waveb]🔍 Market Context
After reaching a peak at the ATH GOLD 4,391 USD region, gold has undergone a technical correction — reflecting temporary profit-taking following a strong upward trend.
The market structure still maintains a bullish bias as the support zones below (FVG + OB) remain intact and untested.
Currently, the price is hovering around 4,325 USD, indicating that selling pressure has weakened.
Buyers are likely to return at two strategic zones below — where institutional money (Smart Money) typically accumulates positions before the next upward wave.
💎 Technical Analysis
ATH GOLD: 4,391 USD
Liquidity Zone $$$: 4,465 – 4,424 USD → the upper liquidity zone, the main target for the next upward wave.
FVG Zone: 4,284 – 4,267 USD → an unfilled gap, likely to be retested.
Order Block Zone: 4,244 – 4,230 USD → deep discount zone confluence with Fibo 0.786, high probability of strong reaction.
Liquidity Clear $$$: 4,186 – 4,190 USD → the last defense zone of the main upward trend.
Overall structure remains bullish ; the current decline is merely a phase of adjustment to “accumulate liquidity” before continuing the upward momentum.
📈 Trading Scenarios
1️⃣ BUY Setup #1 – FVG Zone 4,267 USD
Entry: 4,267 – 4,270
SL: 4,255
TP: 4,330 → 4,366 → 4,391
✅ Condition: Confirming bullish candle (rejection / engulfing bullish) at the FVG zone or a small BoS appears on M15.
➡️ Short-term “buy-the-dip” setup, leveraging the unfilled FVG zone — where technical buyers often initiate positions first.
2️⃣ BUY Setup #2 – Order Block Zone 4,244 USD
Entry: 4,244 – 4,230
SL: 4,210
TP: 4,284 → 4,366 → 4,391 → 4,424
✅ Condition: Strong confirming candle (engulfing bullish) or a retracement pattern breaking a small BoS back up.
➡️ Swing-buy setup at deep discount zone — confluence of OB + Fibo 0.786, high probability and optimal R:R.
⚠️ Risk Management
Avoid FOMO buying in the middle of the range (4,320–4,340).
Prioritize waiting for clear reactions at 4,267 and 4,244 before entering trades.
If the price closes an H1 candle below 4,210 → pause all buy orders, re-evaluate price action at 4,186.
Maintain moderate trading volume during the current rebound phase.
💬 Conclusion
Gold is in a phase of healthy technical correction within a major upward trend.
The two zones 4,267 USD (FVG Zone) and 4,244 USD (Order Block Zone) are key “accumulation” areas for large capital.
When bullish confirmation signals appear, these will be safe buy positions before gold heads back to the peak 4,391 – 4,465 USD .
👉 Reasonable Strategy:
Buy at 4,267 – 4,270 USD if reversal confirmation occurs.
Buy at 4,244 – 4,230 USD if a strong OB reaction signal appears.
🔥 “Smart money waits at precise levels — not at the top. The next gold wave will emerge between 4.267 and 4.244.”

Review of Gold's Performance This Week📝This week, the gold market experienced severe volatility, showing an overall trend of a sharp decline followed by a volatile rebound. The details are as follows:
📈Price Movement:
On Monday, gold prices fluctuated between 4,218.32 and 4,354.88.
On Tuesday, gold plummeted by 6.3% at one point, marking the largest single-day drop since April 2013.
On Wednesday, it continued to fall, hitting a low of 4,003.43.
On Thursday, gold fluctuated within the range of 4,065.47 to 4,154.52.
On Friday, gold prices fell again, dropping below 4,060 at one stage with an intraday decline of over 1%, and finally closed at 4,110.55.
💡Influencing Factors:
✔The main reasons for the sharp volatility in gold prices this week include the following:
After a rapid rise in early stages, gold was in an overbought state, creating technical correction pressure. Meanwhile, investors had a strong sentiment to take profits, leading to a large number of sell-offs.
✔In addition, the cooling of risk aversion, the strengthening of the U.S. dollar, and the fact that Federal Reserve officials entered a blackout period ahead of the interest rate decision that are resulting in a lack of remarks supporting interest rate cuts in the market also reduced the appeal of gold.
✔However, factors such as the ongoing U.S. government shutdown, geopolitical tensions, and market expectations for further interest rate cuts by the Federal Reserve provided certain support for gold prices.
💎Outlook for the Future:
From a technical perspective:
If gold breaks through 4,161, it may pave the way for a test of 4,200. If it continues to rise, traders may push gold prices above 4,250, or even target 4,300 and higher record highs.
But if gold falls below 4,040, the next target will be the October 22 low of 4,004.

GOLD XAUUSD GOLD ASIAN buy and sell zone based on the price action ,
layer by layer
risk management is key.
#gold


GOLD (XAU/USD) – FINAL GRAND CYCLE ANALYSIS🟡 GOLD (XAU/USD) – FINAL GRAND CYCLE ANALYSIS
“The Rise of Real Money in a Failing Fiat World”
Elliott Waves | Fibonacci | Smart Money | Macro Fundamentals | Market Psychology
📅 Date: October 22, 2025
📍 Current Price: ~$4,039/oz
⏳ Time Horizon: 1970s to post-2050
🎯 Focus: Multi-decade Elliott Wave structure signaling the endgame for fiat currencies
🌐 SUPER CYCLE NARRATIVE – GOLD’S MONETARY METAMORPHOSIS
🔵 Wave I (1971–1980): The Rebirth of Real Money
Gold's first major secular rally began when the Bretton Woods system collapsed and President Nixon ended the U.S. dollar’s convertibility to gold in 1971. Gold soared from around $35 to nearly $875 by 1980. This wave was driven by runaway inflation, the oil embargo, and shattered confidence in fiat money.
🔴 Wave II (1980–1999): The Great Fiat Illusion
Following the 1980 peak, gold entered a brutal 19-year corrective phase, falling to the $250 zone. During this time, the U.S. dollar gained strength, Volcker’s interest rate hikes reined in inflation, and a new era of debt-based prosperity and stock market euphoria unfolded. Gold was dismissed, even by central banks who sold reserves. Structurally, this corrective phase formed a complex WXYXZ pattern , setting the groundwork for the massive Wave III rally.
🟢 Wave III (1999–~2033): The Fiat Reckoning Has Begun
This is the longest and most powerful supercycle wave and the one we are currently in. It is subdivided into five impulsive macro waves. As of now, gold is deep within Wave iii of III , the most explosive phase of the entire structure. The current rally is no longer driven by inflation fears but by existential doubts about the long-term viability of fiat currencies.
📈 Wave I of III (1999–2011): The Institutional Accumulation
Gold rose from around $250 to $1,920 over this period. Triggers included the dot-com bust, 9/11, the 2008 global financial crisis, and the launch of the first gold ETFs like GLD. This wave marked the beginning of institutional interest in gold as a systemic hedge.
📉 Wave II of III (2011–2015): The Disbelief Correction
Gold corrected nearly 45%, bottoming near $1,050. The narrative shifted — QE hadn't caused hyperinflation, the stock market was booming again, and faith in the dollar resurged. Retail abandoned gold, but institutional buyers quietly accumulated from newly created demand zones.
🚀 Wave iii of III (2015–~2026): The True Price Discovery Phase
This is where we are now. Since 2015, gold has exploded upward, driven by COVID-era QE, negative real interest rates, geopolitical instability, and major central banks accumulating gold for cross-border settlements outside the dollar system.
We are currently in the middle of this wave — micro wave (3) of iii — with price around $4,039. According to Fibonacci projections, this wave is expected to peak near $6,552 , corresponding to the 2.618 extension level . If bullish momentum continues, gold could overshoot toward $22,744 , matching the 3.618 Fibonacci extension and marking the likely top of macro Wave III.
In an extreme scenario where fiat trust collapses entirely, the 4.618 extension projects a possible target of $78,940 . All of these levels align with the upper bounds of the long-term logarithmic channel, validating both structure and projections. But most likely this target is for Wave V TOP .
🟣 Wave IV (Projected: 2026–2033): The Great Shakeout
After the parabolic run of Wave iii, a deep multi-year correction is likely. This correction — Wave IV — may retrace toward the long-term red trendline and could coincide with a temporary return to “faith” in fiat through reforms like CBDC rollouts or aggressive fiscal pivots.
This wave could resemble a WXY pattern or large ABC structure and may unfold alongside capital controls, deflationary pressure, and a resurgent tech or dollar narrative. However, this will likely be the last major buying opportunity before gold enters its final, euphoric revaluation.
🟢 Wave V (2033–2045+): The Final Blow-Off Top
Wave V is expected to be driven by an overt crisis of confidence in the global fiat system. Scenarios could include:
Mass adoption of gold-backed or commodity-tied digital currencies
Loss of global trust in the USD as the reserve currency
BRICS or emerging alliances introducing gold into cross-border settlements
Global central banks returning to physical gold as a monetary base
The upside potential here is monumental. The 4.618 Fibonacci extension already targets $78,940 , but under full systemic collapse or monetary reset conditions, gold could reprice toward $100,000–$250,000 per ounce — not as a bubble, but as a return to its role as sound, base-layer money.
📐 Fibonacci Milestones and Structure Alignment
Each major wave has closely respected its corresponding Fibonacci extension. Wave I topped around the 1.618 level ($1,887) . The ongoing Wave iii appears on track to reach the 2.618 level ($6,552) . From there, macro Wave III could stretch toward 3.618 ($22,744) . If Wave V extends fully, a 4.618 projection leads to $78,940 — all within the bounds of the established logarithmic trend channel. In a full-blown systemic reset, price could break even higher.
These levels are not speculative but grounded in structural alignment with Elliott wave geometry , Fibonacci mathematic s, and long-term institutional order flow .
🧠 Smart Money Concepts & Technical Validations
Smart money activity has left clear fingerprints across this cycle. Each break of market structure (in 2016, 2020, and 2023) confirmed higher time-frame bullish continuation. Institutional demand zones — especially during the 2018–2019 consolidation and 2022 pullback — were respected to the dollar.
This cycle isn’t retail-driven mania — it's a stealth institutional accumulation that’s now evolving into price discovery.
📊 Market Psychology Across the Cycle
Investor sentiment has followed classic psychology stages:
From 1999 to 2004, disbelief reigned: “Gold is dead.”
Between 2005 and 2011 came growing awareness: “Gold might work again.”
The 2011–2015 correction brought denial: “It was just a bubble.”
Hope returned in 2016–2020 as price quietly rallied.
From 2022 to 2026, euphoria dominates: “Gold will never go down.”
Wave IV will likely bring fear and capitulation between 2026 and 2033.
Finally, Wave V will ignite mania: “Gold to the moon!”
🚨 Final Synthesis: What This All Means
We are living through the largest repricing of monetary value in modern financial history. Gold is no longer just an inflation hedge — it’s becoming a hedge against the system itself . The structure on the chart doesn't just map price — it maps the collapse of fiat trust and the return of monetary sanity.
Gold is transitioning from:
A commodity hedge →
To a central bank hedge →
To a currency hedge →
And finally, to a system hedge
The current leg — Wave iii of III — is nearing its climax. After a correction in Wave IV, Wave V could take gold into previously unthinkable territory, not because gold changed — but because everything else did.
📌 Final Position Summary
We are currently in wave (5) of iii of III — the most powerful segment of the bull run
The next Fibonacci target is $6,552
The broader Wave III could peak near $22,744
After a correction (Wave IV), the final wave could send gold toward $78,940 , or even into the $100,000–$250,000 zone under extreme monetary reset conditions
This is not a mere forecast — it’s a macro-monetary blueprint for the coming decades.
🌊 "Those who understand the waves will ride them. Those who don’t will be swallowed by the tide." – FIBCOS
📘 Disclaimer: This is an educational market outlook based on technical and macroeconomic structure. It is not financial advice. Always do your own due diligence and risk management.
#XAUUSD #Gold #GoldAnalysis #ElliottWave #Fibonacci #SmartMoneyConcepts #PriceAction #TechnicalAnalysis #MarketStructure #Commodities #InflationHedge #MacroEconomics #CentralBanks #BRICS #MonetaryReset

GOLD Free Signal! Sell!
Hello,Traders!
GOLD SMC based setup forming after price mitigated the horizontal supply area and showed clear rejection. Smart money is likely offloading long positions here before targeting liquidity below recent equal lows.
-------------------
Stop Loss: 4,188$
Take Profit: 4,093$
Entry: 4,139$
Time Frame: 3H
-------------------
Sell!
Comment and subscribe to help us grow!
Check out other forecasts below too!
Disclosure: I am part of Trade Nation's Influencer program and receive a monthly fee for using their TradingView charts in my analysis.

GOLD HTF — Is the Buying Climax reach and the BIG short coming??After a +53% yearly gain and a 10% September candle, we might finally be seeing the start of a two-month distribution phase, smart money taking profit before the end of the year and preparing for re-accumulation lower for next year.
Wyckoff View (Daily):
Possible Buying Climax (BC) followed by Automatic Reaction (AR) and Secondary Test (ST).
If confirmed, the markdown could target the $3,440 zone, where major resistance from earlier structure awaits a retest.
Until proven otherwise, the macro trend is still bullish, but momentum exhaustion and vertical price action often precede deeper retracements.
Trading Plan:
Stay small, stay precise. Scalping on M1–M5 to extract 50–100 pips per day is the play while the big money decides the next leg.
We don’t predict, we react.
Trade like the Casino, not the hopeful gambler.
Touch grass, protect peace, stay grateful.
Be safe, and God bless you all.
