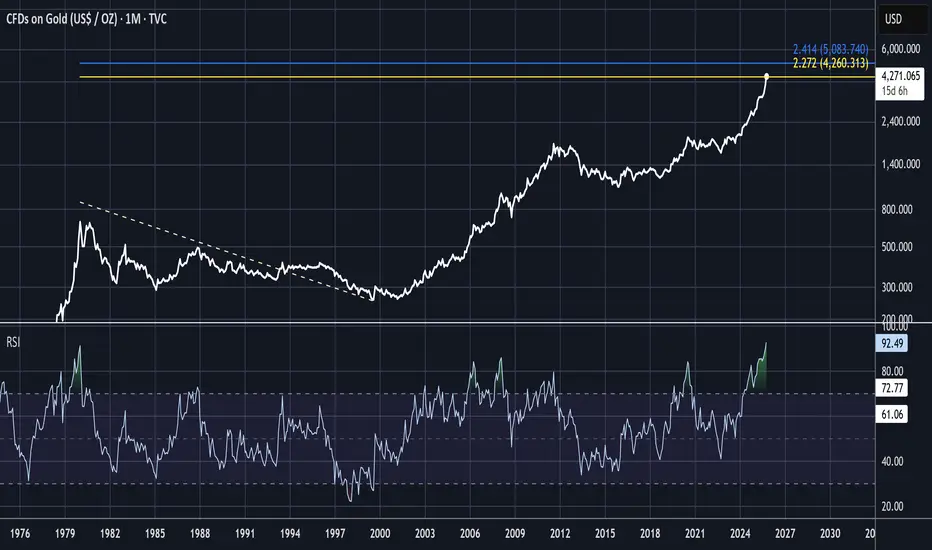
GOLD - Signals That Gold is On The MoonGOLD
Is now hitting the ultra long term 2.272 taking the pivots from the 1980 bear market.
Long term does not mean high accuracy expected and it may well have a loose relationship with the eventual top.
But its another signal that GOLD is very high.
In addition, the month RSI is suddenly as high as its ever been since 1980.
Soooo, its time for a cautious trader to take profit.
This analysis is shared for educational purposes only and does not constitute financial advice. Please conduct your own research and consider that crypto is a dangerous market.
Trade ideas
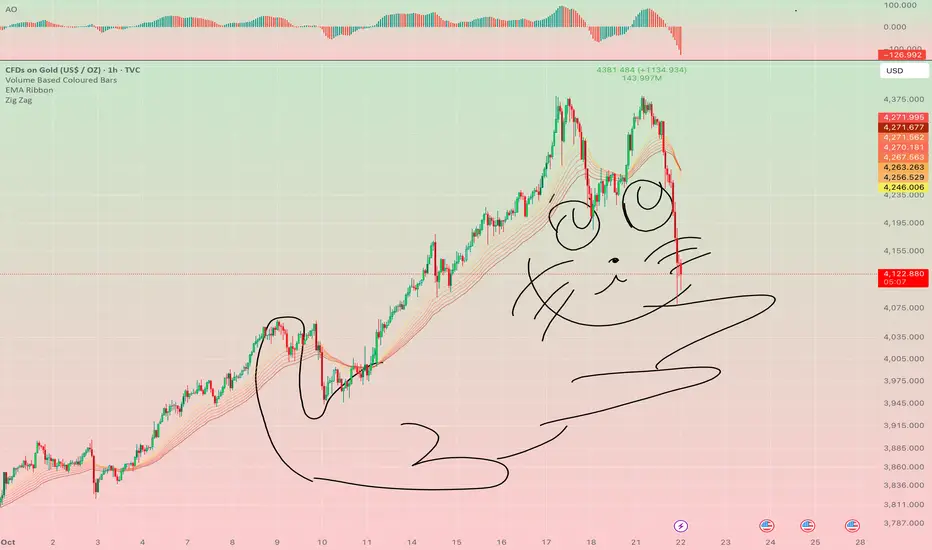
Gold price acts like a catWe call this type of price action cat.
Can see clearly from the chart.
No explain needed.
GOLD USDHI GUYS,
We are in London session sells to price action pattern H1, H2 TAKE profit will be 4087.117

xauusd longhey friends, ive deeply watched momentum and volume and i can confidently say that gold's next stop is 4260, now its forming a double top around 4240, it can pullback and after confirmation we can enter buy trade.
your comments are welcome and together we can learn more , thank you

The last upward wave of GOLDInitially, our expectation was that wave-(i) of (E) would be a diametric, which in the analyses we said its wave-g could move up to $4200, and gold touched $4180. But a corrective wave formed from around 4058 to 3942, and given the high price similarity between the waves, the scenario of forming a symmetrical has been strengthened.
If the gold price can powerfully break above 4200, we can expect gold to continue its growth to the range of 4330-4401 dollars.
Given that we are in the final upward waves of gold, I should add one point to the above:
- Until a strong, fast, and large downward movement bigger than waves b-d-f-h occurs in the market, we cannot confirm the completion of wave-(i) of (E). In the higher degree pattern, wave-(E) in my opinion can grow at most to 4401 dollars. If this level is broken, it will not be very stable.
Long-term Analysis 👇👇
Good luck
NEoWave Chart

XAU/USD 4H Analysis — Bearish SetupGold has reached an overextended zone near the upper volatility bands after a strong bullish rally. Momentum shows early exhaustion, and price is reacting from a Fibonacci resistance area with rejection candles forming.
🔻 Bearish Confluences
Upper Band Rejection — Price touched the top volatility channel, signaling overbought conditions and potential for mean reversion.
Fibonacci Resistance Zone — Current rejection occurs around the 0.618 retracement (≈ $4,253), a key reversal level.
Candle Weakness — Wicks on recent candles show rejection of higher prices, indicating seller absorption near resistance.
📉 Fibonacci Downside Targets
Measured from the latest swing high to the local low:
Target 1: 0.382 → $4,166 — first support / partial TP zone.
Target 2: 0.618 → $4,098 — major confluence with mid-channel EMA cluster.
Target 3: 1.000 → $3,985 — full retracement target and potential bounce area.
⚠️ Invalidation
A 4H candle close above $4,255 would invalidate the short-term bearish setup.

Gold at a Critical Crossroad: Bounce or Breakdown Ahead?Hi!
The gold price is currently trading around $4,042, sitting just above a critical support area near $3,953.80. This gray zone is a key decision point for the next major move.
Trend Structure:
The broader trend remains bullish, moving within a well-defined ascending channel.
Double Top Formation:
A short-term double top has formed near recent highs, triggering a corrective move down into the channel’s midline and the gray support area.
Critical Support Zone ($3,953.80):
This level aligns with previous structure support and the channel’s bottom, making it a high-probability reaction zone.
________________
Scenario 1: Bullish Reaction (Primary Scenario)
If gold holds above the gray critical area and bounces within the ascending channel, we could see a renewed bullish wave.
Confirmation: A strong bullish reaction or higher low around $3,953–$3,980.
Target: The green target zone around $4,619.57, corresponding to the upper channel boundary and a potential measured move from the recent correction.
Scenario 2: Bearish Breakdown
If the gray area fails to hold, it could signal deeper downside momentum.
Trigger: A clean break and 4H close below $3,953.80.
Target: The pink support zone near $3,656.01, which aligns with prior accumulation and the lower channel boundary.
________________
Disclaimer: As part of ThinkMarkets’ Influencer Program, I am sponsored to share and publish their charts in my analysis.

Gold - Possible intermediate topAfter the multi week rally we are heading into the DCL.
The first stop during this drop will be the tag of the 200 EMA on the hourly at 4129$.
Daily chart will be posted after after the close.

( HANZO Gold Protocol ) Bearish Reversal DetectedTime Frame: 30-Minute Warfare
Entry Protocol: Only after volume-verified breakout
🩸Bearish Reversal - 4240
🆚 Reasons To Enter The path
————
➕ Volume Engaged & Confirmed
➕ Time Zone Aligned (London / NY)
➕ Liquidity Cleared Below
➕ Cluster Shield Active
➕ Delta Shift Showing Buyer Control
➕ Reversal Formation Detected
➕ Price Below POC – Ready for Retrace
➕ Entry Prepared with Zero Emotion
Gold prices begin to recover, big fluctuations⭐️GOLDEN INFORMATION:
Gold (XAU/USD) drops below $4,100 in Wednesday’s Asian session, extending its sharpest selloff in over a decade as traders lock in profits after a nine-week record-breaking rally. Easing US-China trade tensions ahead of the November 1 tariff deadline further dampen safe-haven demand.
⭐️Personal comments NOVA:
Currently, the gold price fluctuates greatly and moves quickly. There are signs of recovery and retreat to the resistance zone around 4235.
⭐️SET UP GOLD PRICE:
🔥SELL GOLD zone: 4235 - 4237 SL 4242
TP1: $4222
TP2: $4200
TP3: $4170
⭐️Technical analysis:
Based on technical indicators EMA 34, EMA89 and support resistance areas to set up a reasonable SELL order.
⭐️NOTE:
Note: Nova wishes traders to manage their capital well
- take the number of lots that match your capital
- Takeprofit equal to 4-6% of capital account
- Stoplose equal to 2-3% of capital account

Gold Intraday Trading Plan 10/21/2025Yesterday gold found support around 4220 and rose by more than 1600 pips to reach previous ATH around 4380. This is crazy, one single day of 1.6k pips difference. As forecasted in my weekly post, I did mention that I see the upside in the initial stage of the week.
Currently gold is at the resistance and if this holds, we could see it drop to 4280. If 4380 resistance is broken, gold could rise to 4425 and even 4481. Otherwise, we could see price actions when it reach 4280.

Enjoying the Profits / #5,000.80 mark nextQuick update: I am on semi-vacation / not Trading currently due spectacular results I have made on current Bull run and therefore decided to take small vacation and rest. I am constantly getting messages of liquidated Sellers in attempt to find local Top’s and Sell Gold however my practical suggestion remains the same: do not Sell Gold at all costs / this is undisputed Bullish trend and total Bullish domination. Also, reversals on Gold will happen, of course an asset cannot only soar or fall, however those declines in form of a correction are only sweeps to cool down critically Overbought levels however Gold will stay Bullish. Keep Buying Gold from local Low’s as I did for past few quartals. I am back from my well deserved rest on Thursday as normal. I do expect Gold to invalidate #4,300.80 psychological benchmark soon enough which will pave the way towards #5,000.80 psychological benchmark extension which remains my Target for the fractal.

GOLD HIGH PROBABILITY SETUP SOON!!!🚨 XAUUSD HIGH PROBABILITY BUY SETUP 🚨
* Here We Can See Clearly The Next Potential Moves For GOLD Coming Hours.
* Keep Your Eyes Close On Your Trading Positions.
* Happy PIP Hunting Traders.
FXKILLA.

XAUUSD 4H Double top - Bearish setup📉 Technical Overview – Bearish Confluences
Double Top Formation:
Price rejected twice around the 4380–4385 zone, forming a potential double-top structure — a classic reversal pattern signaling exhaustion in bullish momentum.
Break Below Support Zone:
Price is now trading below the short-term support (~4330–4340), confirming a potential neckline break and bearish continuation signal.
Momentum Shift:
Recent candles show strong bearish bodies with increased volatility, indicating sellers taking control. The upper channel rejection also aligns with this bearish bias.
Fibonacci & Channel Confluence:
The rejection occurred near the 61.8% retracement zone of the last swing, and price is now heading toward lower channel support levels — further confirming downside pressure.
🎯 Fibonacci Bearish Targets
Target 1 – 38.2% level: $4,377 → $4,324 zone
(Short-term corrective target; minor support zone)
Target 2 – 61.8% level: Around $4,193
(Mid-term support aligning with previous demand area)
Target 3 – 100% extension: Around $4,068
(Full double-top measured move completion and major support area)

XAUUSD- Amazing low risk high reward trade!Based on our deep analysis we can see that XAU/USD (gold) will head to the upside. Great time to BUY - it has broken all major resistance levels and has nowhere else to go except upwards. It is also struggling to break past powerful support levels.

GOLD Is this a Super Cycle??XAUUSD (Gold) has been rising non-stop basically since the last time it made contact with (and bounced on) the 1M MA50 (blue trend-line) two years ago (October 2023). Contrary to what many believe, a technical correction may not be coming soon as this long-term bullish trend resembles the Super Cycle that started in the early 2001.
So far Gold is within a Channel Up since 2018 and the next correction may take place well within 2026 and closer to the 3.0 Fibonacci extension. In any case, if this is indeed a new such Super Cycle, Gold represents a sound long-term investment up until at least $8000, which would be again a +660% rise from the Bear Cycle's bottom (as in the previous Cycle).
Do you think history will repeat itself?
-------------------------------------------------------------------------------
** Please LIKE 👍, FOLLOW ✅, SHARE 🙌 and COMMENT ✍ if you enjoy this idea! Also share your ideas and charts in the comments section below! This is best way to keep it relevant, support us, keep the content here free and allow the idea to reach as many people as possible. **
-------------------------------------------------------------------------------
💸💸💸💸💸💸
👇 👇 👇 👇 👇 👇

The week aheadWatch the balance low on SPY for a false break and then dramatic move up. BTC similar idea, Gold could rally to make another divergent high, which would be another short opportunity.

XAUUSD Direction Outlook: October 21, 2025XAUUSD Direction Outlook: October 21, 2025
Gold prices (XAU/USD) are experiencing a notable pullback today, correcting lower from recent record highs amid profit-taking and a strengthening US Dollar. As of midday, the pair is trading around $4,255-$4,327, down approximately 2% from Friday's peak near $4,380. This downward movement reflects short-term bearish pressure, with technical indicators signaling exhaustion in the prior rally and potential for further declines if key supports break.
Key Influencing Factors
- **US Dollar Strength and Trade Optimism**: A rebounding USD, with the DXY near one-week highs at 98.84, is weighing on gold as a non-yielding asset. Hopes for de-escalation in US-China trade tensions, including avoidance of steep tariffs and positive developments from the APEC Summit, have boosted risk appetite and reduced safe-haven demand.
- **Federal Reserve Expectations**: Markets are pricing in a near-certain 25-basis-point rate cut at the October 29-30 Fed meeting, alongside another in December, which broadly supports gold by lowering opportunity costs. However, the ongoing US government shutdown has delayed key data releases, adding uncertainty.
- **Upcoming Data Catalyst**: Traders are eyeing the delayed US CPI report on October 24, forecasted at 3.1% year-over-year. A softer-than-expected reading could reinforce dovish Fed bets and spark a gold rebound, while hotter inflation might extend the current correction.
- **Broader Market Sentiment**: Despite today's dip, central bank demand, lower bond yields, and lingering geopolitical risks (e.g., trade wars, equity hedging) maintain an underlying bullish backdrop. Recent X discussions highlight dip-buying interest, with analysts targeting recoveries to $4,365-$4,395 if supports hold.
Technical Analysis and Levels
The daily chart shows an intact uptrend with higher highs and lows, but overbought momentum indicators suggest a healthy consolidation phase. A double top pattern has emerged on shorter timeframes, with the price breaking below the 21-period SMA, confirming near-term weakness. RSI displays bearish divergence and is dipping toward 50-55, while the price has fallen below the ascending channel's midline.
| Level Type | Price (USD) | Significance |
|------------|-------------|--------------|
| Resistance | 4,373-4,380 | Recent highs; breakout could resume uptrend |
| Resistance | 4,400-4,430 | Psychological barriers; extension targets |
| Support | 4,266-4,313 | 50-EMA and immediate downside buffer |
| Support | 4,200-4,220 | Key neckline; bulls' defense line |
| Support | 4,180-4,187 | Deeper correction zone if breached |
Today's Direction and Forecast
For October 21, the primary direction is **bearish with a corrective bias**, potentially testing supports at $4,266 or lower toward $4,200 if selling persists. However, this appears as a temporary reset within a larger bullish structure, with no major reversal signals yet. Bulls remain in control above $4,200, and a close above $4,378 could invalidate the bearish setup, aiming for new highs near $4,400. Expect volatility around economic news, but the path of least resistance leans upward longer-term unless CPI surprises hotter. Traders should monitor for dip-buying opportunities, as recent sentiment on X emphasizes rebound potential.

GOLD PENDING SELL - Day 9 WIthdrawal ChallengeGOLD PENDING SELL - Day 9 WIthdrawal Challenge
A+ Setup
same setup as usual breakout of zone waiting for retracement and closure back in to zone
Entry: 4233.50
2 Tps (yellow lines)
1st TP set SL to breakeven and take partials
Once again today could be the last day of the challenge
use proper risk managment as once again gold keeps making ATHs over extending our zones

XAU/USD Gold Bullish Move (Readmore)...🚀 XAU/USD (Gold) Technical Breakdown 💰✨
Gold has successfully reacted from the demand zone at 4105, showing strong bullish momentum from the current level 4140 🔥
🧠 Technical Outlook (1H Timeframe):
The recent double pattern formation indicates a strong reversal setup — bulls are stepping back in with conviction 💪
🎯 Bullish Targets:
1️⃣ 4168 – First resistance zone / intraday target
2️⃣ 4208 – Key breakout level
3️⃣ 4280 – Extended bullish target if momentum continues
📊 Bias: Bullish above 4105 support zone
⚙️ Strategy: Look for buy opportunities on dips or confirmation candles above 4140–4150 zone
#XAUUSD #Gold #Forex #TechnicalAnalysis #PriceAction #BuyTheDip #GoldForecast

Watch Out, Gold Bulls Are Preparing for a Powerful CounterattackAfter Friday's nearly $200 drop, our primary concern is shifting market sentiment. To be honest, after experiencing such a deep drop, it is understandable that the market has obvious differences, but if it continues to fall today or there are obvious signs of selling, it may indicate that this round of brilliant rise may have reached its peak in the short term!
We can see gold showing clear signs of a rebound after touching around 4186. However, with bullish confidence severely impacted, a short-term recovery may be difficult and will require some time to build momentum. Based on the current market structure, after a top-to-bottom reversal, resistance is clearly located between 4280 and 4300, with the starting point acting as the key resistance level. Failure to break above this area in the short term could lead to short-term weakness in the gold market.
If gold doesn't show clear signs of selling in the short term, the overall trend will remain volatile. Bulls may rely on the 4200-4190 and 4160-4150 levels for effective counterattacks. These two areas are crucial for bulls!
The short-term trading strategy is clear:
1. If gold retreats to the 4200-4190 area, consider going long on gold and setting a protective cover.
2. If gold continues to retreat to the 4160-4150 area, reconsider going long on gold and setting a protective cover.
3. If gold rebounds to the 4280-4300 resistance area, consider going short on gold.

XAU (Gold) Final Pattern Update and Key Resistance LevelsI predicted XAU (Gold) on Binance Square on March 18, 2025, about its above resistance levels (screenshot attached for reference).
XAU is currently forming its last pattern on the quarterly candle chart. If it gets rejected from the above resistance, a massive pullback is expected.
XAU has already skipped several supports, with the lowest noted at $35, which could be reached in the first quarter of 2030. I am not saying XAU will reach that level, but the skipped supports are still waiting to be tested.
If it gets rejected and fails to sustain above resistance, the next support level will be $3,303, and the pattern could go even lower.
The first major supports are $1,846 / $1,707, but it may extend down to $1,292 / $1,046, and then to its key break pattern support at $919.
This $919 level is very important. If it breaks, it would confirm a potential drop toward the bottom at $428 / $35.
However, if XAU breaks above the resistance at $4,707 / $4,727 and successfully holds this level as support, new targets will be $5,539.
Above future resistances:
$7,115 / $7,217
$7,759 / $8,245
$9,206
Maximum high noted $11,954 / $13,022
This message is for educational information.
Always DYOR.
Gold: Keep an eye on the 4280–4300 rangeAs we predicted for today’s target range, gold is currently fluctuating between 4230 and 4250. After stabilizing above 4230, it once again staged a strong rally, peaking at 4250.91 before pulling back with a certain decline — this also confirms the resistance effect at the 4250 level today.
However, we confirm that a break above 4250 can be achieved in an instant. After breaking through and stabilizing above 4250 next, we will focus on the resistance zone around 4280–4300. For short-term support below, the key focus remains on the range of 4200–4175.
