GOLD hold resistance ? What's next??#GOLD.. our area was 4213 as we discussed.
But market broke that level for 3 times but that everytime that was a fake breakout as you can see on chart .
So our area is same tha tis 4213 14
Substain above that level can invalidate the selling move.
NOTE; we will cut n reverse above 4213 14 on confirmation.
Good luck
Trade wisely
Trade ideas

GOLD MARKET ANALYSIS AND COMMENTARY - [Dec 01 - Dec 05]This week, international OANDA:XAUUSD prices rose from 4,040 USD/oz to 4,226 USD/oz and closed at 4,219 USD/oz.
Gold prices continued to rise this week because the market is “betting” that the FED will cut interest rates this coming December. In addition, gold demand surged in China as inventories at the Shanghai Gold Exchange (SGE) fell to their lowest level in a decade.
In reality, the slowdown in private-sector job growth and limited data from the U.S. government indicate weak economic activity and subdued inflation. This will continue to fuel expectations of a FED rate cut.
Next week, the market will receive several important data releases. On Monday, attention will be on the ISM Manufacturing PMI for November, followed by the ISM Services PMI on Wednesday, along with ADP private-sector employment data for October, which will be monitored more closely than usual due to the absence of NFP data. On Thursday, the U.S. will release weekly jobless claims, core PCE, and the preliminary University of Michigan Consumer Sentiment Survey for December.
📌Technically, on the H4 chart, the gold price has broken through the Downtrend line and is moving towards the next resistance zone around 4245. If it breaks this level, the gold price will approach the 4370-4380 zone. If it fails to break the 4245 barrier, the gold price will likely move sideways within the 4045-4245 range.
SELL XAUUSD PRICE 4276 - 4274⚡️
↠↠ Stop Loss 4280
BUY XAUUSD PRICE 4178 - 4180⚡️
↠↠ Stop Loss 4174

XAUUSDHello Traders! 👋
What are your thoughts on GOLD?
Gold corrected upward as expected, reaching the top of the descending channel and the resistance zone, where it showed a clear price rejection.
In this region, gold is expected to show some consolidation and liquidity buildup, followed by a renewed bearish move toward the lower marked levels.
Political and geopolitical developments — especially talks and the possibility of a peace agreement between Ukraine and Russia — may accelerate this bearish movement.
As long as price fails to break above the resistance zone and the channel top, the short-term outlook remains bearish, and any upward correction should be viewed only as a pullback.
Don’t forget to like and share your thoughts in the comments! ❤️

GOLD: With FED officially ending the QT, Further Upside.For TVC:GOLD – Expecting Further Upside
With the FED officially ending Quantitative Tightening (QT) and a high probability of a rate cut in December, combined with expectations of a new FED Chair, the macro environment is supporting GOLD.
Add to this the historical seasonality where gold tends to perform strongly into year-end, and the overall picture remains bullish.
🔹 Lower interest rates = weaker USD and stronger gold
🔹 End of QT = more liquidity flowing back into markets
🔹 Geopolitical uncertainty + risk hedging continues to support safe-haven assets
🔹 Bond yields showing signs of topping, reducing pressure on gold
Based on these factors, we expect GOLD to push up and potentially make new highs.
Always remember WTW 4 Golder Rules:
1) Do not jump in
2) Do not over risk/trade
3) Do not trade without Stop Loss
4) Never ever add to a losing position!
Trade with care
We Trade Waves
WTW Team
Disclosure: We are part of Trade Nation's Influencer program and receive a monthly fee for using their TradingView charts in our analysis.

Can XAUUSD extend the uptrend on Fed rate-cut hopes?Macro approach:
- Rising expectations of Fed rate cuts are supporting gold prices, with markets now assigning a roughly 85% probability to a Dec reduction amid softer US economic data.
- Ongoing US dollar weakness and signs of cooling in the US labor market are likely to keep providing a tailwind for gold on the upside.
- Softer US Treasury yields and a more dovish Fed stance, together with a slowing labor market, may continue to bolster safe-haven demand for gold.
Technical approach:
- After retesting the EMA21, XAUUSD has moved toward resistance at 4208, with a breakout above the Symmetrical Triangle suggesting scope for further bullish continuation.
- A sustained move above 4208 could open the way for XAUUSD to target the previous ATH area at around 4365.
- However, if XAUUSD fails to secure a close above the triangle breakout, the price could pull back toward the next support area around 4054.
Analysis by: Dat Tong, Senior Financial Markets Strategist at Exness

GoldXAUUSD
- Consolidation Phase in Long Time Frame
- Impulse Correction
- Completed " 12345 " Impulsive Waves and " AB " Corrective Waves
- Break of Structure
- Bullish Channel as an correction in Short Time Frame

XAUUSD Bulls are done!! Entering bear marketGold rejected heavily from the 4327 supply zone, aligning with the top of the regression channel. Momentum is weakening, and price is struggling to hold above the mid-range levels — signaling a potential deeper correction.
Price is sitting at a premium zone with multiple bearish signals lining up.
This is an ideal area to look for shorts — sell big, set your stop, and set-and-forget.
🔻 Bearish Confluences
Strong rejection from 4327 (major supply).
Price reacting from the upper channel and losing bullish strength.
Bearish momentum divergence on the latest push up.
Daily structure starting to show a potential reversal.
🎯Fibonacci Downside Targets
TP1: 4214 (38.2%) – early correction level
TP2: 4144 (61.8%) – mid-channel support + fib cluster
TP3: 3750 (100%) – full downside extension & major higher-timeframe demand
As long as price stays below 4327, bearish continuation remains favored.

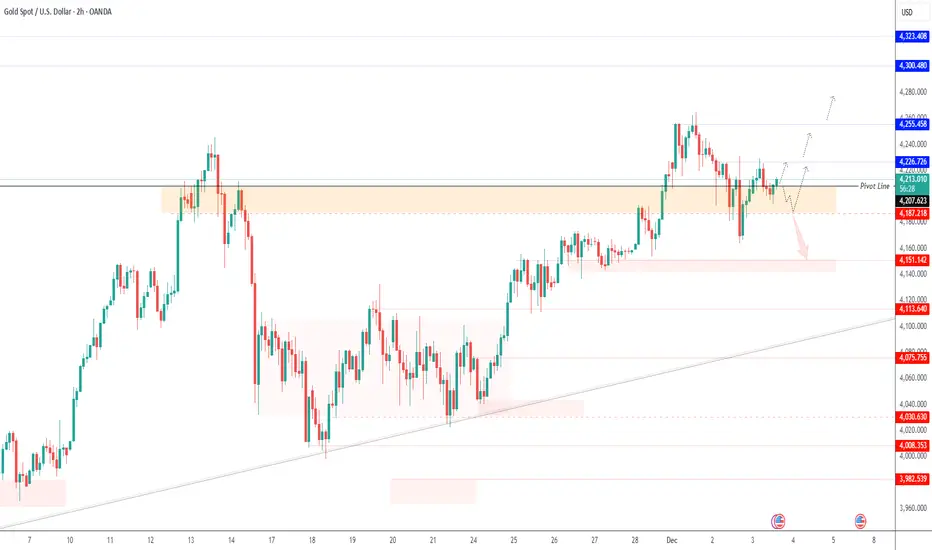
GOLD – MARKET OUTLOOK | Watching 4207 for DirectionGOLD – Technical Overview
Gold retreated from the $4,255 level reached on Monday and is now trading with short-term bearish pressure.
As long as price remains below 4207, gold is likely to test 4187.
A 1H close below 4187 will confirm continuation of the bearish trend toward 4151, with further downside pressure possible.
To regain bullish momentum, gold needs a 1H close above 4207, which would open the way toward 4233 and 4255.
Key Levels
Pivot Line: 4207
Support: 4187 · 4151 · 4113
Resistance: 4233 · 4255 · 4300

GOLD BEARS ARE STRONG HERE|SHORT
GOLD SIGNAL
Trade Direction: short
Entry Level: 4,173.52
Target Level: 3,864.42
Stop Loss: 4,378.26
RISK PROFILE
Risk level: medium
Suggested risk: 1%
Timeframe: 1D
Disclosure: I am part of Trade Nation's Influencer program and receive a monthly fee for using their TradingView charts in my analysis.
✅LIKE AND COMMENT MY IDEAS✅

GOLD Resistance Ahead!
HI,Traders !
#GOLD keeps growing
But will soon hit a horizontal
Resistance of 4229.11
So after the retest we will
Be expecting a local
Bearish correction !
Comment and subscribe to help us grow !

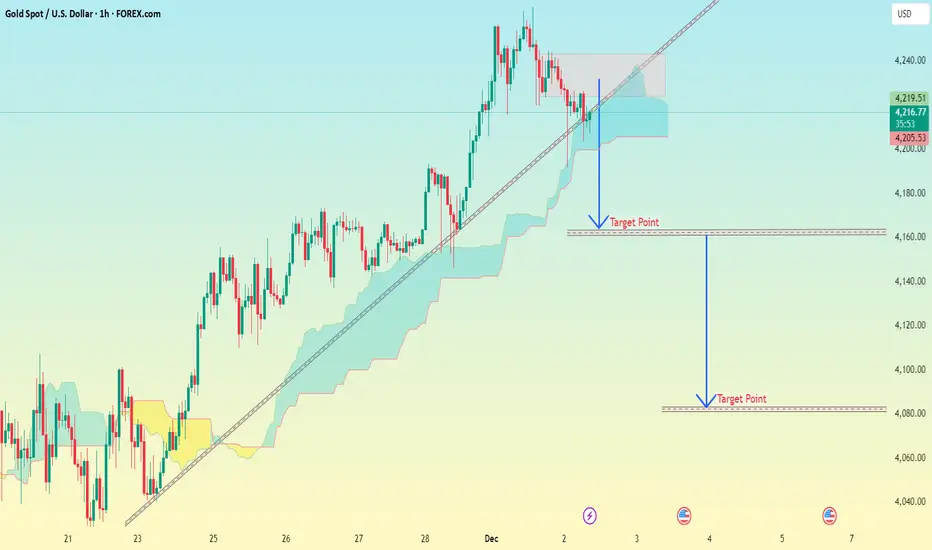
Xauusd 1H chart Pattern..Here is a clean professional analysis with accurate targets based on the chart I'm shared (trendline break + cloud retest + liquidity zones):
---
📉 XAUUSD Analysis & Targets
Market Structure
Price broke the ascending trendline
Currently retesting the cloud support zone
Sellers are strong from 4235–4245 supply zone
Liquidity is resting below 4180 & 4160
---
🎯 Target Levels (Based on Analysis)
🔻 TP1: First Breakdown Target
4185 – 4178
Reason: First liquidity pocket + trendline retest.
---
🔻 TP2: Major Support Target
4165 – 4155
Reason: Imbalance fill + cloud lower band + horizontal demand.
---
🔻 TP3: Extended Drop Target
4120 – 4105
Reason: Large imbalance area + my lower drawn target zone.
---
🔻 TP4 (Deep Target / Final)
4095 – 4085
Reason: Strong historical demand + liquidity sweep zone.
---
📌 Summary
Target Level
TP1 4185–4178
TP2 4165–4155
TP3 4120–4105
TP4 4095–4085
Gold possible move Gold is currently bouncing from a rising trendline support around 4022–4040, indicating buyers are still active in this zone. If price holds above this support, we may see a bullish move toward the first resistance at 4089, followed by 4133. A breakout above these levels can push price toward the upper target zone around 4212–4243.
However, if price breaks below the trendline, further downside toward 3996 may follow.

Gold: eyeing breakout levels?After some consolidation, the price of gold continued its rally on Friday, closing the week at $4.230. The latest move was triggered by investors' expectations that the Fed might cut interest rates, two weeks from now, by another 25 basis points. Also investors' sentiment is turned toward the expectation that the economic output in 2026 will be lower. Analysts are also noting that the demand for gold has weakened among Asia retail buyers, considering its all time highest levels.
During the week, the RSI was slowly moving toward the overbought market side. The indicator reached the level of 63 at Friday's trading session, leaving some space for the upside until the clear overbought market side is reached. The MA50 and MA200 continue to move without a change, as two parallel lines with an uptrend.
Current charts are showing that the price of gold has some space to move toward the upside, until the peak from id-November is reached, at the level of $4.240. In case that this level is breached, then the gold will continue toward the latest ATH at $4.377. In case of a short-term reversal, the trend line bottom currently stands around $4.100. For the week ahead, both levels are open, based on the current charts.

GOLD: Bullish Above 4151 as Fed Cut Odds Hit 80%FX:XAUUSD is trading above 4151, supported by a weaker U.S. dollar and rising expectations of Federal Reserve policy easing.
Recent U.S. data added to this momentum:
-PPI inflation showed signs of slowing
-Retail sales and consumer confidence came in weaker
-Market expectations for a December Fed rate cut have climbed to 80%
However, progress in Russia–Ukraine negotiations is capping aggressive upside movement.
Today, markets focus on jobless claims and durable goods orders, both of which could shape short-term volatility.
Gold is holding steadily above 4151, which supports continuation of the bullish momentum toward 4172 and 4207.
A breakout above 4207 would open the path toward 4236–4237.
If the price closes a 1H candle below 4150, a correction toward 4128 is expected.
Pivot Line: 4151
Resistance: 4172 · 4207 · 4236
Support: 4140 · 4128 · 4113

GOLD | Data-Driven Momentum Ahead of ADP & PCEGOLD – Technical Overview
Gold prices are rising as investors await key U.S. economic data this week for clearer signals on the Federal Reserve’s interest-rate outlook.
Markets are watching ADP employment, ISM Services, and the PCE price index, all of which are expected to influence rate-cut expectations.
According to the CME FedWatch Tool, traders now price in an 87% probability of a December rate cut.
Meanwhile, physical demand remains firm, with ETFs increasing their gold holdings for the fifth consecutive day, supporting overall bullish sentiment.
Technical Analysis
Gold maintains bullish pressure as long as it trades above 4207, targeting 4226 and 4255.
A breakout above 4255 could extend momentum toward the 4300 zone.
However, a 1H close below 4207 will trigger a bearish correction toward 4187.
A break below 4187 would further confirm a bearish trend continuation toward 4173 and 4151.
Key Levels
Pivot Line: 4207
Resistance: 4226 · 4255 · 4300
Support: 4187 · 4173 · 4151
GOLD – MARKET OUTLOOK | Watching 4208 for DirectionGOLD – Technical Overview
Gold is approaching the 4187 support level, and a break below this zone would open the way toward the next supports at 4169 and 4151.
From 4151, a bullish rebound is likely as this level represents a strong demand zone.
On the upside, a 1H close above 4208 would shift momentum back to bullish, targeting 4226 → 4233, and a breakout above this area may extend the move toward 4255.
Key Levels
Pivot Line: 4208
Support: 4187 · 4172 · 4151
Resistance: 4226 · 4233 · 4255

GOLD BEARS WILL DOMINATE THE MARKET|SHORT
Hello, Friends!
GOLD is making a bullish rebound on the 4H TF and is nearing the resistance line above while we are generally bearish biased on the pair due to our previous 1W candle analysis, thus making a trend-following short a good option for us with the target being the 4,132.94 level.
Disclosure: I am part of Trade Nation's Influencer program and receive a monthly fee for using their TradingView charts in my analysis.
✅LIKE AND COMMENT MY IDEAS✅

GOLD ALERT: Sharp and Clean Sell OutlookHello my friends. Without wasting any time, I’m sharing my concise and clear bearish outlook with you.

GOLD (XAUUSD): Another BoS
A quick follow-up for the yesterday's post for Gold.
The price successfully bounced and broke another intraday resistance,
setting one more local higher high on a 4H.
The market will most likely continue rising following the plan
and reach 4205 soon.
❤️Please, support my work with like, thank you!❤️
I am part of Trade Nation's Influencer program and receive a monthly fee for using their TradingView charts in my analysis.

GOLD BIGGEST FALL COMING ? IS THE END OF BULL RUN ? GOLD H1 !!Greetings
Gold H1 Time Frame We Have A Strong Selling Zone On Multi Time Frames And Gold Has Gaves Us Confirmation For Sell , It Has Respected The Selling Zone And Gold Price Gives Rejection From Selling Zone Now We Have To Sell Gold With A Confirmation Patterns And Structures Target Will Be Sell Side Liquidity
200 / 500 Pips Move We Need To Capture, Pending Sell Side Liquidity
Gold Buying Zone

XAUUSD: Gold Continues to Rise on Rate Cut ExpectationsGold continues its upward trend from yesterday, with the current price at 4,159.455 USD. The chart shows that gold is moving within a stable upward channel, and if it maintains above this support level, there is a high likelihood that the price will continue towards the 4,190,000 USD level.
Why is gold continuing to rise?
Weaker-than-expected U.S. retail sales data has reinforced the forecast that the U.S. Federal Reserve (Fed) will cut interest rates in December 2025. This has weakened the USD, which in turn reduces yields and increases gold's appeal as a safe-haven asset. These factors, combined with expectations of rate cuts, suggest that gold has the potential to continue rising sharply.
Next Scenario:
If the price of gold stays above the 4,120,000 USD support zone, there is a high probability it will break through the 4,190,000 USD resistance level. The potential for continued upward movement could push gold to 4,230,000 USD in the near future.
With strong support and a favorable market backdrop, XAUUSD is likely to continue this upward trend, especially as labor market data from the U.S. is released.

Recovery - Gold price continues to increase above 4200✍️ NOVA hello everyone, Let's comment on gold price next week from 12/01/2025 - 12/05/2025
⭐️GOLDEN INFORMATION:
Gold (XAU/USD) pulls back from its two-week high near $4,200 in early European trading on Friday, sliding toward the lower end of its intraday range. A firmer US Dollar—extending its rebound from a one-and-a-half-week low—combined with upbeat equity sentiment is redirecting flows away from the safe-haven metal.
⭐️Personal comments NOVA:
Gold prices continue to recover as December rate cut odds increase: heading towards resistance 4244, 4356
🔥 Technically:
Based on the resistance and support areas of the gold price according to the H4 frame, NOVA identifies the important key areas as follows:
Resistance: $4244, $4356
Support: $4145, $4089
🔥 NOTE:
Note: Nova wishes traders to manage their capital well
- take the number of lots that match your capital
- Takeprofit equal to 4-6% of capital account
- Stoplose equal to 2-3% of capital account
- The winner is the one who sticks with the market the longest

H&S Scenario on 4H | Jobless Claims could decideFX_IDC:XAUUSD H&S SCENARIO
Until Thursday morning, trader sentiment about another rate cut was around 80%-90% in favor, but the sentiment on the Gold price since the beginning of the week has been highly undecided 🤔 due to several economic data releases which were not strong enough to give Gold a clear direction.
Data: ( Actual | Forcasted | Previous)
Monday, December 1, 2025 🗓️
S&P Global Manufacturing PMI (Nov) 52.2 | 51.9 | 52.5 ⬆️
ISM Manufacturing PMI (Nov) 48.2 | 49.0 |48.7 ⬇️
ISM Manufacturing Prices (Nov) 58.5 | 59.5 | 58.0 ⬇️
Fed Chair Powell's speech omitted any important mentions of economic conditions or the rate cut process, focusing instead on the political processes surrounding the selection of a new Chair. 🏛️
Tuesday, December 2, 2025
CPI (YoY) (Nov) 2.2% | 2.1% |2.1% ⬆️
Wednesday, December 3, 2025
ADP Nonfarm Employment Change (Nov) -32K | 5K | 47K ⬆️
S&P Global Services PMI (Nov) 54.1 | 55.0 | 54.8 ⬇️
ISM Non-Manufacturing PMI (Nov) 52.6 | 52.0 |52.4 ⬆️
ISM Non-Manufacturing Prices (Nov) 65.4 | 68.0 | 70.0 ⬇️
U.S. President Trump Spokes about drugs and car costs mostly 🗣️
If the Gold price continues to decline past $4225 and reaches the Neckline support at around $4174 - $4179, then a further drop could send the price breaking through the Neckline and Gold could drop primarily to $4110, and secondarily down to the $4070 to $4020 mark. 📉
The Initial Jobless Claims announcement at 8:30 AM ET on Thursday, December 4, is expected to determine the next step for Gold and potentially provide a clear direction. 📰
If the actual Initial Jobless Claims figure is higher than expected, this could push Gold back toward the $4250 resistance level. ⬆️ Conversely, if the figure is lower, I anticipate the price will either fall or continue to trade sideways in the $4186 - $4225 range. ⬇️ ⚖️
The Initial Jobless Claims data may be ineffective in driving Gold's price due to the significant economic data releases scheduled for Friday, December 5. ⚠️
Core PCE Price Index (MoM) (Sep)
Core PCE Price Index (YoY) (Sep)
The technical analysis regarding the Head and Shoulders (H&S) pattern is primarily a trader-driven sentiment result. While it typically acts as a reversal signal following a recent uptrend, the pattern on higher time frames (such as the 4-hour chart) does not always offer a clear direction, and the price does not consistently follow its implications. Keep this in mind and monitor economic data releases closely.
My bias remains bearish until a clear market shift occurs.
Buy for Sell: $4200 - $4215
Late entry could be $4179 when Initial Jobless Claims look good.
Stop Loss: $4230
TP 1: $4167
TP 2: $4153
TP 2: $4116
TP 3: $4070
-------------------------------------------------------------------------
This is just my personal market idea and not financial advice! 📢 Trading gold and other financial instruments carries risks – only invest what you can afford to lose. Always do your own analysis, use solid risk management, and trade responsibly.
Good luck and safe trading! 🚀📊
