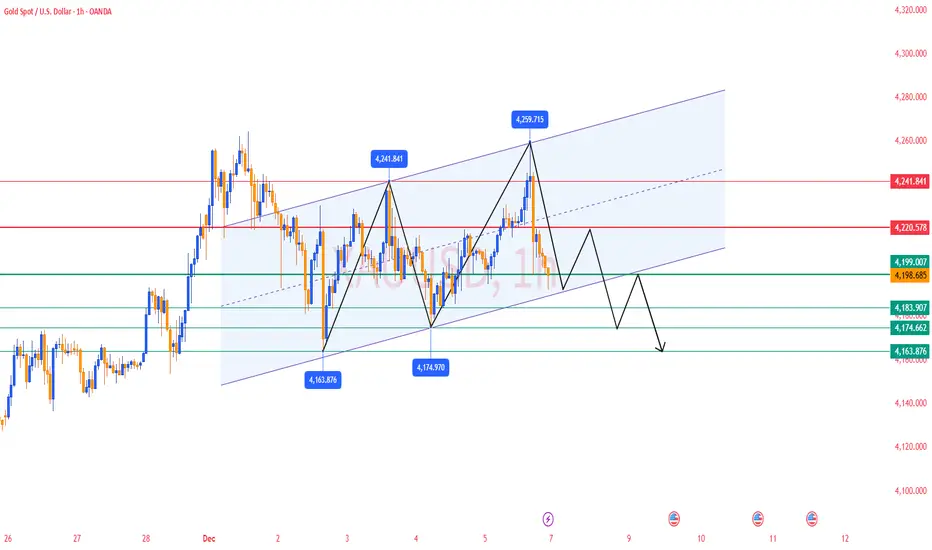
$XAUUSD FORCAST BULLISH ANALYSIS ( READ CAPTION )hi traders! today 07 DECEMBER 2k25 here is my today XAUUSD analysis please read it and send me your ideas in comment section for more analysis.
OANDA:XAUUSD pivot point is 4199, XAUUSD long channel support holding buyers target 4300.
structured bullish progression after a period of heavy distribution inside the supply zone. Earlier, gold established wide range between the supply and demand areas, with multiple sharp rejection, forming the top of the structure. eventually, sellers pushed the price lowers initiating a corrective declined that developed into a well-defined Triangle Pattern, market by a descending Triangle demand line. This compression ended with a clean breakout to the upside, signaling the beginning of a new bullish phase. Following the breakout, XAUUSD formed a Pivot point near the mind-range level, where price briefly rejected before continuing its upward trajectory. Another notable phase was the formation of an inverse Head-and-Shoulders structure conforming buyers strength after a fake breakout below the neckline this reversal pattern provided the foundation for current bullish continuation.
Please dont forget like and comment for latest XAUUSD updates
This analysis for informational purposes only. Trade is own your risk.
Trade ideas

Gold Analysis & Trading Strategy | Next Week Preview✅ Gold fluctuated within a $100 wide range this week, with repeated whipsaws, and finally closed with a doji, indicating ongoing tug-of-war between bulls and bears.
Looking ahead to next week, range trading is expected to continue, and the downward adjustment window may open around mid-December.
→ The primary strategy remains selling the rallies (shorting at highs).
✅ Daily Chart (D1) Trend Analysis
On Friday, gold showed intraday upward movement
Topped near 4259 and then pulled back to the starting point
Daily candle closed as another doji
➡️ Lack of bullish continuation → Upward momentum is still weak
✅ 1-Hour Chart (H1) Structure
Moving averages are crossing back and forth
→ No one-sided momentum, price remains range-bound
Upside still capped below 4265
Support remains focused around 4160
📍 If price pulls back to 4160 and holds → Short-term buying opportunity
📍 If 4160 breaks → Gold may open further downside potential
🔴Resistance Levels
4220–4230 → Short-term rejection zone
🟢Support Levels
4174–4170 → Key support area
4160–4165 → Bull/Bear boundary
✅ Trading Strategy Suggestion
Short-term Focus: Sell the highs as the main strategy, buy the dips as secondary
🔰Look for light short entries around 4220–4230
🔰Look for light long opportunities only if 4160–4165 holds well
⚠️ Risk Reminder
Market remains in a washout consolidation phase
Rapid shifts in sentiment may occur
✔ Use light position sizing
✔ Apply strict stop-loss
✔ Adjust based on real-time price action
Gold Out Look For Week of 12/7 - 12/13/25Gold Closed Bearish Daily Time Frame Friday 12/5/25
Gold Broke Through 3 Key Lvls and is Now Below 4200
I Think Based On PA Price might want to play out 4200 as S. T. R.
Support Turned Resistance
Maybe Come Back and Setup Buys at 4185 support zone or at 4175 qrt. key lvl

Gold Weekly Summary and Forecast 12/6/2025Gold has closed with another 2W candle with a bullish green bar. I am still expecting it to rise for the next two weeks. Buying is still my main strategy.
For next week, I will expect price to test 4152 and rise from there. Ultimate target will be 4400.

XAUUSD- GOLD FORMING "W" PATTERN KEY (READ CAPTION)Hello trader's what do you think about gold
Gold (XAUUSD) is currently forming a clear W Pattern / Double Bottom structure, which is a strong indication of a potential bullish reversal in the market.
Support Levels
Support 1: 4180 — A strong reaction zone where buyers have previously held the market multiple times.
Support 2: 4293 — A higher support zone that can act as a continuation level if price respects it on a pullback.
Market Outlook
The price action is showing a clean W pattern, suggesting that if the neckline breaks, we can expect a strong bullish move.
If price retraces downward, both 4180 and 4293 serve as ideal buy zones for buyers preparing for the next bullish leg.
Technical Summary
W Pattern → Potential bullish reversal
4180 → Deep correction support
4293 → Continuation support
please don't forget to like comment and follow

Gold further downside next weekGold price had closed below 5 day moving average for the past 3 days, this would be a sign for further downside. This is also the third time the gold price is unable to break above 4250 area.
There should be further attempts to try to break above, in the mean time, momentary retracement should be on the cards next week.
This retracement might be to gather further strength to break to the upside later.
Trading strategy -> continue to buy on dip, control small lot size.

XAUUSD ON TRENDLINE 4194XAUUSD ON TRENDLINE 4194
H1 timeframe gold running in trendline now gold on trendline support
if gold taking same trendline then our target 4228 4254
if break of trendline then gold will bearish
This is not financial advice , Chart is for Educational analysis only

Gold Trade Set Up Dec 5 2025Gold has broken above PDH and tapped into a strong supply area with SSL, Low range liquidity and PDL below. So i will be looking for 5m-15m bearish engulfing and CISD to make a correction lower to sweep SSL

XAUUSD ANALYSIS📉 GOLD ANALYSIS (1H Timeframe)
Price has pushed back into a major supply zone between 4225–4230, a level that has previously acted as strong resistance. This area still holds sellers, and the reaction here suggests potential downside if price fails to break above the zone.
🔴 Invalidation Level
A clean break and hold above 4238 invalidates the bearish setup and opens the door for higher targets.
📌 BEARISH SCENARIO (Most Probable Based on Structure)
If the supply zone continues to reject price, we can look for continuation to the downside toward the next liquidity pools:
🎯 Target 1: 4199
First major support and previous demand flip.
This is the most conservative target.
🎯 Target 2: 4175
Deeper pullback zone where price has previously built demand.
Likely to be hit if momentum continues.
🎯 Target 3: 4150
Final downside target — a high-volume area where buyers previously stepped in.
📚 Summary
Gold is tapping into a strong supply zone.
As long as price remains below 4238, bearish continuation is favored.
Clean downside targets: 4199 → 4175 → 4150.
Break above 4238 flips the bias to bullish.

Is Gold Setting Up a Swing Rally?XAU/USD Accumulation Highlights🏆 XAU/USD "GOLD VS U.S DOLLAR" - Metals Market Opportunity Blueprint 📊
Swing Trade | Bullish Wyckoff Accumulation 💎
📍 MARKET SETUP
Asset: XAU/USD (Gold vs U.S. Dollar)
Timeframe: Swing Trade (4H-Daily)
Pattern: Bullish Wyckoff Accumulation Phase ✅
Market Structure: Accumulation Zone Identified 🎯
🎯 ENTRY STRATEGY - LAYERING METHOD ("THIEF STRATEGY")
Multiple Limit Order Entry Points:
Using the Layering Strategy - Scale in with multiple limit orders at different levels for optimal position management.
Layer 1 Entry: $3,960 (33% Position Size) - First Entry Point 🔵
Layer 2 Entry: $4,000 (33% Position Size) - Second Entry Point 🟢
Layer 3 Entry: $4,040 (34% Position Size) - Third Entry Point 🟡
📌 NOTE: You can increase/adjust layers based on your risk tolerance and capital allocation. Flexibility is key to the Thief Strategy.
⛔ STOP LOSS
Recommended SL Level: $3,880 (Below Accumulation Base)
Risk Per Trade: Adjust based on your personal risk management strategy
⚠️ DISCLAIMER: This is NOT a recommendation. Adjust your stop loss according to YOUR OWN STRATEGY and RISK TOLERANCE. Your capital, your rules. 🛡️
🚀 PROFIT TARGET
Primary Target: $4,360 (Strong Resistance + Overbought Zone)
Key Resistance Levels:
⚡ Strong resistance confluence zone
Overbought signal indicates profit-taking zone
Be cautious of potential reversal traps near target
💰 DISCLAIMER: This is NOT a recommendation for exit points. Secure profits based on YOUR OWN RISK MANAGEMENT. Take gains when you're comfortable. 📈
📊 RELATED PAIRS TO MONITOR (CORRELATION ANALYSIS)
🔴 INVERSE CORRELATION (Move Opposite to Gold)
TVC:DXY (U.S. Dollar Index) 📉
When DXY strengthens → XAU/USD weakens
When DXY weakens → XAU/USD strengthens
KEY POINT: Monitor DXY weakness as bullish trigger for gold rally
FX:EURUSD 💶
Strong negative correlation with gold
Euro weakness = Gold strength (Flight to Safety)
Watch for Euro breakdown below key support levels
🟡 POSITIVE CORRELATION (Move Together)
OANDA:XAGUSD (Silver vs USD) 🔗
Typically moves 70-80% correlated with gold
KEY POINT: Confirms broader precious metals strength
If XAGUSD breaks resistance, XAU/USD usually follows
FX:GBPUSD (British Pound vs USD) 🏴
Weak positive correlation with gold
Weak GBP = Risk-off sentiment = Gold demand rises
Watch for GBP weakness as confluence signal
🔵 MACRO DRIVERS TO WATCH
US Treasury Yields (10Y, 2Y) 📊
Higher yields = Lower gold attractiveness
Lower yields = Higher gold demand
CRITICAL: Monitor Fed announcements & rate expectations
SP:SPX (S&P 500) 📈
Risk-on sentiment weakens gold demand
Risk-off sentiment strengthens gold
Market crashes = Gold surges (Safe Haven)
⚡ CONFLUENCE SIGNALS FOR THIS SETUP
✅ Bullish Confluence When:
DXY shows weakness/breakdown
XAGUSD confirms precious metals strength
Moving Averages align bullishly
Wyckoff accumulation phase completing
⚠️ Invalidation Signals:
Break below $3,880 SL (Accumulation base failure)
Strong DXY rally
Risk-on market rally (Equities surge)
💡 TRADER'S NOTES
🎯 Best Timing: Scale entries during DXY weakness or Fed pivot signals
📍 Sweet Spot: Layer entries $3,960-$4,040 range for optimal averaging
🛑 Risk Control: Never risk more than 2-3% per trade
💰 Profit Taking: Consider partial profits at each moving average resistance
⚖️ FULL DISCLAIMER
🔹 This analysis is for educational purposes only
🔹 Always conduct your own research & due diligence
🔹 Past performance ≠ Future results
🔹 Manage your risk responsibly
🔹 Your capital, your responsibility, your choice 🛡️
📌#XAU/USD #Gold #Swing Trade #Wyckoff #TechnicalAnalysis #FX #Metals #Trading #DayTrader #Accumulation #LayeringStrategy

XAUUSD Breakout Rejection – Bearish Correction SetupPrice recently experienced a strong bullish push into the Friday session, followed by a breakout and rejection at the highlighted zone. The breakout area (blue circle) shows exhaustion as buyers failed to maintain momentum, indicating a potential shift in market structure.
After the breakout, price is forming early signs of a bearish correction, suggesting a possible move lower. If bearish momentum continues, we may see price targeting the demand zone around 4201–4198, where previous liquidity and imbalance exist.
Key points:
• Breakout rejection shows weakening bullish sentiment.
• Expecting a short-term pullback if structure continues to break down.
• Main target zone lies within the blue demand area, where a reaction may occur.
This scenario remains valid as long as price stays below the breakout level.

HOT GOLD: PCE ENDS THE PARADOX!📰 Fundamental Analysis (FA): Opposing Forces
US Labor EXTREMELY STRONG (Lowest unemployment in 3 years, job reduction 53%) Leading to USD INCREASE.
Forecast of RATE CUT 85%+ (Next week) + Geopolitical risks Leading to STRONG SUPPORT for non-yielding Gold.
Decision Point: Await today's PCE Index data. Higher than expected PCE will be a strong shock for Gold!
🎯 Technical Analysis (TA):
Price is compressed within an accumulation range.
SELL Zone (Supply Zone): 4,220 - 4,231
Wait for reaction here to find Short opportunities.
BUY Zone (Demand Zone): 4,180 - 4,193
Wait for confirmation candles to find Long opportunities.
💡 Core Strategy
Market lacks clarity. Avoid big bets before PCE. Safe trading is to wait for a breakout or surf within the narrow range of 4,180 - 4,231 and manage risk tightly!
#XAUUSD #PCE #Gold #Forex #Trading

Gold Stalls Near 4,200 USD Ahead of the Fed MeetingGold is entering a sensitive phase as technical structure signals strong compression, while macro news continues to create a wait-and-see sentiment ahead of the upcoming Fed meeting.
From a technical perspective, the Volume Profile paints a very clear picture: the 4,220 USD area is a major resistance, as this is where heavy volume accumulated — a zone where sellers previously appeared in force and continue to exert pressure. In contrast, the 4,180 and 4,200 USD zones act as key support levels, with trading activity showing that buyers are still fairly active there. At the same time, the Fair Value Gaps around these price levels remain unfilled, providing a technical cushion for potential retests before a new trend forms.
Given the current context, the most realistic short-term scenario is continued consolidation around 4,200 USD, with 4,220 acting as an upper “firewall” and 4,180 serving as a reliable floor. In the broader outlook, if the Fed confirms a rate-cut cycle, the 4,280–4,300 target range is well within reach. Conversely, a more hawkish tone could trigger a pullback before gold resumes its larger bullish trend.

1212 XAUUSD Trading Plan on FridayHello traders,
XAUUSD Trading Plan – December 12
(Based on 5/13 EMA, Fib Levels & 4-hour Chart)
1. Market Context
Gold remains in a strong bullish trend:
5/13 EMA is in a bullish alignment (short-term EMA above long-term EMA);
Price has broken through the "Breakthrough Level (4236.51)", with bullish momentum continuing;
RSI (14) is near 70 (slightly overbought), so a minor pullback may occur before further upside (avoid chasing highs blindly).
2. Core Strategy: Buy on Pullback (Priority Execution)
Entry Conditions
Price retraces to the 4225-4230 zone (meets both: ① 0.886 Fib support; ② 13 EMA support area), confirmed by a bullish 4-hour candle close.
Stop Loss
Below 4200 (breaks 13 EMA + 0.618 Fib level; risk exposure ~25-30 pips).
Take Profit
1. First target: 4285 (current swing high; profit potential ~55-60 pips);
2. Second target: 4329.74 (1.27 Fib extension; profit potential ~99-104 pips).
3. Secondary Strategy: Buy on Breakout
Entry Conditions
Price firmly holds above 4285 (3 consecutive 4-hour candles close above this level, with increased volume).
Stop Loss
Below 4265 (5 EMA support; risk exposure ~20 pips).
Take Profit
4329.74 (1.27 Fib extension; profit potential ~44-45 pips).
4. Risk Management
1. Limit position size to ≤2% of total capital per trade;
2. Exit immediately if price breaks below 4200 (avoid counter-trend trades);
3. Monitor Fed comments/geopolitical news and adjust stops accordingly.
Good Luck !
LESS IS MORE!


XAUUSD: Market Analysis and Strategy for December 11thGold Technical Analysis:
Daily Resistance: 4265, Support: 4145
4-Hour Resistance: 4250, Support: 4170
1-Hour Resistance: 4224, Support: 4204
In the short term, the Fed's dovish signals have significantly cooled market expectations for a rate cut in January. The dollar's decline may slow temporarily, and expectations for continued gains in gold and silver may weaken. The risk of a pullback at high levels should be noted. We need to pay attention to the market's further interpretation of the Fed's decision and focus on next week's NFP employment data.
In the medium to long term, if the labor market continues to cool or inflation unexpectedly falls, the conservative forecast of only one rate cut in 2026 is likely to be revised, thus opening up more room for precious metals. Silver, in particular, with the combined effects of industrial demand and safe-haven appeal, its current historical high may only be the beginning of a new upward cycle.
Despite fundamental support, gold still faces selling pressure at higher levels in the short term. The daily candlestick chart shows a decline starting after the European session, with the price under pressure at the upper edge of the short-term trading range. Watch for support around the trendline at 4170; the price action may continue with consolidation.
Looking at the 1-hour chart, a triple top pattern has formed. We need to watch for resistance at 4250/4260. The price is trading around the Bollinger Middle Band, and the moving averages are crossing downwards. Support at the lower edge of the short-term sideways trading range is around 4180/4175.
Trading Strategy: Watch for a reaction around 4190/4180/4170. Buy on dips after a bottom is established.
SELL: 4250~4260 near
More Analysis →

Gold? Launch 11/12
Hi,
We had a launch few hours ago.
Up 1% from trajectory.
*trailling
The washing of profits are real :) haha
So in the chart.
Multiple targets.
You see.. everyone sees it differently. Dont judge them or indulge with an obsession of opinion.
Because scenario change, news data, flows are always ongoing.
Some see it BULLISH from 1min perspective ; he's right . even though end of day it close lowest of the week (in the red)
Some see BULLISH even though he's down -100$-200$ or -5%, he see it as a safe haven. And sees it be up 20K or 50K per ounce.
Well there is no lack in opinions.
Most important, you should have your own!
Timing, entry, SL , targets & judgements.
Only wish the best.
Not a guru, no alpha here.. :)

XAUUSD – Bullish Continuation Setup ExplainedAs we can see, Gold has been respecting every important structural point on the 4H chart. The entire move from early November until now can be divided into accumulation, expansion, correction and reaccumulation.
The first phase started with accumulation in early November. Price built a base with controlled higher lows, engineered liquidity and a slow rise under a descending structure. Liquidity was taken from the downside multiple times, which showed that the market was preparing for a stronger directional move.
The second phase was expansion. Price broke the descending structure with strong displacement candles, left behind a fair value gap and continued upward until it reached the upper supply order block. That zone reacted immediately, proving it was a valid OB. The breakout phase also created imbalances and unmitigated demand pockets, confirming that institutional money pushed the move.
After tapping the supply zone, the market moved into the correction phase. This correction formed a clean descending path into a bullish order block. Price reacted strongly from this zone and entered a consolidation range. This consolidation acted as reaccumulation, showing that buyers were not done yet and were absorbing all selling pressure inside the range. The internal structure inside this box remained bullish with protected lows.
Recently, price returned to the same bullish order block and rejected again. This rejection is important because it confirms that the OB is still active and that buyers continue to defend it. With price holding above the OB, the market structure remains in a bullish state.
Currently, price is compressing toward the upper imbalance region. Liquidity sits above the recent equal highs, and the fair value gap above is still unmitigated. As long as price remains above the bullish order block, the expectation is a continuation move to fill the imbalance first and then reach back toward the upper supply order block around the 4300 area.
If price breaks below the OB, the structure shifts into deeper correction, but at the moment there is no clear evidence of that scenario. Buyers are still maintaining control through consistent reactions and protected lows.
The overall bias remains bullish while price trades above the order block. Gold appears to be preparing for the next impulsive leg toward the imbalance and upper supply zone.

Gold Stalls at 4195, Awaiting BreakoutGold is currently trading around 4195 and moving sideways after the recent decline, showing that the market is still waiting for a clear breakout signal.
Technical Outlook:
The price is stuck between 4188–4202, indicating consolidation. Buyers are defending the lower zone, while sellers are still dominating below 4205. A breakout from this range will likely determine the next directional move.
Market Bias:
Gold is neutral-to-bearish as long as it stays below 4205.
Trading Strategy (Short-Term):
🔻 SELL XAU/USD
Entry: 4198 – 4202
TP: 40 / 80 / 200 pips
SL: 4206
🔺 BUY XAU/USD
Entry: 4188 – 4191
TP: 40 / 80 / 200 pips
SL: 4184

XAU / USD 4 Hour ChartHello traders. Gold shot up today, the Fed cut rates a bit more. The current 4 hour chart is marked for where I would look for a continuation up or a rejection and a move down to take out any existing long postions. Let's see how the overnight sessions play out, as well as the daily candle. Big G gets a shout out. Be well and trade the trend. Happy Wednesday / Thursday :)

XAUUSD PATHThe possibility that will occur with gold is a temporary surge caused by uncertainty or due to the liquidation of traders who use excessive leverage. We know that after this FOMC meeting, the direction of the US economy will become clear, although there are many other factors such as global tensions between China and Japan, which have recently caused uncertainty, Japan's interest rate hike, the unresolved conflict between Iran and Israel, and the unfinished peace agreement between Ukraine and Russia. However, looking at several catalysts for 2026, I believe gold prices have already been priced in. My analysis may be incorrect if gold manages to break through the $5,000 mark due to increased uncertainty. However, what is currently visible is that 2026-2027 will be a year of weakening and ranging prices for gold. Therefore, take advantage of this for short-term trading with proper money management so that you can beat the bookies.
I hope my analysis is helpful to you.
Please leave your questions and comments.
I will try to respond to them.
Good luck

goldbias: buy
setup: Ew+Ict
Confirmation:
1) sbt
2) rsi
3) dow theory (break previous high)
Entry:
1- FR + FVG
notes:
wave2/4- FR range/fvg/ Shape Ratio
wave3/5- Candle Momentum/ict

Gold BuyPrice is still bullish so im looking for continuation to the upsdie and price has sweeped a low during open of NY, an inducement(LG) to buy.
