XAUUSD Potential High Reward Buy SetupBuy Entry @ 4006
SL @ 3951
TP @ 4406
THis is High Reward Swing Trade
Trade ideas

Gold Spot (XAU/USD) 1-hour timeframe ...Gold Spot (XAU/USD) 1-hour timeframe I'm using the Ichimoku Cloud setup with Fibonacci or horizontal resistance levels marked.
Here’s the analysis breakdown:
Current price: around $4,261
Ichimoku cloud: price is retesting the cloud top, showing potential for bullish continuation if it holds above the cloud.
My drawn levels and arrows indicate a pullback to around $4,250–$4,260, followed by a bounce toward the upside.
🎯 Target Point (based on my chart and Fibonacci zones)
The blue arrow and upper red arrow point toward:
Target zone: around $4,360 – $4,380 USD
🔍 Summary
Element Level (Approx.)
Current Price $4,261
Support / Cloud Base $4,240 – $4,250
Resistance / Target $4,360 – $4,380
Stop-loss (suggested) Below $4,230 (below the cloud and recent low)
This suggests a potential bullish move of about $100–$120 from current levels if the price confirms above the cloud and breaks $4,300 resistance.

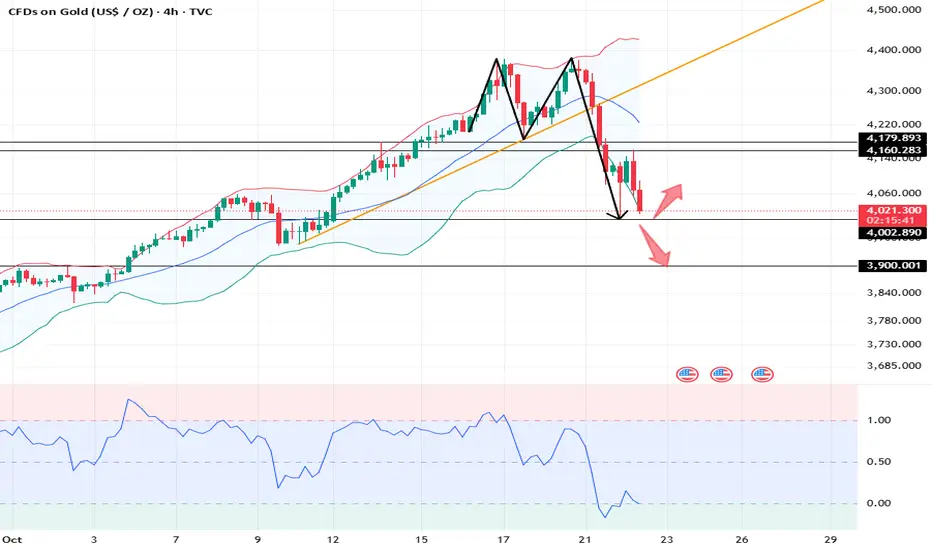
GoldGold surge stopped with high volume and weak candle in weekly chart
so if reverse happened with breaking small degree key level so price could fall to demand zone around 4000 - 4040
#MA_Intermarket

Beyond the Chart - GOLD Market Technicals & Fundamentals CAPITALCOM:GOLD Short Bias 🔻
Market structure shows a confirmed BOS and CHoCH signaling a short-term shift in order flow.
Multiple FVGs stacked above highlight trapped liquidity zones with price reacting cleanly from those imbalances.
Current bias remains short-term bearish expecting a corrective leg toward 4,270 region to fill lower FVGs and potentially test the channel base before any new expansion.
A short retracement to mitigate upper FVGs remains possible but structure favors downside continuation for now.
🧠 Fundamentals:
CPI data and the Fed’s tone continue to drive sentiment. Stronger USD keeps pressure on gold while dovish signals could slow the drop. Geopolitical headlines may still trigger safe-haven demand swings.
No luck, just structure & precision. ⚡️

Gold Tests Key Support of Double Top FormationGold is testing the neckline of the double-top pattern. The selloff has been sharp, so a clean break below support is unlikely today, even if it retreats below 4200. The base case is a short-term rebound toward the 4250–4270 zone before a potential break lower.

Gold Consolidation a Next Growth OpportunityGold prices are currently consolidating after recent volatility. On Friday, the market broke its local structure, slightly shifting overall sentiment and prompting traders to focus on the current consolidation zone.
On Tuesday, gold prices rose as easing U.S.–China trade tensions and reduced concerns over banking sector credit risks supported risk appetite. However, this improved sentiment also limited gold’s upside as some safe-haven demand faded. Despite signs that the rally may be overextended, investors continue to show buying interest in gold.
Recently, gold experienced a breakout followed by a sharp pullback, reaching support near 4244. The price has since rebounded and is currently trading around 4270. If the price continues to test and break above the immediate resistance, there is a strong potential for upward movement towards 4318–4358. Conversely, failure to sustain above 4248 and a close below this level could trigger further downside pressure, potentially pushing the price towards 4200 or lower correctio.
You may find more details in the chart.
Trade wisely best of luck Buddies.
Ps; Support with like and comments for better analysis Thanks for Supporting.

gold on reverse#XAUUSD we wait price on M15 closure above 4265 to buy.
Entry 4265 M15 closure short target 4278, second target 4302 and last 4320. Stop loss 4250
Below the 4246 on one time breakout will drop the pair till 4206 limit.
4278 holds reverse but breakout above 4283 will continue bullish.

XAUUSD - Signal#XAUUSD - Signal
H4 - Double top formation + potential rebound from the level. Stop loss beyond the local maximum. Reduce risks.
Entry: 4345.714
TP: 4283.916 - 4186.789 - 4066.133 - 3991.360
Stop: 4386.930

XAUUSD is going downGold (XAUUSD) is showing signs of potential downside continuation after a sharp rejection from recent highs. The daily candle formed a long upper wick and closed below the midline of the green band — indicating profit-taking and emerging selling pressure.
Bearish Influences
Rejection Candle: Strong upper wick signals sellers defending resistance near the 4,180–4,200 zone.
Loss of Momentum: Price slipped below the short-term support band, suggesting weakening bullish control.
EMA / Structure Confluence: The current pullback aligns with the lower trendline slope and prior breakout structure — a likely retracement phase forming.
🎯 Fibonacci Bearish Targets
If price fails to reclaim the 4,180 level and bearish momentum persists, look for these downside targets:
Target 1 (0.382 Fib) → $4,047 – $4,050
Minor support and initial retracement level.
Target 2 (0.618 Fib) → $3,943 – $3,950
Key Fibonacci confluence and previous structure support zone.
Target 3 (1.000 Fib) → $3,814 – $3,820
Full retracement target aligning with the lower green volatility band — potential swing low zone.

A POSSIBLE TREND CHANGE ON THE WAY We are likely to see more sells to create maybe a higher low on D1 and if possible a bearish W1 candle and a higher low on weekly too, if this current H1 candle in the sphere/ellipse closes bearish by 3am UTC you can sell if you want to .

Bias Compression: Breakout or Breakdown Incoming.XAU/USD Final October Outlook — Structure, Pressure Zones, and Bias Control
As October draws to a close, Gold continues to respect its technical framework, maintaining a disciplined corrective structure after the mid-month rejection from the upper resistance zone. The chart now reveals a series of pressure zones, each represented by a triangular formation — a visual depiction of directional bias and momentum buildup.
The green triangle reflects the current buy pressure zone, where price is attempting to stabilize after the recent sell leg. A sustained move within this area could trigger a short-term rebound, leading price back toward the Major Benchmark at 4,369. A confirmed breakout above this level would signal a structural shift, opening the path toward the Initial Monthly Target at 4,619.
Conversely, the red triangle represents the sell pressure zone, where bearish continuation remains dominant. As long as price action remains inside this red triangle, selling pressure is expected to persist, promoting further downside momentum through the Sell Continuation phase. However, an exit above the red triangle would invalidate the bearish structure, signaling exhaustion in the current downtrend and potential reversal strength building into early November.
The Sell Continuation Target at 3,374 stands as the completion point for this corrective wave should bearish momentum remain intact.
In summary, each triangle serves as a visual boundary of market intent — buyers defending the green zone, sellers maintaining control within the red. October’s final sessions will determine which side ultimately dictates November’s opening structure.
Final October note: Structure remains intact, pressure zones are clearly defined, and momentum balance will dictate the next major move.

Gold at a Critical Crossroads: Surge to $4700 or Drop to $3500?If the price breaks through the yellow zone, it could reach the red zone range. And if it doesn't cross the yellow zone, there's a chance it could head toward the 4700 range

GOLD → Correction after aggressive growthFX:XAUUSD is in a correction phase after a month and a half of aggressive growth. The price is forming a trading range and continues to storm support...
The record growth was overheated, and traders are closing long positions. A gradual change in the fundamental background and market sentiment is also provoking an outflow of funds. However, US-China negotiations, the ongoing US shutdown, and the tense geopolitical situation, including the cancellation of Trump's meeting with Putin, create additional risks in the economy, which may support the metal.
The correction in gold looks like a healthy pause. The $4,000 level remains key support. A recovery above $4100 indicates continued buyer interest, but further dynamics depend on news about trade negotiations.
Resistance levels: 4082, 4107, 4163
Support levels: 4059, 4000
A breakdown of the trading range support could trigger further sell-offs. Focus on 4000K, aggressive reaction possible. At the moment, the market is falling as aggressively as it rose. We need to wait for the price to slow down in order to make reasonable technical decisions.
Best regards, R. Linda!

GOLD Daily Plan (Oct 20, 2025) | Buy Setup from 4235–4225 Target🧭 DAILY TRADING PLAN – GOLD (XAU/USD)
Date: Oct 20, 2025
Main timeframe: M30 – H1
Strategy: SMC + Volume Profile + Fibo retracement
1. MARKET CONTEXT
After a sharp drop from 4370 → 4200, price formed a temporary bottom around 4179 and started building a corrective structure.
Currently, price is consolidating between 4240–4260, located near the Value Area Low of the previous session.
On the Volume Profile, the POC (Point of Control) from the prior session is around 4296, aligning with the Fibonacci 0.618 level — this is a major resistance zone and a good target area or reversal point.
2. MAIN SCENARIO (BUY SETUP)
Reason for entry:
Price is reacting from a small demand zone (4235–4225) with increasing volume, showing signs of absorption from buyers.
Trade plan:
Entry: 4235 – 4225
Stop Loss: 4218 (≈6–7 points)
Take Profit 1: 4288
Take Profit 2: 4296 (POC + Fibo 0.618 confluence)
Take Profit 3: 4316 (first supply zone on Chart 1)
Risk-to-Reward Ratio: around 1:2.5 to 1:3
3. ALTERNATIVE SCENARIO (SELL SETUP)
If price fails to hold above 4220 and breaks structure to the downside:
Entry: below 4215 after confirmation (CHoCH / BOS on M15)
Stop Loss: 4222
Take Profit: 4199 → 4179 (previous low & liquidity pool)
4. SUMMARY
→ Focus on the buy setup from 4235–4225 as long as price holds above 4218.
→ Be cautious taking longs near 4296–4316 (supply zone).
→ If bearish momentum returns, switch to the short scenario targeting 4199.

XAUUSD: Bullish Momentum Still Intact After a Healthy PullbackHello everyone, here is my breakdown of the current Gold setup.
Market Analysis
The broader trend for Gold remains strongly bullish, as we can clearly see from the consistent upward channel that has been forming since mid-September. Each corrective phase has been followed by a decisive breakout, confirming buyers’ control and sustaining the uptrend.
Recently, the market broke out from the upper boundary of the range near 4020, establishing a new structural high close to the 4250 resistance zone. However, after reaching this zone, the price entered a correction phase, pulling back to retest the major support zone around 4050–4020 — a level that also aligns with the lower boundary of the ascending channel.
My Scenario & Strategy
At the moment, the price is stabilizing around the support zone, showing early signs of a potential bullish rebound. This zone has acted as a strong demand area throughout the uptrend, and I expect buyers to defend it once again. If the price confirms a bounce from this level, the next logical move would be a continuation towards the 4215 resistance zone, which also aligns with the mid-level of the previous range.
I remain bullish on Gold while the price holds above the 4020 support zone. A successful retest here would provide a good opportunity for long positions targeting 4215 initially. If the price fails to hold above this level, we could see a deeper pullback — but as long as the channel structure remains intact, the broader bias stays positive.
That's the setup I'm tracking. Thank you for your attention, and always manage your risk.

Gold price correction is within expectations, waiting for layout
News:
When it comes to long-term gold trading, attempting to find a "perfect low" is often unrealistic. While Friday's drop of nearly $200 in gold may seem dramatic, it's only half of last week's gains, making the correction still within reasonable bounds. After hitting 4186, prices quickly stabilized and rebounded to 4247, forming a typical bottoming-out pattern. This level is the 0.5 retracement support level of this week's upward trend.
Specifically:
Opportunities often lurk amidst sharp declines. After Friday's pullback to key support, bullish sentiment has stabilized. We maintain a bullish outlook for the start of the week and recommend placing long positions in batches above Friday's low.
Based on recent trends, the market is expected to trade sideways and rise slowly at the beginning of the week, with a focus on the 4220-4210 support zone. If the Asian session can break through and hold the 4275-4285 pressure zone, then you can follow up with long orders in the European and American sessions; if it maintains volatility, then wait patiently for opportunities to accumulate at low levels and stick to the long strategy on pullbacks.
Trading strategy:
Buy: 4225-4220, SL: 4210, TP: 4275-4300

XAU/USD (Gold 4H timeframe)... XAU/USD (Gold 4H timeframe) — here’s what’s visible and how it breaks down technically:
Price: Around 4065 USD currently.
Trendline: A major uptrend line has been broken clearly.
Ichimoku Cloud: Price has fallen below the Kumo, confirming bearish momentum.
Support Zone: Between 4120–4160 USD, already broken and retested.
Measured Move (Target Projection): my chart’s extension line points toward a target around 3840–3860 USD.
📉 Target Breakdown:
Immediate support: 4000 USD (psychological round number).
Main target: 3840 USD (as marked on My chart — aligns with previous structure support).
Extended bearish target: If momentum continues, 3740–3760 USD zone may come next.
⚠ Notes:
If gold reclaims above 4160–4180, bearish bias weakens.
Below 4060 = bears in full control.
Below 4000 = confirmation toward your target zone (≈3840 USD).
✅ Final Target: $3,840 – $3,860 USD
Would you like me to give you stop-loss and re-entry zones too (for sell setup)?

Analysis of gold price trends next weekPolicy aspect: Rate cut expectations become the strongest "ignition point"
The Federal Reserve's interest rate meeting from October 28th to 29th is approaching, and the market's anticipation for easing policies has entered the "window of realization". Several core officials have sent clear signals of rate cuts: Governor Miler directly stated that the current policy is "too tight" and called for a direct 50 basis point rate cut to address economic risks; Governor Bowman, Philadelphia Fed President Polson, and others all support two more rate cuts of 25 basis points each before the end of the year. Under this "dovish consensus", the holding cost of gold as an interest-free asset will further decrease, and its appeal will significantly increase. The September US CPI data (overall year-on-year 3.0%, core year-on-year 3.0%) were both lower than expected, further confirming the easing of inflationary pressure and clearing a key obstacle for rate cuts. The policy support for gold is now very solid.
Trading strategy for gold next week
xauusd @buy4060-4080
TP:4110-4130-4200

XAUUSD: Market Analysis and Strategy for October 22Gold Technical Analysis
Daily Resistance: 4380, Support: 3900
4-Hour Resistance: 4180, Support: 4000
1-Hour Resistance: 4160, Support: 4000
Technically, gold fell by $380, temporarily halting its decline near 4000. Technical indicators are recovering, and the market is taking a brief breather. Bull markets are prone to large swings, so it's unclear whether gold has truly reversed in the short term.
Gold has tested the 4000 support level twice. Watch for the continuation of the short-term downtrend. The moving average price has broken through the upward trend line in the short term, and the indicators are in a state of recovery, but the Bollinger Bands remain upward. The 4170/4180 levels on the daily chart are key. If they are successfully recaptured, the market is poised for a strong bullish resurgence. Otherwise, the market will continue to fluctuate downwards in the short term, looking for support. Focus on the 4000 level. If it breaks below, it will continue to move towards 3900.
Looking at the 1-hour chart, the candlestick pattern has broken below the neckline of the M-shaped top. Market bearish sentiment is being released, and indicators continue to move downward rapidly. The short-term bull-bear dividing line is between 4188 and 4208. Short-term rebound momentum is limited, and the NY market remains bearish.
Trading Strategy:
BUY: 4000-4005near
SELL: 4160near
SELL: 4178near
More Shares →
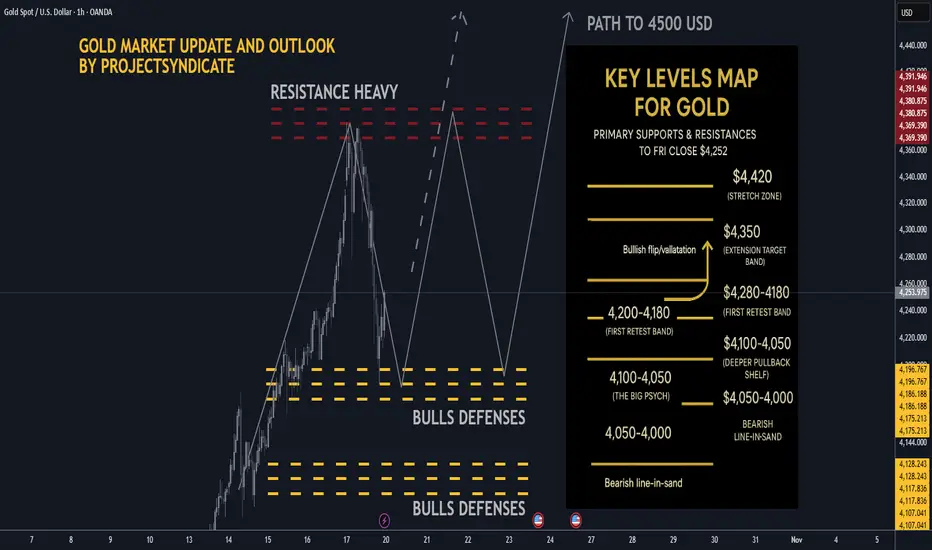
Gold next week: Key S/R Levels and Outlook for Traders🔥 GOLD WEEKLY SNAPSHOT — BY PROJECTSYNDICATE
🏆 High/Close: $4,379 → ~$4,252 — higher close vs. last week’s pullback finish.
📈 Trend: Uptrend intact > $4,000; dip buyers continue to control rhythm.
🛡 Supports: $4,180–$4,140 → $4,100–$4,050 → $4,000 must hold.
🚧 Resistances: $4,260 / $4,300 / $4,350 → stretch $4,380–$4,420.
🧭 Bias next week: Buy-the-dip > $4,140–$4,200; momentum regain targets $4,300–$4,380+. Invalidation < $4,050 → risk $4,000/3,980.
🌍 Macro tailwinds:
• Fed: Markets lean to another cut into Oct 28–29; softer real yields buoy gold.
• FX: DXY under pressure = constructive backdrop.
• Flows: ETF interest & CB buying remain supportive on dips.
• Geopolitics: Tariff/trade and regional risks keep safe-haven bids live.
🎯 Street view: Several houses float $5,000/oz by 2026 scenarios on easing policy & reserve diversification narratives
________________________________________
🔝 Key Resistance Zones
• $4,260–$4,280 near-ATH supply / immediate ceiling from close
• $4,300–$4,350 extension target band
• $4,380–$4,420 stretch zone toward prior spike high and measured extensions
🛡 Support Zones
• $4,220–$4,200 first retest band just below close
• $4,180–$4,140
• $4,100–$4,050 deeper pullback shelf; $4,000 remains the big psych
________________________________________
⚖️ Base Case Scenario
Expect shallow pullbacks into $4,220–$4,140 to be bought, followed by rotation back into the $4,260–$4,300 resistance stack for an ATH retest.
🚀 Breakout Trigger
A sustained push/acceptance > ~$4,280 unlocks $4,300 → $4,350, with room toward $4,380–$4,420 if momentum persists.
💡 Market Drivers
• Fed cut expectations into late Oct(lower real yields = gold tailwind
• USD softness / DXY sub-100 tone supports metals
• Ongoing central-bank bullion demand; ETF inflows stabilizing
• Geopolitics & trade/tariff headlines keeping safety bids active
🔓 Bull / Bear Trigger Lines
• Bullish above: $4,140–$4,200
• Bearish below: $4,100–$4,050 risk expands under $4,000
🧭 Strategy
Accumulate dips above $4,140–$4,200.
On breakout > $4,280, target $4,300–$4,350+. Maintain tight risk under stepped supports; invalidate momentum below $4,050–$4,000.
________________________________________
GOLD XAUUSD GOLD ,THE CURRENT 45MIN is attempting to buy after disappointing united state data report.
US Core CPI (Month-over-Month)
Actual: 0.2%
Forecast: 0.3%
Previous: 0.3%
Core CPI, which excludes volatile food and energy prices, came in slightly below expectations and the previous month’s reading, indicating a modest easing in underlying inflation pressures.
US CPI (Month-over-Month)
Actual: 0.3%
Forecast: 0.4%
Previous: 0.4%
Headline CPI also showed a slightly smaller increase than forecast, suggesting overall inflation may be cooling somewhat on a month-to-month basis.
US CPI (Year-over-Year)
Actual: 3.0%
Forecast: 3.1%
Previous: 2.9%
Year-on-year CPI increased at 3.0%, slightly below forecasts but still above the prior month, indicating inflation remains elevated but relatively stable.
US Flash Manufacturing PMI
Actual: 51.9
Forecast: 52.0
Manufacturing activity remains in expansionary territory (above 50) but slightly weaker than expected, suggesting a modest slowdown in manufacturing growth.
US Flash Services PMI
Actual: 53.5
Forecast: 54.2
Services sector also continues growing but at a slower pace than forecast, indicating some softening in service industry expansion.
Summary
Inflation data show signs of mild moderation but remain above target levels, which may influence Federal Reserve policy decisions.
Manufacturing and services PMIs indicate growth but at a modestly slowed pace, reflecting cautious economic momentum.
This mixed data set suggests persistent but gradually easing inflation with a steady, moderate expansion in economic activity.

Gold is still in a downward channel
News:
On Wednesday (October 22nd), spot gold trading saw increased volatility, trading above $4,000 before the US market opened. Previously, the price of gold retreated rapidly from its stage high: it once reached $4,161 in the European session and then came under pressure again; in sharp contrast to the previous stage peak of $4,380, the retreat was significant, and the market became increasingly sensitive to the offensive and defensive switches of the "four thousand mark".
Overall, the market is in a data vacuum. Affected by the government shutdown, the economic schedule on Wednesday was empty, with only a small number of Treasury auctions and repurchase operations supporting liquidity. However, global macro events have quietly amplified the cross-market linkage effect.
Specifically:
Judging from the 4-hour market trend, the current focus is on the short-term suppression of 4090-4080 on the top, and the short-term support of 4000 on the bottom. If the bulls cannot break through, gold will continue to maintain a downward trend. The operation should be mainly high-altitude, and wait patiently for key points to enter the market. I will remind you of the specific operation strategy in the channel, so please pay attention to it in time.
Trading strategy:
Buy: 4090-4080, SL: 4105, TP: 3990-3965

Elliott Wave Analysis – XAUUSD (October 24, 2025)
1️⃣ Momentum
D1 Timeframe:
• D1 momentum is closing within the oversold zone → bearish strength has clearly weakened.
• The probability of a bullish reversal is now very high.
• A strong bullish D1 candle close is needed to confirm the reversal.
• Once confirmed, price may enter a 5-day bullish rally.
H4 Timeframe:
• H4 momentum is still declining.
• If the current H4 candle closes as it is now, we may see a main bearish move today (around 5 H4 candles).
• Since today is Friday, a deeper decline remains possible.
→ Therefore, careful observation and analysis are required before entering any trades.
H1 Timeframe:
• H1 momentum continues to decline.
• Price may drop toward the 4098 liquidity zone.
• If this level breaks, the next potential target is 4050.
________________________________________
2️⃣ Wave Structure
D1 Structure:
• Price has been moving sideways for several days.
• In Elliott Wave theory, when price reaches its target, it often needs time symmetry before the wave completes.
• Therefore, this prolonged sideways phase helps maintain time balance.
• It’s still too early to confirm whether this is yellow Wave 4 or just Wave 4 within yellow Wave 3.
H4 Structure:
• There are two possible scenarios:
1. The blue Y wave is still unfolding.
2. The purple Wave 5 has already started forming.
• To determine which scenario is valid, we monitor the current
H4 bearish phase:
o If price does not break the previous low, and H4 momentum enters the oversold zone, it likely indicates purple Wave 5 has begun, with an upside target near 4476.
o If price breaks the previous low, the blue Y corrective wave is still in progress, or a larger corrective structure is unfolding.
o In that case, we’ll watch the lower liquidity zones, with the ideal completion target for Wave Y around 3927.
H1 Structure:
• On the H1 chart, Wave C appears to have completed in the form of an Ending Triangle.
• According to Elliott theory, after an ending triangle, price should drop sharply and quickly.
• However, such a strong drop hasn’t appeared yet, so we continue to observe the price action carefully.
There are two main scenarios to consider:
1. If price declines slowly toward the 4050 liquidity zone, showing overlapping waves while H4 momentum moves into the oversold region, it’s likely that Wave 5 has already started.
→ In this case, we’ll look for buying opportunities.
2. If price falls rapidly and steeply, it suggests that the blue Y wave is still unfolding, or that the market is inside a larger corrective phase.
→ In this case, price may break below 4004, and we will patiently wait for buy setups around 3953 or 3927.
________________________________________
3️⃣ Trading Plan
• Sell Setup:
o Yesterday’s sell zone at 4149 has already reached about +400 pips.
o No new ideal sell zone for now → wait for liquidity breaks to look for the next sell setup.
• Buy Setup:
o Monitor potential buy reactions at:
4050
3953
3927
⚠️ Note:
Price is currently at a sensitive zone, with each candle showing a range over 200 pips.
→ Therefore, limit orders are highly risky at the moment and could easily get stopped out.
