Report 26/11/25Report Summary
Kyiv has told Washington it is prepared to sign a U.S.-drafted framework to end the war, a plan that, crucially, was informed by consultations with the Kremlin. The Wall Street Journal reports the draft came from the Trump administration’s special envoy and that Moscow’s input shaped key sections; the White House sees it as the fastest path to halt fighting and unlock reconstruction finance. Ukraine’s signal of receptivity is the first clear public step toward a negotiated endgame in many months.
Independent reporting indicates the U.S. draft is broadly consistent with a stream of “peace principles” circulated to allies this month; terms range from cease-fire and demilitarized zones to security guarantees and phased sanctions relief tied to compliance. Reuters confirms a U.S.-backed proposal is in play and being briefed in allied capitals. Markets responded with a familiar “risk-on in cyclicals / risk-off in defense & energy beta” intraday pattern, while the Journal’s markets desk flagged choppy equity trade into the U.S. holiday week as investors weighed the peace headlines against a heavy AI earnings calendar and delayed labor data.
A parallel European track matters for financing: Brussels is pushing ahead with an EU plan to mobilize the windfall profits from frozen Russian assets into a large loan program for Kyiv, despite U.S. proposals that would channel more of those assets into American-led investment vehicles. If EU leaders sign off, that structure would provide multi-year disbursements and legal cover for European banks to participate. Together, the diplomatic movement and funding design shift the distribution of macro risks away from a prolonged attrition war toward a negotiated freeze with staged sanctions relief, still highly uncertain, but credible enough for markets to begin repricing tail risks.
Macro context you should factor in now
Europe’s growth engine is sputtering. In a notably blunt speech, ECB President Christine Lagarde warned the bloc’s “old” export-heavy model has become a vulnerability, urging policymakers to remove internal market barriers and strengthen domestic demand; she underscored that six years of inaction would lock in a lower growth path. That stance implies a bias to keep rates on hold and to lean on structural policy rather than monetary easing to revive growth. At the same time, Vanguard cautions that markets are pricing too many Fed cuts for 2026–27 given the ongoing AI-capex boom that is supporting U.S. growth and may limit how far policy can ease without reigniting inflation.
In Asia, Japan’s new prime minister Sanae Takaiichi has unveiled a ¥21.3tn (≈$135bn) package, Japan’s largest since the pandemic, mixing household subsidies with tax cuts. The fiscal impulse has pushed JGB yields to multi-decade highs and kept the yen under pressure, even as foreign investors stepped in to buy long-dated paper at the fastest pace in more than two decades. Expect the MoF/BoJ to keep FX-intervention optionality alive if volatility spikes.
Finally, Western capitals are coordinating a response to Chinese steel overcapacity, an OECD-anchored process that could harden into tariff-quota regimes in 2026. That’s a medium-term positive for EU/U.S. steel margins, but it’s also another wedge in the global goods dis-inflation story and one more lever on bilateral frictions.
Market reactions and positioning (near-term, then 3–12 months)
S&P 500 / Dow Jones. Equity indices traded choppy but resilient as investors rotated within cyclicals: a cease-fire path reduces left-tail risks on energy costs and European growth, while AI capex continues to anchor U.S. earnings visibility. Into year-end, breadth should improve if peace odds rise and if bond volatility eases alongside Japan’s policy clarity. Base case: mild multiple support and “quality-cyclical” leadership (industrials, select financials) over pure defensives. Risk case: talks stall and oil spikes; or U.S. data re-accelerate too much, forcing repricing of Fed cuts.
DXY / USDJPY. The peace track is modestly dollar-negative through the energy channel and European risk premium, but Japan’s outsized fiscal push and high JGB term premia are yen-negative. Netting those, USDJPY likely remains bid on rallies unless BoJ signals faster balance-sheet adjustments or MoF intervenes. Watch the 150–158 corridor as intervention-risk territory.
XAUUSD (Gold). A credible cease-fire path trims the geopolitical bid for gold at the margin; however, if markets scale back the number of Fed cuts after strong AI-led capex, real yields could firm and further cap upside. Conversely, any breakdown in talks or an escalation around sanctions-for-compliance would quickly restore safe-haven demand. Net: tactically neutral/slightly lower with strong dip buying below key moving averages.
Crude oil. Risk premium eases on peace momentum and EU financing clarity. Brent’s downside is cushioned by OPEC+ discipline and low OECD commercial stocks, but the path of least resistance is lower volatility and a gradual grind toward the marginal-cost band if a freeze holds. Keep an eye on any carve-outs in the U.S. plan that adjust Russian export constraints; these would feed directly into term structure.
European equities / banks. A peace pathway and EU loan architecture are constructive for battered EU cyclicals and select banks via lower energy costs, better NPL outlooks in CEE exposures, and potential steepening if fiscal overhangs are credibly financed. The counterweight is Lagarde’s “new model” push, which accepts slower trade-led growth—so stock selection will matter.
Forecasts
In the next 1–3 months, the negotiation calendar itself will drive variance. Expect alternating bursts of optimism and risk-off: drafts circulated to allies, leak-driven disputes over security guarantees, and EU legal work on the asset-profits loan will each move cross-assets. Base case (55%): a de-facto truce framework emerges with monitoring and staged sanctions relief linked to compliance; energy vol compresses; European PMI troughs look durable. Bear case (30%): talks stall on territory/sequencing; sanctions tighten; commodity vol revives. Bull case (15%): cease-fire plus rapid reconstruction commitments pull forward capex and Europe outperforms.
On a 6–12 month horizon, the contours of post-war financing matter most. If the EU loan goes ahead, with windfall-profit capture from immobilized assets, it creates a predictable disbursement channel that encourages private lenders to re-enter Ukrainian infrastructure and housing with multilateral guarantees—a modest positive impulse for European capital-goods and specialty materials. U.S. domestic politics will determine whether Washington emphasizes sanctions relaxation for compliance (market-friendly) or leans on secondary sanctions to enforce terms (dollar-positive, EM risk-negative).
Fiscal and political implications
For Europe, Lagarde’s call to dismantle internal market barriers and double-down on domestic strengths signals less willingness to “buy growth” with rate cuts and more pressure on capitals to pursue supply-side reforms. That stance, combined with a Ukraine-funding mechanism housed in EU law, should keep periphery spreads contained so long as growth doesn’t undershoot.
For the U.S., an endgame that pares back energy volatility and reduces headline inflation noise helps the Fed achieve disinflation without over-easing. Vanguard’s warning on “too many cuts priced” suggests a risk that the policy path stays firmer for longer if AI-capex remains torrid, supportive of the dollar versus low-yielders, but not versus a reforming Europe if energy risk fades.
For Japan, the stimulus-driven rise in yields, paired with foreign demand for duration, underscores a regime change away from yield-curve-control: global term premia will take their cue from JGBs as much as from U.S. Treasurys on big days. FX-intervention risk rises with each new fiscal headline if USDJPY surges into the high-150s.
Key risks to monitor
First, talks unravel: if territorial language or sequencing of sanctions relief becomes a deal-breaker, oil and gold spike, the dollar catches a safety bid, and European equities underperform again. Second, EU legal friction: if member-state courts or the ECB contest the asset-profits loan structure, Ukraine financing could slip, risking a cohesion shock. Third, policy mistake in Japan: an overly large supplementary budget or clumsy signaling could disorder the JGB market and spill into global rates, pressuring long-duration equity multiples. Fourth, trade flare-ups: coordinated steel defenses in 2026 would be inflation-neutral to slightly positive and geopolitically sensitive if China retaliates.
Actionable takeaways by asset
XAUUSD: Fade spikes on positive-headline days; keep a core tail-risk hedge given non-trivial negotiation failure risk. Correlation to real yields likely reasserts if peace odds rise.
S&P 500 / Dow: Favor quality cyclicals (industrials, rails, select banks with EU/CEE exposure) and capex beneficiaries; underweight pure energy beta until the talks path is clearer.
USDJPY / DXY: Maintain a buy-the-dip bias in USDJPY with tight risk controls around known MoF-watch levels; DXY path modestly lower if Europe’s energy risk premium collapses, but resilient versus JPY.
Crude: Expect lower vol and mild contango if cease-fire contours harden; hedge upside tails via call spreads into each major negotiating round.
European equities: If EU financing clears and peace momentum holds, rotate toward European capital-goods, building materials, and quality small/mid financials; avoid names most levered to wartime energy spreads.
Trade ideas

Gold 30-Min — Volume Sell Reversal Triggered⚡Base : Hanzo Trading Alpha Algorithm
The algorithm calculates volatility displacement vs liquidity recovery, identifying where probability meets imbalance.
It trades only where precision, volume, and manipulation intersect —only logic.
✈️ Technical Reasons
/ Direction — SHORT / Reversal 4134 Area
☄️Bearish rejection confirmed through sharp candle body.
☄️Lower-high forming beneath resistance supply region.
☄️Volume decreasing confirms exhaustion in price rally.
☄️Sellers regained imbalance with heavy top rejection.
☄️Algorithm detects fading demand and shift to control.
⚙️ Hanzo Alpha Trading Protocol
The Alpha Candle defines the day’s real control zone — the first battle of momentum.
From this origin, the Volume Window reveals where the next precision strike begins.
⚙️ Hanzo Volume Window / Map
Window tracked from 10:30 — mapping true market behavior.
POC alignment exposes institutional bias and breakout potential zones.
⚙️ Hanzo Delta Window / Pulse
Delta window monitors real buying vs. selling power behind each move.
Tracks volume aggression to expose who controls the candle — buyers or sellers.
When Delta aligns with Volume Map, momentum becomes undeniable.

Im selling gold CFDs#GOLD downfall starts very soon.
Becareful buying at the top range, we are lokely to visit 3,700.00$ hashtag#XAU
Downchannel formed around 4 Hours time frame plus symetrical triangle im very bearish now.

DeGRAM | GOLD will rise to the $4200 level📊 Technical Analysis
● XAU/USD is breaking above the descending resistance line after multiple rejections inside the 4,125–4,155 resistance area, signalling strengthening bullish momentum.
● Price is forming higher lows above 4,099 support and is now aiming toward the upper resistance zone near 4,211–4,243 as long as the breakout holds.
💡 Fundamental Analysis
● Gold gains support from softer U.S. yields and renewed expectations of earlier Fed easing, while geopolitical tensions continue to lift safe-haven demand.
✨ Summary
● Bullish bias above 4,099. Targets: 4,155 → 4,211 → 4,243. Resistance area: 4,125–4,155.
-------------------
Share your opinion in the comments and support the idea with a like. Thanks for your support!

GOLD market after “Fed fever”, growth momentum is challengedOANDA:XAUUSD prices remain in the spotlight as the market has been experiencing a series of strong fluctuations following mixed signals from the Federal Reserve and labor data. However, developments show that the risk of price declines is increasing as the precious metal has repeatedly failed in its efforts to hold the $4,100/ounce area, the first resistance level of this year's hot period.
For most of 2025, gold has risen more than 55%, despite high bond yields and a strong dollar. But as the Fed’s final policy meeting approaches and the market lacks consensus on the path of interest rate cuts, the traditional correlation between gold, interest rates, and the dollar is returning. According to CME’s FedWatch, the market still expects a more than 70% chance of the Fed cutting interest rates next month, while economists maintain a more cautious assessment of only about 50/50.
This puts the upcoming economic data in a decisive position for both market expectations and gold’s stability in this trading week.
Fed’s Dovish Return: A Direct Impact on Gold’s Upward Momentum OANDA:XAUUSD
Gold settled in the first half of the week as demand for havens increased, while the ADP report showed that the private sector cut an average of 2,500 jobs per week in the four weeks to November 1.
The 4,000 USD/ounce level continues to be the key threshold determining the short-term trend, as the market is moving within a correction zone but has not yet broken the medium-term bullish structure.
Technical analysis and suggestions OANDA:XAUUSD
1. Price Structure & Overall Trend
• Price is still within the ascending channel that has extended since August, although the range has narrowed compared to October. The October peak around 4,128 USD acts as a major medium-term resistance.
• The current decline is still only a pullback within the uptrend, as long as price holds above 3,972 USD (Fib 0.382) and especially the 4,000 USD psychological & technical support.
2. Key Technical Zones
• Nearest resistance: 4,128 – 4,216 USD
(A strong resistance cluster where price has been repeatedly rejected in November.)
• Nearest support: 4,055 – 4,000 USD
(This zone aligns with Fib 0.382 and the short-term bottom.)
• Deeper supports:
3,846 USD (Fib 0.5) – Important for a deep pullback scenario
3,720 USD (Fib 0.618) – Reaction support in case of strong macro volatility
3. Price Momentum – RSI
• RSI has moved out of oversold territory but remains weak and has not re-established a bullish structure.
• The RSI-MA21 is flat → the market lacks strong momentum; sideways movement or a retest of the 4,000 USD zone is highly likely.
4. Short-Term Outlook (Next Week)
• Market bias: Neutral to slightly bearish, but the medium-term uptrend remains intact.
• Price is likely to retest 4,000 USD, then form one of two scenarios:
o Hold 4,000 → rebound to 4,128 – 4,216 USD
o Break 4,000 → drop to 3,972 – 3,846 USD
👉 Conclusion: 4,000 USD is the decisive level for the short-term trend.
BUY XAUUSD PRICE 4102 - 4100⚡️
↠↠ Stop Loss 4106
→Take Profit 1 4094
↨
→Take Profit 2 4088
SELL XAUUSD PRICE 4016 - 4018⚡️
↠↠ Stop Loss 4012
→Take Profit 1 4024
↨
→Take Profit 2 4030

Gold Market Outlook: Key Levels & US Economic Events | Nov 24–28In this video, I share my personal take on the gold market.
Watch to gain:
✅Clarity on potential gold price moves for the coming week
✅Highlighting key levels to watch
✅Perspective on market sentiment amid consolidation and trendline activity
✅Understanding of how U.S. economic events like the PPI and Retail Sales could influence gold
✅Actionable context for observing price behaviour and making informed decisions
Check the comment section throughout the week for real-time updates as I monitor price action.

Structure Turns Bullish, Yet Volatility Warns of Traps1. Recap of Yesterday’s Outlook
In yesterday’s analysis, I said very clearly:
➡️ “As long as 4100 resistance is intact, the structure remains bearish.”
And indeed, I followed that bias — I sold the rally around 4075, the trade moved 150 pips in my favor, but without follow-through.
I closed it with an insignificant 30-pip profit, a good decision considering that holding it would’ve led straight into a stop-loss hit.
Price action justified the caution.
2. Has the Structure Shifted?
The key question today:
➡️ Has the market turned bullish?
So far, yes — technically, the structure has shifted.
Why?
- The 4100 resistance was broken strongly, with conviction.
- The breakout wasn’t just a wick; it held.
- Momentum flipped short-term direction
Under normal conditions, this would imply:
➡️ Upside continuation toward 4200.
And the logic is simple:
- What was resistance becomes support.
- So the 4100–4080 zone is now the bullish line in the sand.
3. But This Is Gold These Days… Volatile & Erratic
The problem is not the technicals — the problem is behavior.
Gold recently has been:
- Hysterical in volatility,
- Featuring massive fakeouts,
- Delivering 700–1500 pip swings within hours,
This makes the breakout valid, but not necessarily trustworthy without confirmation.
And here’s the key:
➡️ If Gold drops back under 4080, the structure instantly turns bearish again.
This is why blindly buying the breakout is dangerous.
Patience and confirmation matter more than ever.
4. Technical Outlook – Levels That Matter
Bullish structure (for now):
- 4100–4080 is support
- Above this zone → bullish
- Target → 4200
Bearish trigger:
- Break back below 4080 → failed breakout
- Structure returns bearish
- Possible revisit of 4000, then 3900
Bigger picture:
Gold is still contained in a large triangle formation since the all-time high.
Breakouts inside a triangle are often traps until the triangle itself resolves.
That’s why flexibility is essential.
5. Trading Plan – Short-Term, Flexible, and Level-Based
Because Gold is in a triangle and volatility is intense:
- Trade short-term, not swing positions.
- Look to buy dips into 4100–4080, but only with clear reversal signs.
- Don’t hold bias stubbornly — adapt candle by candle.
Clear plan:
Bullish scenario:
- Buy dips around 4100- 4110 only if reversal signs appear
- Target 4200
Bearish scenario:
- If price falls back below 4080, forget the breakout —
bearish again
- Potential drop toward 4000, then lower
This is one of those moments where discipline beats prediction.
6. Conclusion – Bullish, but With an Asterisk
In summary:
- The breakout above 4100 is real → bullish bias active
- Target: 4200
- BUT the structure remains fragile due to recent volatility
- Below 4080 = bearish again
- Triangle structure adds uncertainty
- Short-term trading and flexibility are essential these days
The trend says bullish, the behavior says be careful.

What are your thoughts on GOLD?Hello Traders! 👋
Currently, GOLD has reached the upper resistance of the range and is showing signs of weakening — forming lower highs, suggesting buyers are losing strength and selling pressure may return.
🔍 Key Technical Highlights
Price reacted strongly at the 4120–4140 resistance zone.
Emerging pattern of lower highs, signaling bearish pressure.
Main support to watch: 4040–4060.
Short-term trend: bearish correction within the range.
Medium-term trend: neutral / sideways.
Current Expectation
If GOLD continues to fail at the 4140 zone, it’s likely that price will:
👉 Decline back toward 4060,
and potentially further to 4040, the bottom of the range.
📌 Trade Signal (Technical Setup)
Sell Setup:
Sell zone: 4120–4140
Stop Loss: above 4160
Take Profit 1: 4080
Take Profit 2: 4060
Take Profit 3 (extended target): 4040
Conclusion
GOLD remains in consolidation. Price is now at a key resistance zone and showing signs of exhaustion, so selling from 4120–4140 remains the preferred strategy. The overall structure is still sideways until the market breaks above 4140 or below 4040 with conviction.
Don’t forget to like and share your thoughts in the comments! ❤️

Gold next move (NFP TRADE PLAN)(20-11-2025)Go through the analysis carefully, and do trade accordingly.
Anup 'BIAS for the day (20-11-2025)
Current price- 4080
1st scenario (high probability)
4020-4030 area for buying for target 4050,4100,4150,4250
1st scenario (moderate probability)
4120-25 area for selling for target 4100,4090,4080,4050.
Best of luck
Never risk more than 1% of principal to follow any position.
Support us by liking and sharing the post.

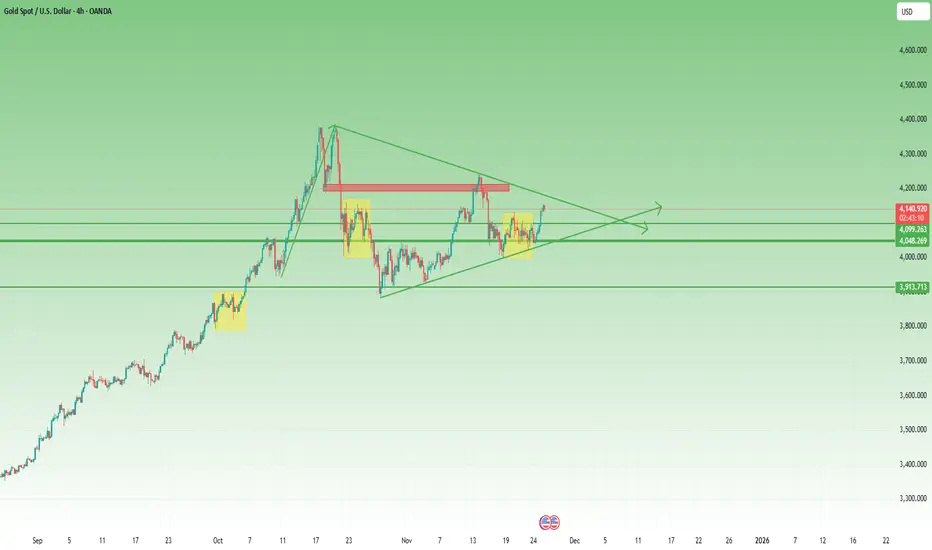
XAU/USD ANALYSIS 27-11-2025:Gold (XAU/USD) attracted some selling during Thursday's Asian session and erased some of the previous day's gains to hit its highest in nearly two weeks.
The prospect of lower US interest rates, along with hopes of a peace deal between Russia and Ukraine, has continued to support bullish market sentiment. This, in turn, is believed to have prompted some outflows from safe-haven bullion amid relatively low trading volumes following the US Thanksgiving holiday.
The chart is showing:
Price is inside a triangle compression with 2 converging trendlines.
Current price zone is right next to the upper downtrend line → short-term selling pressure is still present.
The area you marked Weak High shows that the most recent peak is not strong enough to confirm a new uptrend.
Resistance zone above the current price
Located around 4,165 – 4,185
→ This is the area with seller liquidity + the point of touching the downtrend line.
→ There will likely be a strong reaction if the price retests.
Nearest support zone
Smaller yellow zone: 4,130 – 4,140
Larger green zone: 4,095 – 4,110
Strong Low below 4,050 → final support.
If the price breaks 4,130, it will likely go straight to the green zone of 4,095 - 4,110.
Gold Trading Plan on November 27.
👉 Watch to BUY Gold 4123- 4128 SL 4120, TP 4148 - 4163 - Hold 4200.
👉 Watch to SELL Gold 4180- 4188, SL 4193, TP 4152 - 4130 - Open.

US MARKETS CLOSED TODAY - THANKSGIVING🚨 US MARKETS CLOSED TODAY - THANKSGIVING 🦃
Current Price: $4,150 - $4,156 📊
Yesterday's Close: $4,130
Monthly Performance: +3.94% ✅
Yearly Performance: +57.69% 🔥
Status: 🟡 HOLIDAY - THIN TRADING
🎉 MAJOR BULLISH NEWS! DEUTSCHE BANK UPGRADES FORECAST! 📈
BREAKING: Deutsche Bank raised its 2026 gold price forecast to $4,450/oz from $4,000, citing stabilizing investor flows and persistent central bank demand. The bank now expects a $3,950-$4,950 range next year
This is HUGE news for gold bulls! Major institution showing strong confidence in gold's future!
📊 IMPORTANT: TODAY'S MARKET CONDITIONS
🦃 Thanksgiving Holiday Schedule:
Gold will NOT be traded on November 27, 2025 due to U.S. Thanksgiving holiday
What This Means:
❌ US markets CLOSED all day
⚠️ Very thin liquidity globally
⚠️ Wide spreads expected
⚠️ Price gaps possible
✅ Good time to review positions
Friday (Nov 28):
Markets open but shortened hours
Very low volume expected (Black Friday)
Many traders still on holiday
💎 DEUTSCHE BANK FORECAST DETAILS
The Upgrade:
Deutsche Bank's new average forecast for 2026 stands at $4,450/oz, up from previous $4,000/oz. Bank anticipates gold to trade within range of $3,950 to $4,950 per ounce in 2026, with possible high near $4,950/oz - approximately 14% above current December 2026 futures prices
Why They're Bullish:
Key drivers: resilient investor demand, strong central-bank buying, limited supply response. Third-quarter supply-demand data supports continued central bank bid, with inelastic demand from central banks and ETF investment diverting supply from jewelry market. Overall growth in demand outpaces supply
Gold's unusually wide trading range in 2025—the largest since 1980—underpins constructive outlook for 2026
📈 CURRENT TECHNICAL ANALYSIS
Market Structure: BULLISH CONSOLIDATION 🟢
Gold trading near two-week highs above $4,170 after recent rally. Consolidating gains before next move.
Key Development:
Gold shrugging off Tuesday's small dip and pushing to multi-day highs above $4,170 per troy ounce. Move higher comes as US Dollar loses steam, even though US Treasury yields trying to rebound
Support Levels 🔵
Support 1: $4,130 - $4,140 (Yesterday's close - Immediate)
Support 2: $4,059 - $4,100 (Strong zone)
Support 3: $3,977 (55-day SMA)
Support 4: $3,886 (October 28 low)
Support 5: $3,750 (50% Fib retracement)
Resistance Levels 🔴
Resistance 1: $4,170 - $4,173 (Current highs)
Resistance 2: $4,245 (November 13 peak)
Resistance 3: $4,254 - $4,280 (Major barrier)
Resistance 4: $4,380 - $4,381 (All-time high - October 17)
📊 TECHNICAL INDICATORS
RSI: Heading toward 60 (Bullish momentum building) 🟢
ADX: Holding above 19 (Trend slowly gaining strength) ✅
Moving Averages: All pointing UP - Bullish alignment ✅
For now, momentum still leans bullish: Relative Strength Index heading toward 60, and with Average Directional Index holding above 19, underlying trend looks like it's slowly gaining strength
🎯 TRADING STRATEGY FOR THANKSGIVING WEEK
TODAY (Wednesday - Thanksgiving):
⚠️ DO NOT TRADE!
Reasons:
Markets closed
Zero liquidity
No meaningful price discovery
High risk of gaps
Best Action:
Review your positions
Plan for Friday/next week
Take the day off!
FRIDAY (Black Friday - Nov 28):
Trade with EXTREME Caution!
On November 28, XAUUSD may continue to rise, but price reversal still possible. Key support and resistance levels expected at $4,059.90 and $4,254.97
Strategy:
Wait for normal hours to resume
Use smaller position sizes
Expect wider spreads
Watch for gaps from Thursday close
NEXT WEEK (December Trading):
Back to Normal - Key Levels:
BULLISH Scenario (65%):
IF holds above $4,130-$4,140
Target: $4,245 → $4,280 → $4,380
Entry: Pullback to $4,140-$4,150
BEARISH Scenario (35%):
IF breaks below $4,100
Target: $4,060 → $3,977
Entry: Break and retest of $4,100
🌍 FUNDAMENTAL OUTLOOK
BULLISH FACTORS ⬆️⬆️⬆️
✅ Deutsche Bank Upgrade - Major vote of confidence!
✅ Analysts predict gold may reach $4,456-$4,509 by end of November
✅ Central banks purchased 634 tonnes YTD, WGC expects 750-900 tonnes for 2025
✅ Fed Rate Cut Expected - December odds rising
✅ Dollar Weakness - DXY losing momentum
✅ Demand > Supply - Structural bull market
✅ ETF Inflows - First net buying in 4 years
✅ Geopolitical Tensions - Safe-haven support
Key Quote:
Central banks planning record high gold allocations. Gold positioned as "ultimate protection against black swan tail risk events." ETFs returned to net accumulation in 2025 after four years of outflows
Risk Factors ⬇️
⚠️ Profit Taking - After 57% yearly gain
⚠️ Technical Overbought - Short-term
⚠️ Holiday Volatility - Thin markets
⚠️ Strong US Data - Could delay Fed cuts
💡 WEEK RECAP & OUTLOOK
This Week's Performance:
Current XAU/USD exchange rate: $4,155.98. Over past year, XAU/USD changed by 57.69%, trading within 52-week range of $2,583.49 to $4,381.60
Gold rose to $4,138.45 on November 25, up 0.07% from previous day. Over past month, gold's price risen 3.94%, up 57.22% compared to same time last year
November Performance:
✅ Recovered from $3,886 low
✅ Now at $4,150+ (Multi-week highs)
✅ +3.94% for the month
✅ On track for analysts' $4,456-$4,509 target
🔮 FORECAST & TARGETS
End of November (3 Days):
Expected: $4,200-$4,300 range
Target hit probability: 70%
December 2025:
Range: $4,150-$4,400
Target: Retest all-time high $4,381
2026 Targets (Deutsche Bank):
Average: $4,450/oz
Range: $3,950-$4,950
Potential High: $4,950 (+19% from current)
Long-term (Other Analysts):
Some forecasts: $5,000+ by late 2026
Ultra-bullish: $6,000+ by 2027-2028
🏆 PROFESSIONAL ANALYSIS SUMMARY
Gold is in a STRONG POSITION entering the holiday period. The Deutsche Bank upgrade is a major institutional endorsement of the bull market.
The Big Picture:
Technical: Bullish trend intact, consolidating at highs
Fundamental: Demand > Supply, Central bank buying strong
Sentiment: Major banks turning more bullish
Positioning: Healthy after recent consolidation
Key Insight:
Gold's upward trajectory is structurally supported rather than merely cyclical
This means the rally has LEGS - it's not just speculation, it's backed by real supply/demand fundamentals!
💪 TRADING PSYCHOLOGY - HOLIDAY EDITION
Take a Break!
Markets are closed, you should be too! Use today to:
Spend time with family 🦃
Review your trading journal
Plan for December
Recharge your mental energy
Remember: The best trade is sometimes NO trade!
🎯 POST-HOLIDAY TRADING PLAN
Friday (Nov 28):
⚠️ Avoid trading (thin liquidity)
Watch for any gaps
Let market settle
Monday (Dec 2):
Resume normal trading
Watch $4,140 support
Target $4,245 if bullish
Key Levels to Watch:
Above $4,170: Bullish → Target $4,245+
Below $4,130: Caution → Support at $4,100
📊 SUPPORT/RESISTANCE SUMMARY
Critical Support: $4,130-$4,140
Strong Support: $4,100, $3,977
Weak Resistance: $4,170, $4,200
Strong Resistance: $4,245, $4,280, $4,380
Breakout Level: $4,245 (Opens $4,380 retest)
Breakdown Level: $4,100 (Triggers correction)
🔔 THANKSGIVING MESSAGE
Happy Thanksgiving! 🦃
Whether you're trading gold or not, take time today to be grateful. The markets will be here tomorrow, next week, and next year. But today is for family, friends, and reflection.
Three Things to Be Grateful For in Trading:
Opportunity - Markets give us chances every day
Learning - Every trade teaches us something
Community - We're all in this together!
Enjoy your day! 🙏
⚠️ FINAL REMINDERS
For Today:
Markets CLOSED ❌
No trading possible
Relax and recharge 🦃
For Friday:
Shortened hours
Very low volume
Trade with extreme caution
Smaller positions
For Next Week:
U.S. third-quarter GDP data may influence gold prices
Back to normal volume
December rate decision approaching
Year-end positioning begins
📈 YEAR-END OUTLOOK
December Catalysts:
Fed rate decision (Dec 17-18)
Year-end positioning
Q4 GDP data
Holiday season (thin trading Dec 24-Jan 1)
2026 Setup:
With Deutsche Bank's $4,450 target and bullish structure, gold entering 2026 with strong momentum!
🦃 Happy Thanksgiving from the Trading Desk!
📱 Enjoy the holiday - markets resume Friday
💎 Stay blessed and grateful
🙏 See you next week for December trading!
#Gold #XAUUSD #Thanksgiving #DeutscheBank #BullMarket #GoldForecast #HappyThanksgiving #MarketHoliday #2026Outlook #TradingBreak

XAUUSD – Possible Wave 4 Triangle Before the Final Push (Wave 5)Gold is currently showing signs of developing a contracting Wave 4 triangle, which aligns well with the broader Elliott Wave structure.
After completing Wave (3), price appears to be carving out an A–B–C–D–E formation inside a narrowing channel. Each leg is respecting the internal triangle boundaries, suggesting that bulls are consolidating before the next impulsive leg.
🔍 What I’m Watching
Wave (A) and Wave (C) have already printed, with strong reactions at the lower channel line.
Wave (B) and Wave (D) are forming lower highs inside the internal corrective structure.
Price remains supported by the major ascending channel, keeping the uptrend intact.
A clean Wave (E) touch on the lower triangle boundary would complete the pattern.
🟦 Bullish Scenario
If Wave (E) completes successfully on support and we break above the internal triangle resistance, this can trigger Wave (5), targeting the upper boundary of the long-term channel.
🔻 Bearish Risk
Invalidation occurs if price breaks below the ascending channel support, which would negate the triangle structure and open the door to deeper retracement levels.
📈 Conclusion
The structure favors consolidation before continuation. As long as the ascending channel holds, the bias remains bullish with anticipation of Wave (5) after triangle completion.

XAU/USD: Bullish Push to 4158?As the previous analysis worked exactly as predicted, FX:XAUUSD is eyeing a bullish push on the 1-hour chart , with price rebounding from a key support zone near cumulative sell liquidation, converging with a potential entry area that could ignite upside momentum if buyers defend against short-term dips. This setup suggests a reversal opportunity amid recent consolidation, targeting higher levels with strong risk-reward.
Entry between 4020-4032 for a long position🎯. Targets at 4158 (main). Set a stop loss at 3990 to limit exposure📊, yielding a risk-reward ratio of approximately 1:3 . Monitor for confirmation via a bullish candle close above entry with rising volume, leveraging gold's safe-haven appeal.🌟
Fundamentally , gold is attempting to stabilize above $4,000 after a sharp pullback, with early signs of a short-term rebound as markets digest fading Fed rate cut hopes and await key US data. Forecasts indicate an average of $3,675/oz by Q4 2025, but recent surges to $4,239 highlight volatility driven by ETF flows and central bank policies. 💡
📝 Trade Setup
🎯 Entry Zone (Long): 4020 – 4032
🎯 Target (TP1): 4158
❌ Stop Loss: 3990
⚖️ Risk-to-Reward: Approximately 1:3, offering a solid reward structure with defined downside.
What's your outlook on this setup? Drop your thoughts below! 👇


XAUUSD: Buy ideaBuy idea on XAUUSD as you can see on the chart if and only if we have the breakout with force the resistance line by the buyers.

Gold Trade Plan 25/11/2025Dear Traders,
Gold is near the top of the descending channel. I expect the price to reach the 4160–4180 area, which is the channel's upper boundary, and based on the price action, we will assess whether the corrective wave will continue or a drop toward the trendline's lower boundary will occur in the first phase.
Regards,
Alireza!

Continue to accumulate - gold price moves slowly around 4050⭐️GOLDEN INFORMATION:
Gold (XAU/USD) trades firmer near $4,075 in early Asian hours on Monday, supported by rising expectations of a Fed rate cut following comments from John Williams. Attention now turns to Tuesday’s US September PPI and Retail Sales data.
Williams noted Friday that the Fed could still lower rates soon without derailing progress on inflation. Markets now see nearly a 74% chance of a December cut, up from 40% last week, according to the CME FedWatch Tool. Softer rates would lower the opportunity cost of holding non-yielding gold, offering the metal additional support
⭐️Personal comments NOVA:
Gold price continues to accumulate and move sideways in the range: 4000 - 4100, The market did not have many major changes at the beginning of the week.
⭐️SET UP GOLD PRICE:
🔥SELL GOLD zone: 4143 - 4145 SL 4150
TP1: $4130
TP2: $4120
TP3: $4100
🔥BUY GOLD zone: 4003 - 4001 SL 3996
TP1: $4016
TP2: $4028
TP3: $4040
⭐️Technical analysis:
Based on technical indicators EMA 34, EMA89 and support resistance areas to set up a reasonable SELL order.
⭐️NOTE:
Note: Nova wishes traders to manage their capital well
- take the number of lots that match your capital
- Takeprofit equal to 4-6% of capital account
- Stoplose equal to 2-3% of capital account

XAU/USD Chart Analysis: Market Volatility Eases (Again)XAU/USD Chart Analysis: Market Volatility Eases (Again)
As the daily XAU/USD chart shows today, the ADX indicator is trending downwards following the extremely turbulent swings in October. This suggests:
→ gold price volatility is decreasing;
→ the market is finding balance around the psychological $4,000 level;
→ it recalls mid-July, when we noted a period of reduced volatility.
At that time, we:
→ drew an ascending channel;
→ observed that supply and demand were balancing each other, effectively reflecting all factors influencing the price.
Looking back, it can be noted that the market was in a consolidation phase (A) before the rally resumed (B) with renewed strength, as the price broke through the R1 resistance of the consolidation pattern.
It is reasonable to suggest a similar scenario may be occurring now, with the market in a new consolidation phase (C), and price fluctuations around the psychological $4,000 level reflecting new factors, including:
→ Anticipation of Fed action: Traders are hesitant to push prices to new highs ($4,400) without assurances of further monetary easing, yet are reluctant to sell below $3,900, as the global rate-cut cycle is not yet complete.
→ Dollar strength (DXY) at the end of October – early November.
→ Stabilisation of the geopolitical backdrop.
According to analysts from JPMorgan, Goldman Sachs, and independent experts, gold may remain within a range of $3,950 – $4,150 until the end of 2025.
By analogy with the previous situation, we can expect R2 to hold, with bulls “taking a break” while gold drifts towards the lower boundary of the current channel.
This article represents the opinion of the Companies operating under the FXOpen brand only. It is not to be construed as an offer, solicitation, or recommendation with respect to products and services provided by the Companies operating under the FXOpen brand, nor is it to be considered financial advice.

The Most Likely Scenario for Gold: A Bearish MoveUsing wave analysis, the chart suggests that gold is likely entering a potential downward movement. After completing the internal wave C within the corrective structure, we may now be heading toward the larger bearish wave C.**
**This is currently the most probable scenario to unfold on the gold chart. We observe the developments closely with the eye of a hunter, and I will publish the exact entry point once a high-quality setup appears.**
**Stay tuned

XAUUSD set to go another 500 pips?XAUUSD had bullish breakout early this asian session fueling by AUD breakout and DXY bearish move has boosted GOLD to remain bullish after Monday's strong breakout of weekly resistance level.
Market is maintaining series of higher low on 1h timeframe a pressure on current daily high at 4169.00
Breaking above 4169.00 and candle close in 4h or 1h can triiger buy trade targeting to 4210.00
Follow for more updates and analysis !

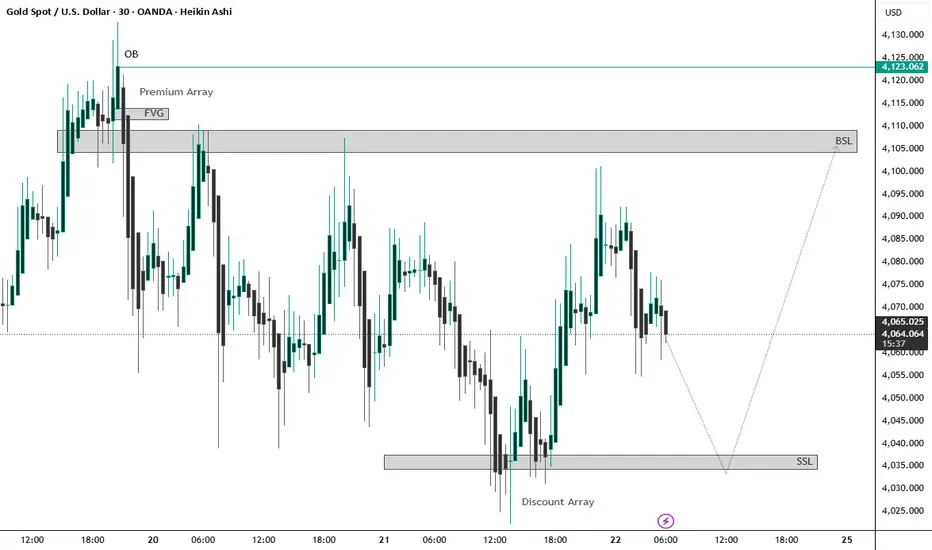
the mid-range, between a Premium Array above and a Discount ArayAt the top, there’s an Order Block (OB) and a marked Buy-Side Liquidity (BSL) level around the 4,105–4,125 region, indicating a potential bullish target if price moves upward.
A Fair Value Gap (FVG) is highlighted within the premium range, suggesting an imbalance that price may return to fill during a retracement.
In the lower region, the chart marks a Discount Array and a Sell-Side Liquidity (SSL) pool near the 4,035–4,045 area, hinting at a possible liquidity sweep before a reversal.
The projected path on the chart suggests a bearish move first, targeting the discount area and SSL, followed by a bullish reversal aiming back toward the premium zone and BSL.
Overall, the chart outlines a clear liquidity-based scenario: liquidity grab below → bullish expansion toward
XAUUSD – Full Technical Breakdown (Daily TF)✨ XAUUSD – Detailed Technical Analysis (Daily TF)
📍 Price is currently around 4064, sitting inside a mid-range zone where the next breakout will decide direction.
🟢 BUY SETUPS
🛑 Buy if 4033 does NOT break
A strong demand zone where buyers previously stepped in.
🎯 Targets: 4100 → 4110 → 4150
Reason: Price respects this area as a pivot and reacts with strength.
🚀 Strong Buy above 4185
A major resistance level. A breakout candle close above 4185 signals bullish continuation.
🎯 Targets: 4200 → 4250 → 4350
Reason: Clean upside liquidity and momentum expansion expected.
🔴 SELL SETUPS
⚠️ Sell if 4030 breaks
A key structural breakdown level showing bears taking control.
🎯 Targets: 4020 → 4000 → 3990 or deeper
Reason: This zone marks the shift from bullish to bearish structure.
🔥 Strong Sell below 3989
A critical support. A break activates a deeper correction phase.
🎯 Targets: 3900 → 3850 → 3750
Reason: Large imbalance zone below 3989 which could accelerate downside.
📊 Overall Market View
Price is consolidating between 4033 and 4185.
Above 4185 = bullish continuation ✨
Below 3989 = bearish continuation 🔻
Inside the range = sideways liquidity building 🔄
