SHORT GOLDGold has been very bullish but there is a completion of FIB inversion pattern hence a potential downside.. Alway manage risk as you sell.
Trade ideas

GOLD – Liquidity Build-Up Ahead of Fed DecisionGOLD – Technical Overview
Gold is entering a high-tension phase as markets position ahead of the upcoming interest-rate decision by the
With a 25 bps cut nearly guaranteed, traders are shifting focus away from the decision itself and toward how the market reacts to it, especially in the hours surrounding the announcement.
Unlike earlier this year, the market is showing signs of pre-event positioning, where price stalls inside a broad range while liquidity builds on both sides. This type of structure often precedes a sharp directional break, but not before a sweep of the weaker stop-zones.
Additional pressure is coming from renewed tariff threats by
Donald Trump, which have weakened the
US Dollar Index and created a supportive backdrop for gold.
Market participants are also preparing for the delayed JOLTS job-openings report, which historically triggers a spike in intraday volatility. In previous cycles, gold has tended to dip into deeper support before recovering during the first 24–48 hours after a rate cut.
Overall, the current structure suggests a market that is coiling, waiting for enough liquidity to be collected before the next major move.
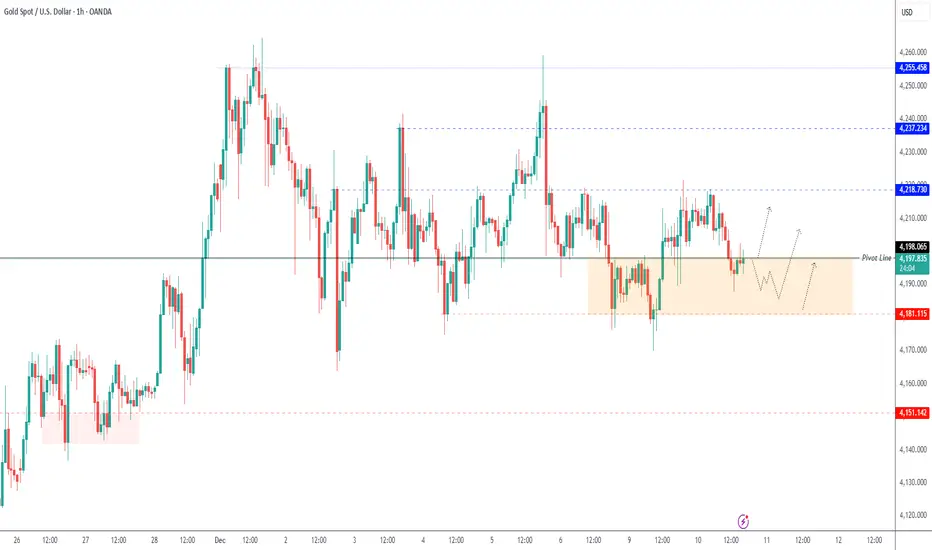
Technical Outlook – Liquidity Concept Added
Gold is now approaching 4198, a key intraday liquidity zone.
A 15min or 1H close below 4198 will unlock the bearish continuation toward
→ 4181 (liquidity pool)
→ 4152 (deep liquidity + strong demand zone)
These levels align with typical pre-FOMC liquidity grabs.
While above 4198, gold will consolidate between 4198 and 4218 until the next break.
A break and 1H close above 4218 will activate bullish momentum toward: 4237
→ Higher extensions if volatility expands post-data.
Pivot Line: 4204
Support: 4198 · 4181 · 4152
Resistance: 4218 · 4237

Gold intra-day selling opportunity showed after Fibo & OB bounceXAUUSD (Gold/US Dollar).
Timeframe: 15-minute chart (15m).
Trend Context: The price experienced several increase and decrease but made an imbalance on 1H timeframe yesterday, and it's probably going to decline till closing the FVG on 1h.
There is a major ascending orange trendline acting as dynamic support. The price recently tapped this line and bounced, creating the current upward retracement, but in the last 4 hours, it is showing a probability to break this line down.
I see what I see depending on several reasons:
1. ChoCh (Change of Character) indicating a structural shift that often precedes a retracement or reversal.
2. Fibonacci & Key Levels
The price is trying to bounce back from the golden area of the recent bearish swing (high to low)
0.5 Level (Equilibrium): Located at 4203.330. The price is currently testing this area.
0.618 Level (Golden Zone): Located at 4206.995. This level acts as strong resistance and aligns with the entry zone.
3. Trade Setup (Short/Sell Idea)
The setup is a bearish continuation play, looking to short the market as it retraces into a supply zone.
The entry is just before the OB on 15 min
The target is set near the recent swing low, anticipating that the price will reject the Order Block and fall back down.
⚠️ Note
This is a technical outlook based on my POV to the chart. Always manage risk carefully and adapt if market conditions change
I would be grateful to get your feedback on this idea if you have any opinions to share.
✽ Improve your awareness to seek a great analysis ✔
@AbdullahTech ♾

GOLD – MARKET OUTLOOK | Watching 4198 as Fed Signals ApproachGold prices are slipping slightly ahead of remarks from
Jerome Powell, but the metal continues to hold above the $4,181 support zone.
With expectations high for a rate cut, traders are looking for clarity on the Federal Reserve outlook for 2026.
A recent slump in U.S. government bonds has dampened risk appetite, as concerns grow about the pace of future monetary easing.
Lower interest rates generally support non-yielding assets such as gold, so Powell’s tone will be critical for short-term direction.
Technical Analysis
Gold is currently in a corrective movement toward 4181, where buyers may attempt to re-enter.
A bullish recovery is favored while the price remains above 4198.
Above 4198: bullish momentum continues toward 4218,
and a breakout above this level opens the way toward 4237.
Below 4198: bearish pressure strengthens toward 4181.
A clean break below 4180 would activate a deeper bearish trend, likely targeting the broader support zone near 4152.
Pivot Line: 4198
Resistance: 4218 · 4237
Support: 4181 · 4152
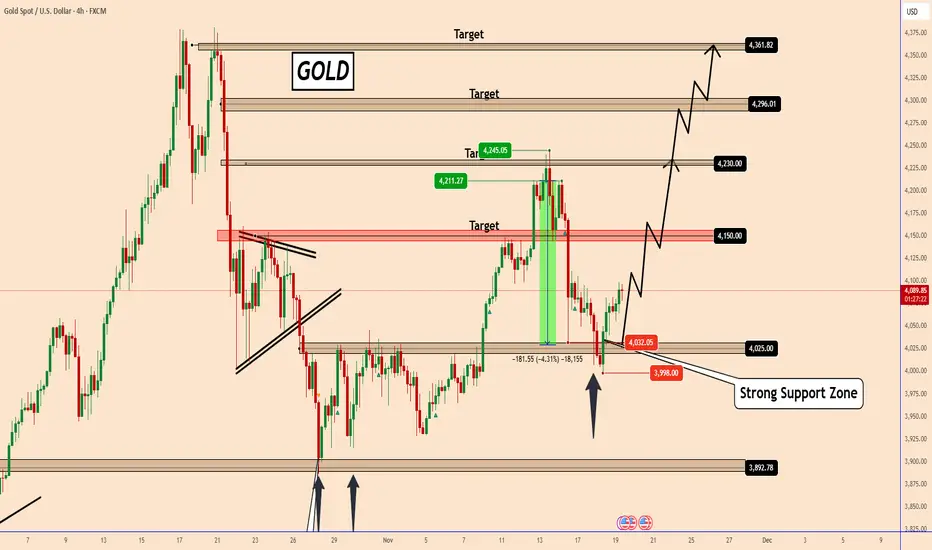
GOLD Forming Bullish Structure Above 4000 SupportGOLD Forming Bullish Structure Above 4000 Support
GOLD remains supported above the strong demand zone near 3998–4032, where price has shown repeated bullish reactions in the past. The market recently tapped this zone again and is attempting to stabilize.
As long as the structure holds above this key support zone, the probability favors a renewed bullish leg targeting:
4150
4230
With extension levels at 4290 and 4360 if momentum accelerates
A break below 3998 would invalidate the bullish scenario; however, for now, price action continues to respect the support area, suggesting that buyers may attempt to reclaim higher levels.
You may find more details in the chart!
Thank you and Good Luck!
❤️PS: Please support with a like or comment if you find this analysis useful for your trading day❤️
The Discipline of Doing Nothing“A trader’s strength is not measured by how often they enter…
but by how long they can wait.”
Most traders believe progress happens when they trade.
But in reality, progress often happens in the moments when
you choose not to trade.
Waiting is not passive.
It is an active decision to protect capital.
It is choosing patience over impulse.
It is the discipline that separates a gambler from a trader.
Why Doing Nothing Is Hard
Your brain seeks stimulation, not discipline.
Silence creates discomfort.
Watching price move without you creates doubt.
So you justify a trade:
“It might run…”
“It looks like a breakout…”
“It could work…”
But price doesn’t reward “could.”
Price rewards confirmation and alignment.
What Doing Nothing Actually Means
• You skip trades that don’t fit your plan
• You conserve emotional energy
• You let the market come to your level
• You wait for structure to speak clearly
Every skipped bad trade increases your edge.
Every patient decision sharpens your mindset.
Doing nothing gives you the chance to do something right.
The Invisible Skill
Nobody sees the trades you avoid.
Nobody congratulates you for sitting on your hands.
But those unseen decisions prevent the biggest losses.
The most profitable trades
often start with stillness.
📘 Shared by @ChartIsMirror
Do you respect the moments between setups…
or do you rush to fill them? Comment below.

Gold has pulled back after its recent push higher....Gold has pulled back after its recent push higher, and the current structure suggests a developing corrective phase rather than a full reversal. Momentum remains mixed, but the broader flow hints that the market may still be preparing for another upward leg once this consolidation completes. With price movement tightening, the next impulsive move could unfold sooner than expected making this an interesting setup to watch closely.
**Disclosure:** We are part of Trade Nation's Influencer program and receive a monthly fee for using their TradingView charts in our analysis.

GOLD (XAUUSD): Support & Resistance Analysis Ahead of FOMC
Here is my latest support and resistance analysis for Gold.
As you can see, the market continues consolidating
between Support 1 and Resistance 1, forming a horizontal range.
Before the FED, expect a continuation of a sideways price action within.
After FOMC & FED Interest rate decision, consider a breakout of
one of the underlined structures as a confirmation.
❤️Please, support my work with like, thank you!❤️
I am part of Trade Nation's Influencer program and receive a monthly fee for using their TradingView charts in my analysis.

big fallingHello friends
Today is the end of the gold party and from now on I will expect a big drop in gold
Happy and profitable
Hassan Barati
Trader of Abtin Financial Academy

DeGRAM | GOLD will rebound to the $4370 level📊 Technical Analysis
● XAU/USD trades within a rising channel, respecting the ascending support line while printing higher lows. Repeated consolidations above 4,190–4,200 confirm strong demand and controlled bullish structure.
● Price is compressing below the upper trend resistance near 4,285–4,300, forming a continuation range that favors an upside breakout toward the major resistance at 4,370.
💡 Fundamental Analysis
● Gold remains supported by expectations of softer US monetary policy and persistent geopolitical risks, which continue to underpin demand despite short-term USD fluctuations.
✨ Summary
● Bullish bias above 4,200. Upside targets: 4,300 → 4,370. Key support: 4,190–4,200.
-------------------
Share your opinion in the comments and support the idea with a like. Thanks for your support!

Gold before breakout its in range watch levels📊 Gold (XAU/USD) – 30M Timeframe Outlook
📌 Key Range: 4202 – 4218
🔼 Bullish Scenario:
If price breaks above 4218, upside targets are:
✨ 4230
✨ 4237
✨ 4248
🔽 Bearish Scenario:
If price breaks below 4202, downside supports are:
🛑 4193
🛑 4178
🛑 4170
💡 Note: Always use proper risk management and wait for confirmation before entering any trade.
👍 Like | 💬 Comment | 🔁 Share

GOLD: Short Trade with Entry/SL/TP
GOLD
- Classic bearish formation
- Our team expects pullback
SUGGESTED TRADE:
Swing Trade
Short GOLD
Entry - 4218.4
Sl - 4224.0
Tp - 4207.6
Our Risk - 1%
Start protection of your profits from lower levels
Disclosure: I am part of Trade Nation's Influencer program and receive a monthly fee for using their TradingView charts in my analysis.
❤️ Please, support our work with like & comment! ❤️

GOLD is bullish : buy now...XAUUSD (GOLD) was recently in a short term downtrend for a few weeks but has now shown some clear bullish movements ahead. XAUUSD (Gold) has broken out of a downward trend channel that was acting as strong resistance, The price is very likely to head to the next strong resistance level which is marked as the take profit zone (green line). BUY GOLD NOW

GOLD vs SP500 Bullish!Gold is outperforming the S&P 500 by 38%+
It is currently in the process of what seems to be a nice and bullish old-fashioned cup and handle.
More data is needed, but keep an eye on it.
Ask yourself, why is so much money pouring into gold over the SP500??
Let's get to 6,000 followers. ))

The perfect time to buy gold!Gold remains inside a tight accumulation range beneath the premium supply zone at 4256–4268. Price continues respecting trendline support, and every sweep into 4168–4185 demand has been met with strong re-accumulation.
As long as demand holds, the market is likely preparing to deliver toward unmitigated liquidity above.
Bullish Continuation Plan
Maintain structure above 4180–4185 → bullish bias remains valid.
If price reclaims 4214–4222, expansion becomes likely:
Target 1: 4238
Target 2: 4256
Target 3: 4268 liquidity objective
Bearish Breakdown Plan (Only if Demand Fails)
Break & acceptance below 4170 = bullish structure invalid.
First target: 4135
Extended target: 4050–4080 HTF demand
Bias: Neutral inside the range. Bullish above 4214. Bearish under 4170.
No trades in the middle — only traps.

Gold prices fluctuated, experiencing repeated oscillations.
Gold prices retreated during Thursday's Asian session, primarily reflecting improved market risk appetite and reduced safe-haven demand amid thin holiday trading. As market expectations for another Fed rate cut in December intensified, coupled with rising hopes for regional peace negotiations, global market sentiment turned optimistic, prompting some funds to flow from gold to risk assets. This week's US economic data was mixed, but overall did not change the market's assessment of the Fed's policy path. Data from the US Commerce Department showed that durable goods orders rose 0.5% in September, a significant slowdown from the previous 3.0%, but still higher than the market forecast of 0.3%. Excluding transportation, orders rose 0.6%, indicating continued resilience within the manufacturing sector. Gold prices retreated slightly after previous gains, mainly influenced by improved market risk appetite and rising expectations for peace negotiations. However, strong expectations of a Fed rate cut in December put pressure on the dollar, continuing to support gold. While various US economic data showed mixed results, they did not shake the market's judgment on a rate cut.
Recent speeches by several Federal Reserve officials have clearly shifted towards a dovish stance. John Williams of the New York Fed stated that if the economy remains as it is, interest rate cuts would not affect the inflation target; while Fed Governor Waller pointed out that the weakness in the labor market is sufficient to support another rate cut. Against this backdrop, the dollar index fell to a one-week low, continuing to be a significant supporting factor for gold. On the other hand, signs of improvement in the atmosphere surrounding regional peace negotiations have further boosted risk appetite. Multiple statements indicate that while negotiations remain far off, external sentiment has improved, thus weakening gold's safe-haven appeal. Overall, gold's fundamentals present a mixed structure of "cooling safe-haven demand + support from interest rate expectations." Short-term fluctuations in gold are more driven by sentiment than by trend reversal signals. From the combined perspective of interest rate expectations, dollar performance, and technical structure, this round of correction is more like a natural adjustment within an upward trend. If subsequent economic data continues to support expectations of rate cuts, then gold still has the potential to resume its upward trend after retracing to key support levels. However, it should be noted that fluctuations in peace negotiation expectations could bring additional volatility. There are no key data releases or events to watch today. The gold market will close two hours early due to Thanksgiving in the US, but this can be disregarded.
Gold Price Analysis:
Gold touched around 4173 in the US session yesterday before falling back. We identified the 4170-75 resistance level yesterday, a key resistance point we've emphasized in the past two days. If this level continues to act as resistance today, the downward momentum may persist. This morning, gold saw a slight pullback to around 4140 before consolidating in a narrow range. This morning's pullback is likely a tentative move; we will continue to monitor the resistance level to see how much further it may fall.
Looking at the four-hour chart, the triangle consolidation pattern for gold remains unchanged. The downward trendline resistance is at 4173-75. Only a decisive break above this trendline will allow for further upward movement and a new opportunity. Otherwise, it will remain in consolidation at the end of the consolidation phase. On the one-hour chart, the price has started to break below the short-term support zone and is now under pressure from the short-term moving averages. There may be some room for adjustment in the short term; we will monitor the short-term correction. Today, continue to focus on the resistance level of the upper trendline of the triangle pattern, which is also the watershed between bulls and bears. If the resistance holds, expect a pullback. Therefore, we still need to try to establish short positions today. If there is a rebound to around 4168-73, we can short. In summary, the short-term trading strategy for gold today is to focus on selling on rallies. The key resistance level to watch in the short term is 4173-4175, and the key support level is 4110-4100. Please keep up with the pace.

GOLD 4H CHART ROUTE MAP UPDATE & TRADING PLAN FOR THE WEEKHey Everyone,
Please see our 4h chart remaining levels and targets for the coming week with one updated Goldturn.
We are now seeing price play between two weighted levels with a gap above at 4224 and a gap below at 4124. We will need to see ema5 cross and lock on either weighted level to determine the next range.
We will see levels tested side by side until one of the weighted levels break and lock to confirm direction for the next range.
We will keep the above in mind when taking buys from dips. Our updated levels and weighted levels will allow us to track the movement down and then catch bounces up.
We will continue to buy dips using our support levels taking 20 to 40 pips. As stated before each of our level structures give 20 to 40 pip bounces, which is enough for a nice entry and exit. If you back test the levels we shared every week for the past 24 months, you can see how effectively they were used to trade with or against short/mid term swings and trends.
The swing range give bigger bounces then our weighted levels that's the difference between weighted levels and swing ranges.
BULLISH TARGET
4224
EMA5 CROSS AND LOCK ABOVE 4224 WILL OPEN THE FOLLOWING BULLISH TARGET
4328
EMA5 CROSS AND LOCK ABOVE 4328 WILL OPEN THE FOLLOWING BULLISH TARGET
4422
EMA5 CROSS AND LOCK ABOVE 4422 WILL OPEN THE FOLLOWING BULLISH TARGET
4494
BEARISH TARGETS
4124
EMA5 CROSS AND LOCK BELOW 4124 WILL OPEN THE FOLLOWING BEARISH TARGET
4042
EMA5 CROSS AND LOCK BELOW 4042 WILL OPEN THE SWING RANGE
3964
3873
As always, we will keep you all updated with regular updates throughout the week and how we manage the active ideas and setups. Thank you all for your likes, comments and follows, we really appreciate it!
Mr Gold
GoldViewFX

Gold Bulls Hold Control — Targeting $4,320 ResistanceHello traders! Here’s my technical outlook on XAU/USD (Gold) based on the current market structure shown on the chart. After a strong bullish impulse earlier in the period, Gold formed a distribution Range below the main Resistance Level, where multiple upside attempts were rejected and the price eventually turned around from the upper range boundary. This rejection initiated a corrective decline that respected the descending Resistance Line, while buyers gradually began to defend the Support Line, leading to a compression structure that later transitioned into a reversal phase. Following this consolidation, Gold successfully broke above both the internal range and the descending resistance, confirming a shift in market structure. Price then entered a well-defined ascending channel, forming higher highs and higher lows along the rising Support Line. Several clean breakouts inside the channel confirm sustained bullish momentum, with buyers clearly in control as long as the channel structure remains intact. Currently, price is consolidating just above the $4,160–$4,140 support zone, holding above former breakout levels and respecting the lower boundary of the ascending channel. This behavior suggests a healthy bullish pullback rather than trend exhaustion. As long as Gold remains above this support area and holds inside the channel, the bullish scenario remains valid. My expectation is for a continuation move toward the upper boundary of the channel, with the main upside target at TP1 around $4,320, where the previous resistance and projected channel resistance converge. A clean breakout above this level would open the door for further bullish expansion. However, a sustained break below the $4,140 support or a drop out of the channel would weaken the bullish structure and could trigger a deeper corrective move. Please share this idea with your friends and click Boost 🚀

XAU/USD (Gold) H4 AnalysisXAU/USD (Gold) H4 Analysis: Anticipating a Market Structure Shift (CHoCH) using Proprietary Trend Break Target Indicator
Hello traders,
We are conducting a detailed technical analysis on XAU/USD (Spot Gold) using the 4-Hour (H4) timeframe. Our focus is on identifying a high-probability reversal point using a custom-developed tool: the Trend Break Target (TBT) Indicator. This indicator is designed to detect early market structure shifts and project potential continuation targets.
Current Market Context and Bias
Gold has shown volatility, but the immediate structural integrity is being tested. Our analysis suggests that the current move is consolidating or approaching a critical inflection point. The resolution of this consolidation, specifically relative to our defined structural levels, will dictate the next significant directional move.
The Critical Confirmation Trigger
The entire bearish hypothesis hinges on one non-negotiable condition, which defines the Change of Character (CHoCH) in the H4 structure:
The Structure Break: We are closely monitoring the Red Dashed Line generated by our TBT indicator. This line represents a crucial swing low or internal support level whose violation signals a definitive shift in market control from buyers to sellers.
Confirmation Requirement: A sustained break and a clear candle close below this Red Dashed Line is required. A mere wick breach is insufficient. This close will officially mark the Change of Character (CHoCH), confirming that the short-term market bias has switched to Bearish.
Actionable Signal: Only upon this confirmed breakdown should traders consider entering a short position, using the close below the line as the entry trigger or confirmation point.
Projected Downside Targets (TBT Projections)
Should the CHoCH be confirmed, our proprietary indicator projects two key targets for the continuation of the bearish momentum:
🎯 Target 1 (Initial Objective): $4125
This level acts as the first high-probability objective, typically aligning with a measured move calculation or a previous area of interest (POI). It represents the immediate profit-taking zone for the initial bearish thrust.
🎯 Target 2 (Continuation Objective): $4067
If bearish momentum persists and the 4125 level is broken, the market is likely to extend its move toward 4067. This target represents a deeper structural test and a potential area for a significant price bounce or further capitulation.
Risk Management Consideration
For any trade initiated based on this breakdown, an appropriate stop-loss placement should be considered above the swing high that precedes the breakdown, or judiciously placed above the Red Dashed Line to invalidate the bearish structure quickly if price reclaims the level.
Disclaimer: This analysis is based on a proprietary trading model and is for informational and educational purposes only. Market conditions can change rapidly. Always apply sound risk management and conduct your own due diligence.

Gold traded within a rangeIn the short term, gold remains range-bound. It's not advisable to chase higher prices before a valid breakout. The recommended strategy is to buy on dips. Consider entering long positions near 4195. If the price breaks through the 4230 resistance level, add to long positions, targeting the 4245-4255 area. This area represents a resistance zone formed by connecting the previous downtrend highs; a break above this level would signal the start of a daily-level rebound in gold.
In the short term, the market will likely continue to trade within a range; the strategy should be to buy on dips.

THE KOG REPORT - UpdateEnd of day update from us here at KOG:
As we said yesterday we would stick with the plan from Sundays report which has worked well so far. We managed to get the move up and down, then another red box trade for a long and some traders even went in for the short from our given level of 4328,
Now, we may experience some ranging with the key level at the hot spot 4220and support at the hot spot 4187. We would like to see this go a little higher but that resistance is important for the break!
As always, trade safe.
KOG

XAUUSD one more down wave might be comingwe will be talking about 5k next year but today and near future i think correction may continue, for now i am waiting on the sides and look for a short when another big correction wave starts, possible targets 4126-4080-3860 theese targets are for only to start next impulsive wave, market always goes around in same cycle, Impulse-Correction-Impulse-Correction and i intend to be there when next impulse starts, so catious sell when it goes high until next impulse.

Gold trading plan!- Change of Characteristics
- Symmetrical Triangle as an corrective pattern in Short Time Frame
- Consolidation Phase
- Order Block
- Fair Value Gap
