Gold trading plan!- Change of Characteristics
- Symmetrical Triangle as an corrective pattern in Short Time Frame
- Consolidation Phase
- Order Block
- Fair Value Gap
Trade ideas

Gold buy idea Gold has been struggling to break below the 200 EMA for the past 7 hours, and the rising volume shows buyers consistently stepping in. With initial jobless claims coming in worse than expected, the added uncertainty is pushing gold higher. Price has now broken above the POC zone with increasing volume, showing clear bullish intent and opening the path toward 4250. The key confluences are simple: volume is rising at the 200 EMA, and price is holding above the POC, confirming buyers are in control. The only reason to avoid the trade is if price closes with a strong bearish candle below 4205 or if it fails to break through the mid-range level at 4225

BUY XAUUSDXAUUSD last minute entry for a bullish move back up to 4250 resistance area. Price looks to be moving up away from the M15 support area.

GOLD Will Go Lower! Short!
Please, check our technical outlook for GOLD.
Time Frame: 1h
Current Trend: Bearish
Sentiment: Overbought (based on 7-period RSI)
Forecast: Bearish
The price is testing a key resistance 4,342.30.
Taking into consideration the current market trend & overbought RSI, chances will be high to see a bearish movement to the downside at least to 4,275.30 level.
P.S
Overbought describes a period of time where there has been a significant and consistent upward move in price over a period of time without much pullback.
Like and subscribe and comment my ideas if you enjoy them!

XAUUSD H4 | Direction Buy Or Sell ? Lets Find ItGreetings 👋
Gold Selling In H4 ! REASONS ?
Simple Reasons H4 Head And Shoulder Pattern Green Box And Also QML Point Key Level Price
CISD / SBR : Support Become Resistance Level To Sell Gold With Confidence
Strong Bearish Fair Value Gap To Sell Xauusd Easily And Set A Big Target 🎯

XAU/USD: Hold Gold, Await Big Waves from PCE!Gold is moving sideways within a narrow range, supported by a weak USD and expectations of a dovish Fed. All attention is focused on the upcoming PCE Index – the data will determine the long-term momentum of XAU/USD!
📰 Fundamentals: Awaiting Major Signals
Gold's Advantage: USD weakens due to predictions of early Fed rate cuts + Safe haven demand.
Key Point: PCE data will be the "push" confirming the Fed's path.
📊 4H Technical: Trend-Following Buy Strategy
Market structure remains BULLISH. We await a correction to enter at optimal price levels:
Ideal BUY Zone (OTE/Support):
Price: $4,133 - $4,161
Action: Wait for reversal signals here to BUY (Long).
Upside Target: $4,334 up to $4,382 (Previous high).
Safe Stop Loss: Below $4,046 (Below OB), a break here will invalidate the bullish structure.
🎯 In Summary: BE PATIENT! Look to BUY in the $4,133 - $4,161 zone after PCE release to optimize R:R.
#XAUUSD #GOLD #Gold #PCE #FED #TradingView #MarketStructure #OTE #Forex

GOLD SNIPER ENTRY.Hello my trader friends!
I’m back after just a few hours. Earlier today, I shared a gold analysis with you.
At first, I expected a bullish move after the break of the bearish trendline, followed by a price correction — and now I invite you to see the results of this beautiful and precise analysis.
This setup played out so clean and accurate that it left nothing more to say!
Our profits from this analysis:
✔️ Buy: +420 pips
✔️ Sell: +600 pips
Follow me for more accurate and profitable analyses.
🚀 GOLD SNIPER ENTRY — 420 BUY + 600 SELL DOMINATED!

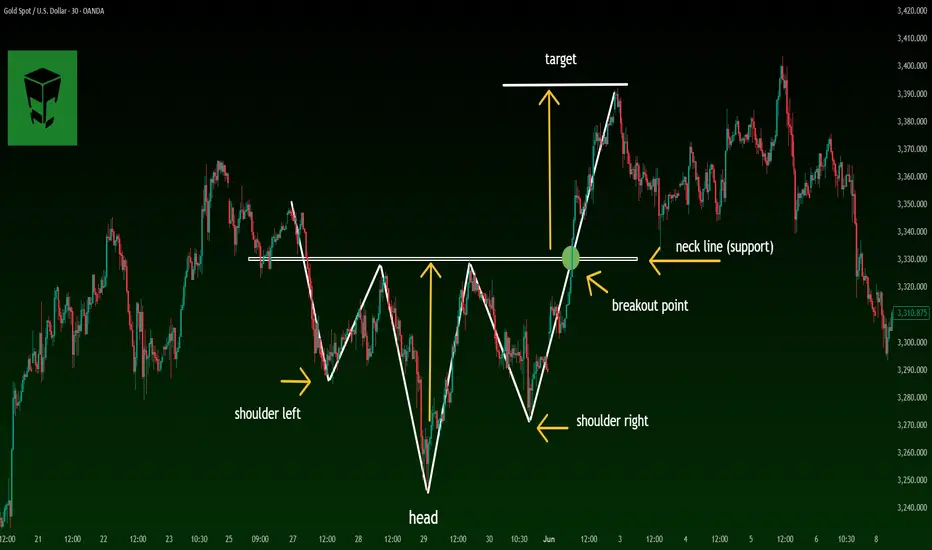
Secrets of the Head & Shoulders Pattern for Profitable trade📘 Complete & Professional Guide to the Head and Shoulders Pattern
The Head and Shoulders pattern is one of the most reliable and powerful reversal formations in technical analysis. It typically appears at the end of an uptrend and signals that the bullish momentum is weakening.
🔹 1. What Is the Head and Shoulders Pattern?
The structure consists of three peaks:
🟦 Left Shoulder
The first peak followed by a minor pullback.
🟪 Head
The highest and central peak of the pattern.
🟩 Right Shoulder
The third peak, usually similar in height to the left shoulder but lower than the head.
🔻 Neckline
A support line drawn through the two pullbacks between the shoulders and the head.
A break below this line is the official trade trigger.
🔹 2. What the Pattern Indicates
This formation shows that the bullish trend is losing momentum and a bearish reversal may be approaching.
Left Shoulder → First sign of weakness
Head → Buyers’ final push to make a new high
Right Shoulder → Failure to create a higher high
Neckline Break → Sellers taking control
Pullback → Best entry for professional traders
🔹 3. How to Properly Identify the Pattern (Professional Criteria)
✔️ 1) A Prior Uptrend
Without a preceding trend, the reversal pattern is invalid.
✔️ 2) Three Distinct Peaks
Left Shoulder < Head
Right Shoulder < Head
Shoulders ideally near the same height
✔️ 3) Volume Behavior
Typical volume flow:
Left Shoulder → high volume
Head → moderate volume
Right Shoulder → declining volume
Neckline Break → strong volume (confirmation)
✔️ 4) Neckline Angle
Descending → stronger signal
Ascending → higher chance of false breakouts
Horizontal → neutral strength
✔️ 5) Valid Neckline Break
A strong candle closing beyond the neckline with solid volume is required.
Wicks or weak candles are not considered a true breakout.
✔️ 6) Pullback (Retest)
About 60% of the time, price retests the neckline.
This is the most professional and safest entry.
🔹 4. How to Trade the Pattern
📉 Sell Signal
Formation of the right shoulder
Neckline break
Enter after a candle closes below the neckline
or
Safer entry: enter after the pullback (retest)
🛑 Stop Loss Placement
Above the right shoulder
or
Above the last minor swing high
🎯 Take-Profit Target
Measure the height of the pattern (Distance from Head to Neckline)
Project downward from the breakout point
🔹 5. Inverse Head and Shoulders Pattern
This is the bullish version of the pattern and forms at market bottoms.
Three troughs instead of peaks
Breakout above the neckline triggers a buy
Same target projection applies
This formation often starts strong uptrends.
🔹 6. Pro Tips Used by Professional Traders
⭐️ The right shoulder is more important than the left
⭐️ A taller head indicates a stronger reversal
⭐️ Volume should decrease on the right shoulder
⭐️ Higher timeframes = higher reliability
⭐️ Best entry is after the pullback
🔹 7. Common Mistakes Traders Make
❌ Entering before the neckline is broken
❌ Confusing random peaks with a structured pattern
❌ Ignoring volume behavior
❌ Setting stop-loss levels too tight
❌ Trading the pattern in a sideways market
🔹 8. Final Summary
The Head and Shoulders pattern is one of the most trustworthy reversal signals.
A professional trader should always:
✔️ Confirm the prior trend
✔️ Identify the three-peak structure
✔️ Check volume behavior
✔️ Wait for a valid neckline break
✔️ Prefer pullback entries
✔️ Set proper SL/TP
✔️ Use higher timeframes for accuracy
With consistent practice on TradingView historical charts, you can master this pattern and use it as a profitable tool in your trading strategy.
Does a fluctuating gold price necessarily mean an upward trend?
news:
On Tuesday (December 9) in early Asian trading, spot gold traded in a narrow range, currently hovering around $4,192 per ounce. On Monday, spot gold prices fell slightly, closing at $4,190 per ounce, down 0.2%, while US gold futures settled down 0.6% at $4,217 per ounce. The market is taking a brief breather ahead of the Federal Reserve policy meeting, with investors holding their breath awaiting the latest statements from Fed Chairman Powell. Meanwhile, geopolitical tensions, dollar volatility, and unexpected events such as the Japanese earthquake are all subtly influencing gold's price movements.
Federal Reserve Chairman Jerome Powell stated that this rate cut is similar to the risk-management-driven rate cut in September. A December rate cut is far from certain, and a lack of economic data could provide a reason to pause rate adjustments. If information is lacking and the situation remains unchanged, there are reasons to slow the pace of rate cuts. There is significant disagreement within the committee regarding how to act in December. A growing number of officials want to postpone the rate cut, believing that at least one cycle should be waited. The government shutdown has cut off sources of economic data, but existing data suggests that the outlook has not changed significantly. Private data is being considered, but it cannot replace official data. Inflation levels remain slightly high, recent inflation expectations have risen, and long-term expectations are solid.
Technical indicators:
Looking at the 1-hour chart, the key resistance level to watch is 4240, with further short-term resistance around 4215-20. On the downside, the key support level is 4165-75. Technically, the current consolidation suggests a tendency to short on pullbacks. We should patiently wait for key entry points. Specific trading strategies will be provided in the channel; please pay close attention.
Strategy Signals:
Buy:4215-4220, stop loss : 4228, target :4190-4180.

XAU/USD NEXT MOVEGOLD NEXT MOVE...
Let me know what you think about my analysis in the comment section, and please hit boost and follow for more ideas.
Trading is not hard if you have a good coach! Thank you.

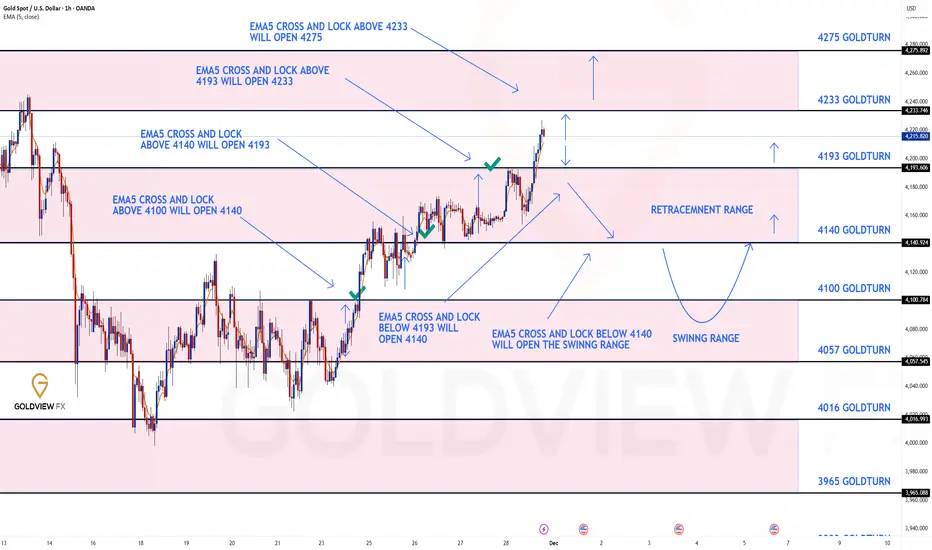
GOLD 1H CHART ROUTE MAP UPDATE & TRADING PLAN FOR THE WEEKHey Everyone,
Please see our 1h chart levels and targets for the coming week, which is still active and in play.
We are seeing price play between two weighted levels with a gap above at 4233 which is locked and a gap below at 4193 as support. We will need to see ema5 cross and lock on either weighted level to determine the next range.
We will see levels tested side by side until one of the weighted levels break and lock to confirm direction for the next range.
We will keep the above in mind when taking buys from dips. Our updated levels and weighted levels will allow us to track the movement down and then catch bounces up.
We will continue to buy dips using our support levels taking 20 to 40 pips. As stated before each of our level structures give 20 to 40 pip bounces, which is enough for a nice entry and exit. If you back test the levels we shared every week for the past 24 months, you can see how effectively they were used to trade with or against short/mid term swings and trends.
The swing range give bigger bounces then our weighted levels that's the difference between weighted levels and swing ranges.
BULLISH TARGET
4233
EMA5 CROSS AND LOCK ABOVE 4233 WILL OPEN THE FOLLOWING BULLISH TARGETS
4275
BEARISH TARGETS
4193
EMA5 CROSS AND LOCK BELOW 4193 WILL OPEN THE FOLLOWING BEARISH TARGET
4140
EMA5 CROSS AND LOCK BELOW 4140 WILL OPEN THE SWING RANGE
4100
4057
As always, we will keep you all updated with regular updates throughout the week and how we manage the active ideas and setups. Thank you all for your likes, comments and follows, we really appreciate it!
Mr Gold
GoldViewFX
1012 GOLD a new chance for mid-term buyersHello traders,
Gold Entry Opportunities Analysis (Harmonic Pattern + Fundamentals)
1. Key Harmonic Pattern Structure Verification
- Proportions:
- XA wave (Uptrend): Magnitude of 1.359;
- AB wave (Pullback): Retraces 0.794 of XA (aligns with the Bat Pattern’s AB = 0.618-0.786 of XA);
- BC wave (Rebound): Extends 1.102 of AB (aligns with the Bat Pattern’s BC = 1.13-1.618 of AB);
- CD wave (Decline): Currently retraces 0.904 of BC (close to the Bat Pattern’s CD = 0.886-1.13 of BC).
The pattern is nearly complete.
The target support for the CD wave corresponds to the 4170-4175 zone (overlapping with prior technical support).
2. Long Entry Opportunity (High-Level Consolidation + Breakout Bias)
Gold is currently in a high-level consolidation phase (trading within a tight range after recent gains). Entering long at the 4170-4175 support zone not only targets the short-term rebound (to 4220), but also positions for a medium-to-long-term breakout:
- Entry Conditions:
Price stabilizes in the 4170-4175 zone (confirmed by bullish candlestick patterns, e.g., hammer/engulfing) + RSI (current 45.13) rebounds above 50.
- Stop Loss:
Below 4163 (the starting point of the XA wave, a critical prior support level).
- Targets:
1st target: 4220 (the high of the BC wave);
2nd target: 4250+ (driven by the Fed rate cut narrative).
3. Fundamental Resonance
Current Fed rate cut expectations + the “dual buffer” from potential BOJ tightening limit deep short-term declines in gold. The harmonic support zone (4170-4175) coincides with the fundamental “pullback buying zone,” making it a high risk-reward long entry level.
GOOD LUCK!
LESS IS MORE!

🇺🇸 BULLISH ANALISIS- GOLD BREAKDOWN – XAU/USD
📌 1. Liquidity Sweep + Institutional Discount
The market completed a deep retracement that fully mitigated all the sell-side liquidity zone.
This allows institutions to accumulate long positions at discount prices.
A CHoCH + BOS sequence confirms that the bearish leg has finished.
📌 2. Fake-Out + Rejection at the POI (4,202)
Price delivered a clean fake-out, grabbed liquidity, and immediately rejected from the POI.
This rejection is a strong sign of institutional absorption.
The POI is aligned with:
✔ Discount zone
✔ Support
✔ Previous imbalance
👉 A high-probability entry is formed.
📌 3. Bullish Targets (Mitigation & Liquidity)
The upside roadmap is clear and progressive:
• TP1: 4,230 → first mitigation
• TP2: 4,254 → liquidity resting above
• TP3: 4,277 → full mitigation of imbalance + expected HH
Price is targeting the FVG on the 4H timeframe.
This is where institutions are expected to complete mitigation.
📌 4. Risk Management
SL at 4,180 protects the structure:
• Below support zone
• Below rejection wick
• Below liquidity
👉 If price breaks that level, the narrative changes.
🧮 Risk/Reward: 1:3
Excellent ratio aligned with institutional swing logic.
No forcing, clean and natural. GOOD LUCK TRADERS…

Gold Intraday ViewGold has shown a clear shift in behaviour after an extended downtrend, where price consistently respected lower highs and maintained pressure within the sell zone. The significant break of structure from the lower base marked the first meaningful sign that sellers were losing momentum. Once the market dipped into the buy zone, buyers responded firmly, lifting price with a cleaner series of higher lows, eventually forming a CHoCH that confirmed the shift in short-term control.
Following this transition, price has been attempting to stabilise above the reclaimed support levels, suggesting buyers are beginning to re-establish interest after a lengthy corrective phase. Even though intraday pullbacks remain present, they currently appear corrective rather than impulsive, giving the impression that the market is preparing for a potential continuation higher.
As long as the market holds within or above the identified buy zone, the broader intraday structure remains constructive for buyers. Smaller dips into previous support may simply offer opportunities for renewed buyer participation. With this developing structure, XAUUSD could extend toward the upper region marked on the chart, where the next reaction is likely to take shape. Overall sentiment leans cautiously bullish, supported by stabilising structure, the recent shift in control, and consistent reactions from key demand areas.”

Gold Rockets Higher – Buy Momentum UnstoppableGold showed a sharp upside movement today from the strong intraday support area 4200/4186 and the market reached a high of 5258, which clearly indicates that buyers are in full control. Such a strong bullish breakout usually continues in the same direction.
The price is trading far above the support zone, confirming strong momentum. As long as the market holds above support the probability of further bullish continuation remains high.
KEY POINTS
Entry Level 4213
Support Area. 4200/4186
Target 1. 4230
Target 2. 4255

Gold 30 Mints Bearish Trend & Short SetupThe chart shows a bearish trend for Gold on a 30-minute time frame. A Change of Character is indicated by the sharp price movement at the beginning of the chart, suggesting a reversal in the market. The price reaches the Supply Zone after liquidity is taken out, showing potential for a continued downward move. After the market tapped into the Demand Zone, the price exhibits a possible continuation setup, confirming the bearish trend. The chart's key points include liquidity in the supply zone and a potential short entry around 4,209.800, with targets set near the demand zone around 4,186.025. Keep an eye on the market’s reaction to these zones for confirmation of the next price action direction.

XAUUSD 10Dec 2025 🔥 Gold (XAUUSD) Trade Plans | 30M Chart
- Pullback Short (Scalp):
Sell 4,212-4,219 | SL: 4,220 | TP: 4,190
- Main Long (Distribution): Buy 4,181-4,172 | SL: 4,163 | TP: 4,260
Smart Money Concepts: Targeting pullback into demand zone, then bullish distribution! 🚀
_Not financial advice._
#Gold #SMC #Trading"

Market Landscape After the Fed Rate Cut !Gold Price Trend Analysis: Yesterday, gold opened higher and encountered resistance near 4219, then began to fluctuate downwards. During the European session, it fell to around 4187 before consolidating. Influenced by the Fed's interest rate decision, gold exhibited a pattern of rising first, then falling, and then rising again, reaching a low of around 4182 and a high of around 4239. The daily candlestick closed as a bullish candle. Logically, after this upward move, the subsequent target should be the 4255-4265 area. However, considering the current market trend, this tendency to rise more easily than fall is the most sustainable. We can actually see the upper limit, with the first high point at 4265, and at least for the current stage, we haven't reached the top yet.
Gold Technical Analysis: On the hourly chart, the moving averages are arranged in a bullish pattern, maintaining strong upward momentum. Technically, the bulls have broken through the neckline and are rising again. The price action shows a large bullish candle at the bottom, indicating strong upward momentum. The current high also coincides with the current cyclical pullback level, making a technical correction reasonable. Today, we expect the price to continue its upward trend after a pullback. Short-term support is around 4210-4200, a support/resistance level. Resistance is around 4255-4265. Avoid chasing highs, but the short-term bullish stance remains unchanged. Intraday trading should continue with a buy-on-dips strategy. In summary, today's gold trading strategy is to primarily buy on dips and secondarily sell on rallies. Key resistance is around 4255-4265, and key support is around 4210-4190. Please follow the trend closely.

#XAUUSD(GOLD):+1300 Pips Move Before Our Swing Sell Entry ActiveGold is likely to continue bullish move where we expect price to hit around 4380 area or 4400. This our intraday approach and before our sell entry get activated which will be our swing entry. There is only one target for this setup which is 4390$. You can adjust stop loss and take profit based on your own view.
If you like our work then do consider liking and commenting the idea.
Team Setupsfx_

Gold Holds Steady as Traders Position Ahead of Key Fed Outlook🔹 MARKET BRIEFING – XAU/USD (4H)
Market State:
– Price is holding above short-term support and consolidating sideways, with momentum still leaning toward the buyers.
Key Levels:
– Support: 4164
– Resistance: 4264
– Breakout Zone: 4300–4340
Next Move:
– Bullish momentum remains in control; a breakout above 4300 would open the path toward 4340 and 4380.

XAUUSD: Bearish Drop to 3885?OANDA:XAUUSD is eyeing a bearish reversal on the daily chart , with price testing resistance near ATH levels after recent rebounds from support, converging with cumulative sell liquidation and a potential entry zone that could spark downside momentum if sellers defend the highs. This setup suggests a pullback opportunity amid the ongoing uptrend, targeting lower support levels with strong risk-reward exceeding 1:3.
Entry between 4280–4340 for a short position (entry from current levels with proper risk management is recommended if price reaches the zone). Target at 3885 . Set a stop loss at a close above 4400 , yielding a risk-reward ratio of more than 1:3 . Monitor for confirmation via a bearish candle close below entry with rising volume, leveraging gold's volatility near peaks.🌟
Fundamentally , gold prices are hovering around $4,207–$4,222 per ounce as of December 3, 2025, after a 0.5% daily gain and a 7.37% rise over the past month, driven by safe-haven demand amid geopolitical tensions and expectations of Fed rate cuts. However, forecasts for 2025 suggest potential volatility with upside to new highs like $4,000+ in the longer term, though short-term corrections could emerge due to overbought conditions, central bank policies, and inflation dynamics. 💡
📝 Trade Setup
🎯 Entry (Short):
4280 – 4340
(Entry from current levels is valid if price reaches the zone with strict risk management.)
🎯 Target:
• 3885
❌ Stop Loss:
• Daily close above 4400
⚖️ Risk-to-Reward:
• >1:3 overall
💡 Your view?
Will gold reject this ATH resistance zone for a deeper correction — or break higher into new territory?
👇 Share your thoughts below! 👇

Gold Pullback or Reversal? Key Zone Decides the Next Move🔹 MARKET BRIEFING – XAU/USD (1H)
Market State:
– Price is pulling back after the recent bullish impulse and is hovering just above the minor support zone, suggesting a potential retracement setup before continuation.
Key Levels:
– Support / Entry Zone: 4204 – 4205
– Stop-Loss Zone: 4193 – 4194
– Take Profit 1: 4229
– Take Profit 2: 4247
Next Move:
– A clean retest of the 4204–4205 support zone may trigger another bullish leg toward 4229 → 4247, as long as price holds above the 4193–4194 rejection area.

XAU/USD Daily OutlookXAU/USD Daily Outlook – Key Levels 4219 and 4220 Remain the Market’s Pivot Zone
The current price action on XAU/USD continues to compress inside a wide-ranging consolidation box, with the 1H structure repeatedly reacting around the major resistance band at 4219–4220. This level has been tested multiple times, forming a clear horizontal ceiling where buyers consistently fail to maintain momentum.
Despite the rejection wicks, bullish pressure remains visible after price tapped the intraday support near 4208 and created a short-term higher low. This suggests that buyers may attempt another push toward the top of the range if 4219 is reclaimed.
Key Technical Structure
1. Major resistance zone
4219 – 4220 is acting as a multi-touch rejection level. Three previous highs (4220.828, 4220.286, 4220.015) confirm strong supply. Only a clear breakout with candle body close above 4220 would signal bullish continuation toward 4235–4250.
2. Support zone inside the range
4206 – 4208 is the nearest intraday support where buyers recently absorbed selling pressure. The market formed a reaction at 4219.473, indicating that bulls are not fully exhausted.
3. Trendline and Fibonacci reaction
Based on the most recent downswing, price is attempting to recover above the short-term trendline. The projected bullish path remains valid as long as price holds above the 4208–4210 zone. A Fibonacci retracement from the latest impulse aligns the 0.382–0.5 cluster near 4207, reinforcing this as a defensive area for buyers.
4. Market behavior
The repeated chop inside the range shows accumulation, and the dotted projection on the chart highlights a possible bullish staircase structure if price maintains a sequence of higher lows.
Important Levels to Watch
Resistance:
4220 – Key breakout level
4235 – First upside target
4250 – Upper extension of the range
Support:
4208 – Intraday reaction point
4198 – Mid-range support
4185 – Deeper liquidity zone
Trading Strategy Idea
Bullish Scenario (preferred if 4208 holds)
Wait for a clean retest of 4208–4210.
Potential upside targets: 4219 → 4235 → 4250.
A breakout above 4220 with strong volume would confirm continuation toward the top of the projection zone.
Bearish Scenario
If price fails to hold above 4208, downside liquidity may pull the market toward 4198 or even 4185. Only look for sells if the candle closes below the short-term trendline and structure breaks down
