XAU/USD BEARISH SETUP ON 4H CHART PATTERN ..The market is respecting a strong downtrend, with price continuously rejecting the descending trendline. After another rejection at the major resistance level, sellers pushed price back below the Ichimoku cloud, confirming bearish momentum.
Two downside zones are highlighted:
Target 1: First support area where price may pause or react
Target 2: Deeper support level aligned with previous structure and volume gaps
As long as price stays below the resistance zone and inside the bearish channel, the momentum favors continuation toward these targets.
Trade ideas

Could we see a breakout?Gold (XAU/USD) is reacting off the pivot which has been identified as a pullback support and a breakout of this level could lead the price to fall to the 1st support that aligns with the 61.8% Fibonacci retracement.
Pivot: 4,181.10
1st Support: 4,093.59
1st Resistance: 4,253.96
Disclaimer:
The opinions given above constitute general market commentary and do not constitute the opinion or advice of IC Markets or any form of personal or investment advice.
Any opinions, news, research, analyses, prices, other information, or links to third-party sites contained on this website are provided on an "as-is" basis, are intended to be informative only, and are not advice, a recommendation, research, a record of our trading prices, an offer of, or solicitation for, a transaction in any financial instrument and thus should not be treated as such. The information provided does not involve any specific investment objectives, financial situation, or needs of any specific person who may receive it. Please be aware that past performance is not a reliable indicator of future performance and/or results. Past performance or forward-looking scenarios based upon the reasonable beliefs of the third-party provider are not a guarantee of future performance. Actual results may differ materially from those anticipated in forward-looking or past performance statements. IC Markets makes no representation or warranty and assumes no liability as to the accuracy or completeness of the information provided, nor any loss arising from any investment based on a recommendation, forecast, or any information supplied by any third party

Gold (XAU/USD) – 2H Bullish SetupPrice has respected the rising channel and recently broke above the entry zone, signaling potential continuation toward the marked target.
Entry Zone: 4,215
Target: 4,251
Invalidation: 4,169
This analysis is based on trend structure and price action. For educational purposes only, not financial advice.
DISCLAIMER : THIS IS JUST FOR EDUCATIONAL PURPOSRE I AM NOT A FINANCIAL ADVISOR

XAUUSDThis chart and analysis are shared for educational purposes only.
Nothing here should be taken as financial advice.
Please conduct your own analysis before taking any buy or sell trades.

Gold Rockets Higher – Buy Momentum UnstoppableGold showed a sharp upside movement today from the strong intraday support area 4200/4186 and the market reached a high of 5258, which clearly indicates that buyers are in full control. Such a strong bullish breakout usually continues in the same direction.
The price is trading far above the support zone, confirming strong momentum. As long as the market holds above support the probability of further bullish continuation remains high.
KEY POINTS
Entry Level 4213
Support Area. 4200/4186
Target 1. 4230
Target 2. 4255

Gold Wave Analysis – 12 December 2025
- Gold reversed from strong resistance level 4350.00
- Likely to fall to support level 4200.00
Gold recently reversed from the resistance area between the strong resistance level 4350.00 (which stopped sharp wave (3) in October) and the upper daily Bollinger Band.
The downward reversal from this resistance area stopped the previous impulse waves iii and 3 of the intermediate impulse wave (5).
Given the strength of the resistance level 4350.00 and the overbought daily Stochastic, Gold can be expected to fall to the next support level 4200.00.

Gold? ContinuationThe plan
Incoming
www.tradingview.com
Hi,
Yest, heavy transacted 4202 range
Today price range 4216-4206 (Asia)
If this high range have got big interest. Good chance today. We'll have a rally ahead of FOMC.
If waiting for discount 4202 would be good.
Both ways.. buyside.
All the best
Not a guru

Xauusd buysBuys from OB and I'm targeting supply area
Sorry this is coming late. Manage risk if interested

GOLD-SELL strategy Monthly chart Reg. Channel - KCGOLD is very overdone, and I remain of the opinion that medium-term a large scale correction will take place. we are extr4enely high on RSI levels unseen ever, and secondly, way above KC channel and also Reg. Channel.
Strategy SELL between $ 4.000 - 4,375 and take profit near $ 3,250 first, and there after $ 2,875 for now.

Gold Forex Trading During Major Economic Events & News Releases
I guess you already noticed how impulsively the markets may react to economic events and news.
In this article, I will teach you a simple strategy to follow during important news release s and how to trade news.
1. Sort out the economic calendar
There are a lot of news in the economic calendar.
They are not equal in their impact.
Most of the economic calendars indicate the potential significance of each event: while some news have low importance, some have medium importance and some are considered to be extremely important.
For example, above is the list of coming UK fundamental news.
You can see that these news have different degree of importance.
My recommendation to you is to sort out the economic calendar in a way, so it would display only the most important news.
Among the news that we discussed above, only one release has high importance.
2. Know on what trading instruments does the news have an effect
While some of the news in the economic calendar may impact many financial markets and trading instruments, some news may affect very particular instruments.
For example, a FED Interest Rate decision may have a very broad effect on financial markets.
At the same time, Interest Rate Decision in Australia may affect only Australia - related instruments.
3. Don't trade one hour before the news and one hour after the release
Once you see the important fundamental news coming, don't trade the trading instruments that can be affected by the new s 1 hour before and after the release.
For example, in 5 minutes we are expecting important UK news - CPI data.
I stopped trading GBP pairs 1 hour before the release of the news, and will resume trading them one hour after the release.
4. Protect your trading positions 5 minutes ahead of the news
If you have an active trading position and related important news are expected, move your stop loss to entry 5 minutes ahead of the release of the news.
For example, I have a short trade on GBPAUD. I see that in 5 minutes important UK data is coming. I will move stop loss to entry 5 minutes ahead of the news and make a position risk-free.
I always say to my students, that news trading is very complicated. Due to a high volatility, it is very hard to make wise decision during the news releases.
The approach that I suggest will help you to avoid all that and trade the markets when they are calm.
❤️Please, support my work with like, thank you!❤️
I am part of Trade Nation's Influencer program and receive a monthly fee for using their TradingView charts in my analysis.

Gold trading plan!Sell Setup Active
Entry Level: 4200
Stop Level: 4210
Target Level: 4141
Strong selling pressure emerging from the upper zone — price may continue dropping toward the next support level as sellers take control! ⚡

GOLD – PREMIUM OUTLOOK | Tight Range Ahead of Crucial PCE DataGOLD – Technical Overview
Gold is trading in a narrow range around $4,200, maintaining sideways momentum ahead of key U.S. inflation data. The market continues to respect a bullish structure, supported by strong expectations of Federal Reserve easing.
The probability of a December Fed rate cut remains near 90% according to market pricing.
- U.S. employment data has been mixed:
- Jobless claims fell to their lowest level since September 2022
- Layoffs in November hit a two-year high
Today’s main focus is the PCE inflation index (delayed due to the government shutdown). Gold is likely to remain range-bound until the release, which may determine short-term direction ahead of the upcoming Fed meeting.
Technical Analysis
Gold maintains bullish momentum while above 4225, with price expected to move toward the 4255 resistance zone. A breakout above 4255 could extend the bullish structure toward 4300.
However, a correction becomes possible if price falls below 4225, with a retest of 4207 likely before determining the next move.
Key Levels
Pivot Line: 4225
Resistance: 4255 · 4300
Support: 4207 · 4187

Elise | XAUUSD 30m - Demand Flip Continuation SetupOANDA:XAUUSD
After extended range accumulation, XAUUSD broke structure to the upside with strong momentum. Current price is trading above the reclaimed zone, indicating bullish continuation potential, while approaching upper channel resistance.
Key Scenarios
✅ Bullish Case 🚀 → Hold above 4250–4245
🎯 4285 → 🎯 4300 → 🎯 4320
❌ Bearish Case 📉 → Loss of 4245 acceptance
🎯 4215 → 🎯 4185
Current Levels to Watch
Resistance 🔴: 4290 – 4320
Support 🟢: 4250 / 4215
⚠️ Disclaimer: For educational purposes only. Not financial advice.

XAUUSD: Inverse H&S Points Toward 4270 TargetHi!
Gold has formed a clear Inverse Head & Shoulders structure, signaling a potential bullish reversal. The support zone around the head held strongly, forming the left shoulder, head, and right shoulder in sequence. Price has now broken above the neckline, confirming the pattern and showing renewed bullish momentum.
If price retests the neckline successfully, it can provide a higher-probability long entry. A sustained hold above this level keeps the bullish structure intact, with the measured target projected near 4265–4270 USD.
However, if price dips deeper, the right scenario remains a potential bullish retest, as long as the structure stays above the neckline zone. Only a drop back below the head invalidates the pattern.
Overall, as long as buyers defend the neckline, the market maintains a bullish outlook toward the target zone.
Disclaimer: As part of ThinkMarkets’ Influencer Program, I am sponsored to share and publish their charts in my analysis.

GOLD SNIPER ENTRY.Hello my trader friends!
I’m back after just a few hours. Earlier today, I shared a gold analysis with you.
At first, I expected a bullish move after the break of the bearish trendline, followed by a price correction — and now I invite you to see the results of this beautiful and precise analysis.
This setup played out so clean and accurate that it left nothing more to say!
Our profits from this analysis:
✔️ Buy: +420 pips
✔️ Sell: +600 pips
Follow me for more accurate and profitable analyses.
🚀 GOLD SNIPER ENTRY — 420 BUY + 600 SELL DOMINATED!

Gold prices fell as expectedfollowing a continuous bearish trendAnalysis of the gold market trend: Gold has no fluctuations today. Gold has failed to rebound in the US market and is still under pressure at 4220. Gold fell as expected. The gold relay continued to win on Friday, and gold won 3 consecutive victories. The market is currently waiting for an interest rate cut. Before the interest rate cut, we will continue to focus on high altitudes. We have also made it clear that we are shorting near 4220, and the highest is near the 4219 line, which is basically consistent with our expectations. Let’s first look at the line near 4170-4160!
Gold Technical Analysis: Looking at the 1-hour chart, gold is still in a generally downward trend with weak rebounds. If the rebound in the US session continues to face pressure in the 4200-4220 area, shorting at higher levels is possible. With the Fed's interest rate decision approaching, gold is likely to remain range-bound. The hourly chart shows a sideways movement today, with signs of a breakout. A large bearish candlestick completely engulfed two bullish candlesticks, a bearish engulfing pattern. This is a time-for-space consolidation, and the short-term support around 4180 is unlikely to hold. Continue to watch for support around 4160-4150. In summary, today's trading strategy for gold is to primarily sell on rallies and secondarily buy on dips. The key resistance level to watch in the short term is around 4200-4220, and the key support level is around 4160-4150. Please follow the trend closely.

DXY, EURUSD, GBPUSD & XAUUSD Daily TradesetupsIn this update we review the recent price action in the Dollar Index, Euro, Cable & Gold and identify the next high probability tradng opportunties and price objectives to target. To review today's video analysis click here!

Gold prices fell as expected, a bearish outlook.Gold Price Trend Analysis: Gold traded in a range on the previous day, closing with a bearish candlestick with upper and lower shadows. Overall, gold continues to fluctuate without a clear directional trend. The market is awaiting the Fed's interest rate decision, and it seems we need to wait for the data to determine the direction. Yesterday's rebound encountered resistance near 4220 and fell as expected. Gold is currently maintaining a slightly weaker, range-bound trend on the daily chart. Short-term moving averages are starting to turn downwards, and the price center is gradually shifting lower, suggesting further downside potential. Short-term support is expected around 4165-4150.
Gold Technical Analysis: On the 4-hour chart, the price broke below the short-term support zone, and the candlestick pattern is gradually coming under pressure from the short-term moving averages, maintaining a slightly weak and volatile trend. In the short term, attention should be paid to a second downward move after a slight rebound. The 4-hour chart shows divergence, with the price falling back after failing to break through the 4220 level yesterday. Recently, it has been maintaining a range of 4170-4220, but the highs of this week's rebounds have been gradually decreasing, indicating that the bulls' upward momentum is weak, unlike the previous surge. Currently, it is still maintaining a volatile trend. On the hourly chart, after continuous fluctuations, the technical pattern shows signs of gradual repair. Short-term moving averages are starting to turn upwards, suggesting potential for a short-term rebound. Pay attention to the short-term rebound and repair. Currently, the support level for gold remains at 4165-4150, while the short-term resistance level is around 4210-4220. If it continues to be pressured in the 4210-4220 area, shorting on rallies is still an option. If support is found at 4165-4150, a short-term rebound is possible. In summary, today's trading strategy for gold is to primarily sell on rallies and secondarily buy on dips. The key short-term resistance level to watch is around 4210-4220, and the key short-term support level is around 4165-4150. Please follow the trend closely.

XAUUSD | Broke Symmetrical Triangle pattern --> Bullish BiasMacro:
- Gold prices advanced this week as renewed demand for hedges and expectations for Fed rate cuts offset still‑elevated US yields. Persistent geopolitical risks and concerns about the global growth outlook continued to underpin safe‑haven interest in gold.
- This week’s gains were supported by softer US data, including weaker private payroll indicators, which strengthened expectations that the Fed will deliver a rate cut at its upcoming meeting. These developments have weighed on the dollar at times, helping gold prices hold near recent highs, even as benchmark US Treasury yields hover around 4.10% rather than falling decisively. Structural drivers also remain in place, with investors and central banks maintaining exposure to gold as a hedge against policy missteps and inflation surprises.
- Gold prices may stay supported if upcoming US inflation data and Fed communication confirm a path toward easier policy and a softer dollar. Any downside surprise in inflation or a more dovish‑than‑expected Fed stance would likely reinforce that narrative. At the same time, a hawkish shift or stronger‑than‑expected data could prompt a temporary pullback. Gold may also react sharply to any escalation in geopolitical tensions or negative growth surprises that tighten financial conditions, as both factors tend to boost safe-haven demand and influence real-yield expectations.
Technical:
- XAUUSD broke the Symmetrical Triangle pattern and rose toward the resistance at 4245 before consolidating within a tight range of 4200-4245. The price is above EMA21, indicating an upward momentum remains.
- If XAUUSD breaches above 4245, the price may surge and retest the ATH area at around 4365.
- Conversely, closing below 4200 may prompt a further correction toward EMA21 area.
Analysis by: Dat Tong, Senior Financial Markets Strategist at Exness

Is GOLD Ready for a Bullish Push?Hello traders!
I'm back with a fresh analysis on GOLD. The metal is breaking its bearish trendline and I’m expecting a bullish move toward the marked zone, followed by a potential correction.
What’s your outlook? I’d love to hear your thoughts!"

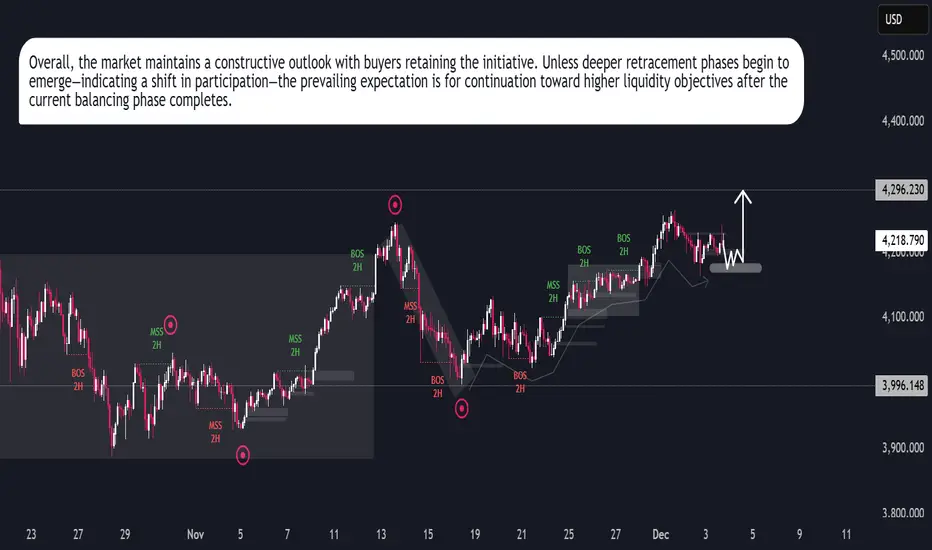
Gold Market Flow Points Toward Higher LevelsGold Market Flow Points Toward Higher Levels
Gold continues to display a controlled upward trajectory characterized by steady accumulation and orderly price expansion. The recent sessions show a consistent pattern of demand absorption, where each corrective phase is met with renewed buyer engagement, preventing deeper retracements. This suggests that the market remains comfortably positioned within a bullish environment, supported by ongoing interest from medium-term participants.
Price flow has transitioned away from the aggressive liquidation seen earlier in the month and is now driven by a more balanced rotation between buyers and short-term profit-takers. Despite this rotation, the dominant pressure remains upward, as visible through the repeated failure of sellers to extend declines. Momentum flows indicate that buyers are gradually reclaiming lost ground after every corrective cycle, signaling stable confidence in higher valuations.
Market behavior also reflects a pattern where liquidity beneath short-term swing points is routinely harvested before upward expansion resumes. This action shows that deeper market participants continue to optimize entry points by collecting orders during brief moments of weakness. Once these orders are filled, price rapidly rotates back upward, revealing that underlying demand remains unshaken.
Current positioning suggests that Gold is in a preparation phase for another expansion leg. Price is stabilizing in a compression zone where volatility temporarily narrows before a directional drive. Historically, such compression within an established upward environment often precedes continuation, especially when buyers demonstrate willingness to defend even shallow pullbacks.
GOLD: Breakout Structure Points to New High TargetsGOLD: Breakout Structure Points to New High Targets
Gold continues to push higher after breaking out of the consolidation triangle. Price retested the breakout zone and is now trading above 4230, holding firmly above the key structure.
The chances are higher that gold may continue to rise further. The bullish movement began on Thursday without any notable news, and I do not expect anything significant to further drive it up.
For now gold remains only bullish. A possible correction may happen before it moves more.
Key Levels:
• 4150
• 4230
• 4290
• 4360
As long as price holds above 42.., buyers remain in control. A pullback into the support zone could provide continuation toward 4290, and a stronger breakout opens the path to 4360.
You may find more details in the chart!
Thank you and Good Luck!
❤️PS: Please support with a like or comment if you find this analysis useful for your trading day❤️
Previous analysis:
Previous analysis:

GOLD → Retest of consolidation support on uptrend FX:XAUUSD is trading in a sideways range around $4,200, awaiting new labor market data to determine the Fed's policy trajectory after December's rate cut.
Weak US data (a 32K decline in ADP employment and a slight increase in ISM services to 52.6) did not change market expectations. The probability of a 25 bp Fed rate cut on December 11 is around 90%. Attention has shifted to the trajectory of policy easing in early 2026. Key factors will be data on unemployment claims and sentiment on Wall Street.
The fundamental background is relatively positive, and the dollar has entered a correction phase due to expectations of lower rates, which may support the gold price...
Resistance levels: 4238, 4262
Support levels: 4185, 4175
Gold is testing the support levels of the key trading range. If the bulls keep the price above 4185 and form a bullish reversal pattern, then in the short and medium term, we can expect growth to intermediate highs.
Best regards, R. Linda!
