XAUUSD 4HR TECHNICAL ANALYSIS
🟡 XAU/USD (Gold) 4H Technical Analysis
1. Overall Market Structure
• The Elliott Wave count suggests the market is in wave (4) corrective phase, with a potential start of Wave (5) impulse upward.
• Price is still within a larger ascending channel, meaning the broader trend remains bullish.
2. Key Levels
• Immediate Support:
• Around 3,735 (current price) – coincides with FVG/OB zone.
• 3,707 – near your stop loss and aligns with previous structure lows.
• 3,628 – strong demand zone (would invalidate the bullish setup if price breaks this level).
• Immediate Resistance:
• 3,745 – 3,751 (local high zone & OR level)
• 3,775 – 3,791 (previous swing high and potential Wave (5) target)
3. Wave Count & Projection
• If Wave (4) is complete at the OB/FVG zone, Wave (5) could target:
• Minimum: Equal length to Wave (1) projected from Wave (4) bottom → ~3,775
• Extended Target: 1.618 Fibonacci extension of Wave (1) → could push toward 3,790–3,800
4. Trade Setup Evaluation
• Risk/Reward Ratio:
• Entry ~3,735, Stop ~3,707 → Risk ≈ $28
• Target ~3,775+ → Reward ≈ $40+
• Risk-to-Reward Ratio ≈ 1.4:1 (decent but could be improved with a higher target at 3,790).
• Bullish Case:
• Price holds above 3,735 (OB/FVG zone) and starts forming higher lows → good confirmation for Wave (5) rally.
• Bearish Risk:
• Break below 3,707 would likely mean Wave (4) is extending deeper, potentially retesting 3,675 or even the strong demand zone at 3,628.
5. Confluence & Momentum
• Confluence:
• OB + FVG zone at current price = strong support
• Channel lower bound nearby = good risk-defined long setup
• Momentum:
• Watch for bullish divergence or strong reversal candles (hammer, engulfing) on 4H/1H timeframe to confirm entry.
📌 Summary
• Bias: Bullish as long as price holds above 3,707
• Wave (5) Target: 3,775 – 3,790
• Invalidation: Break below 3,707 → next major support 3,675 / 3,628
• Trade Setup: Attractive risk/reward if entered near OB/FVG with target above 3,775
GOLDMINICFD trade ideas

GOLD THE STRUCTURE of market always give us clue on potential up or down swing.
the daily chart i posted for free yesterday ,i told everyone gold is facing a daily supply roof and it will sell today and at 3780-3779 we saw the rejection .
my new goal is to see gold price below 3700 mark, now its defended at 3725 zone to retest a broken demand floor and will continue to sell ,the strategy is simple .
DXY AND US10Y BULLISH FOR NOW ,A BEARISH CORREECTION FOR GOLD .
i will update soon on all price movement

This Strategy / Plan Helped Me Double My AccountIn this video I explain how support & resistance & one session can help you manage your trading account

XAU/USD LONG IDEAAs a called as THE BıG LONG on XAUUSD will be holding my position till 4200. levels we still got time to reach that target but well patience will pay off.

XAU/USD 24 September 2025 Intraday AnalysisH4 Analysis:
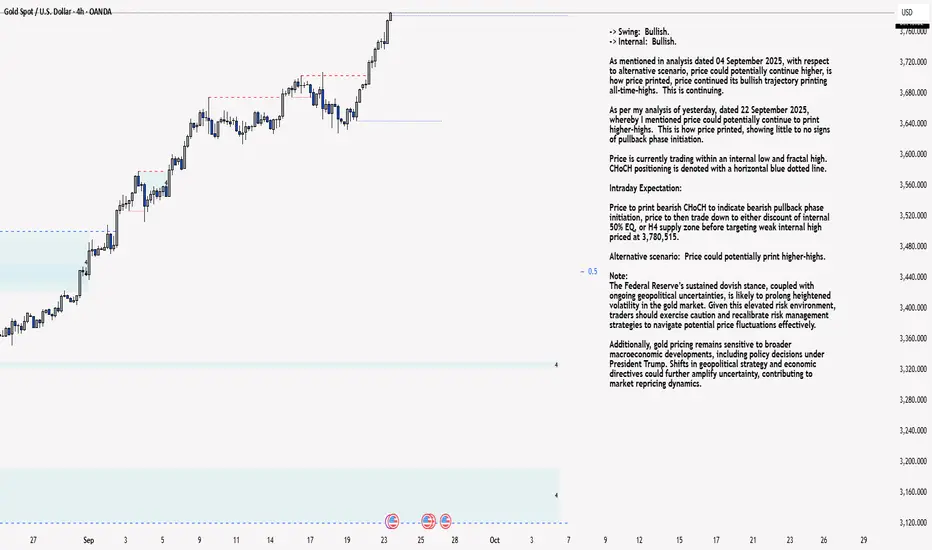
-> Swing: Bullish.
-> Internal: Bullish.
As mentioned in analysis dated 04 September 2025, with respect to alternative scenario, price could potentially continue higher, is how price printed, price continued its bullish trajectory printing all-time-highs. This is continuing.
As per my analysis of yesterday, dated 22 September 2025, whereby I mentioned price could potentially continue to print higher-highs. This is how price printed, showing little to no signs of pullback phase initiation.
Price is currently trading within an internal low and fractal high. CHoCH positioning is denoted with a horizontal blue dotted line.
Intraday Expectation:
Price to print bearish CHoCH to indicate bearish pullback phase initiation, price to then trade down to either discount of internal 50% EQ, or H4 supply zone before targeting weak internal high priced at 3,791,255.
Alternative scenario: Price could potentially print higher-highs.
Note:
The Federal Reserve’s sustained dovish stance, coupled with ongoing geopolitical uncertainties, is likely to prolong heightened volatility in the gold market. Given this elevated risk environment, traders should exercise caution and recalibrate risk management strategies to navigate potential price fluctuations effectively.
Additionally, gold pricing remains sensitive to broader macroeconomic developments, including policy decisions under President Trump. Shifts in geopolitical strategy and economic directives could further amplify uncertainty, contributing to market repricing dynamics.
H4 Chart:
M15 Chart:
-> Swing: Bullish.
-> Internal: Bullish.
As per analysis and intraday expectation of yesterday's analysis, price has printed a bearish CHoCH, which is the first indication, but not confirmation, of bearish pullback phase initiation
Price is currently trading within an internal low and internal high.
Intraday Expectation:
Price to trade down to either M15 supply zone, or discount of 50% EQ before targeting weak internal high priced at 3,791.255.
Alternative Scenario: Price could potentially continue to print higher.
Note:
Gold remains highly volatile amid the Federal Reserve's continued dovish stance, persistent and escalating geopolitical uncertainties. Traders should implement robust risk management strategies and remain vigilant, as price swings may become more pronounced in this elevated volatility environment.
Additionally, President Trump’s recent tariff announcements are expected to further amplify market turbulence, potentially triggering sharp price fluctuations and whipsaws.
M15 Chart:


XAU/USD 23 September 2025 Intraday AnalysisH4 Analysis:
-> Swing: Bullish.
-> Internal: Bullish.
As mentioned in analysis dated 04 September 2025, with respect to alternative scenario, price could potentially continue higher, is how price printed, price continued its bullish trajectory printing all-time-highs. This is continuing.
As per my analysis of yesterday, dated 22 September 2025, whereby I mentioned price could potentially continue to print higher-highs. This is how price printed, showing little to no signs of pullback phase initiation.
Price is currently trading within an internal low and fractal high. CHoCH positioning is denoted with a horizontal blue dotted line.
Intraday Expectation:
Price to print bearish CHoCH to indicate bearish pullback phase initiation, price to then trade down to either discount of internal 50% EQ, or H4 supply zone before targeting weak internal high priced at 3,780,515.
Alternative scenario: Price could potentially print higher-highs.
Note:
The Federal Reserve’s sustained dovish stance, coupled with ongoing geopolitical uncertainties, is likely to prolong heightened volatility in the gold market. Given this elevated risk environment, traders should exercise caution and recalibrate risk management strategies to navigate potential price fluctuations effectively.
Additionally, gold pricing remains sensitive to broader macroeconomic developments, including policy decisions under President Trump. Shifts in geopolitical strategy and economic directives could further amplify uncertainty, contributing to market repricing dynamics.
H4 Chart:
M15 Analysis:
-> Swing: Bullish.
-> Internal: Bullish.
Price has continued with its bullish trajectory, printing all-time-highs.
Although price has printed a number of bearish CHoCH's, I will apply discretion and not classify them as such due to the insignificance of the pullback relative to recent price action.
Price is currently trading within an internal low and fractal high. CHoCH positioning is denoted with a blue horizontal dotted line.
Intraday Expectation:
Await for price to print bearish CHoCH, which is the first indication, but not confirmation of bearish pullback phase initiation.
Note:
Gold remains highly volatile amid the Federal Reserve's continued dovish stance, persistent and escalating geopolitical uncertainties. Traders should implement robust risk management strategies and remain vigilant, as price swings may become more pronounced in this elevated volatility environment.
Additionally, President Trump’s recent tariff announcements are expected to further amplify market turbulence, potentially triggering sharp price fluctuations and whipsaws.
M15 Chart:
XAU/USD Intraday Plan | Support & Resistance to WatchGold continues its strong rally, now trading around $3,755 after breaking out of the ascending channel. To sustain momentum, we need to see a confirmed hold above $3,753, which would open the way toward higher resistance levels.
Failure to confirm this breakout could trigger a temporary pullback into lower support zones, with a potential retest of the 50MA if bears take short-term control. The higher price extends, the greater the risk of sharp swings and volatility spikes.
📌 Key Levels to Watch
Resistance:
$3,768
$3,782
Support:
$3,753
$3,728
$3,712 (MA50 retest zone)
🔎 Fundamental Focus – Tue, Sep 23
Key drivers today: US PMIs, Trump remarks + Richmond Index, and the main event — Powell speech.
Gold’s rally is extended, so expect headline-driven swings and possible volatility spikes around these releases.

Can you imagine a price of $3,720 per ounce?The trend that has been in place since 2002 is still very strong and the nearest price target is in the $3,725 per ounce range! We must wait for the driving forces to reach this price range to do their job!


Gold: One of the easiest longs in historyStop hunt of the leading candle, enter long and hold to ATH.
Rinse and repeat. Sometimes the long winded stuff loses the value of how simple it can be 💎
Buy zones for XAUUSDThe chart says it all. There are two possible entries you just need to drop on lower TF to get proper entry. There is a possible entry on the demand zone. However, there is too much liquidity below that zone, therefore the market might want to take those stop losses before continuing up on its bullish momentum

Gold Market Weekly ReviewGold Market Weekly Review: Gold Prices Rebounded After the Fed's Rate Cut, Remaining Resilient in the Short Term
Market Review
During the U.S. trading session on Friday (September 19), spot gold rebounded from its lows, ending a two-day losing streak and closing up approximately 1.12% at $3,685/oz. The U.S. dollar index stabilized and rebounded from its low of 96.22, its lowest point since February 2022, and is currently trading around 97.62, near a five-day high.
The Federal Reserve announced a 25 basis point interest rate cut on Wednesday, lowering the target range for the federal funds rate to 4.00%–4.25%, in line with market expectations. Following the announcement, gold prices briefly surged to $3,707/oz, a record high. However, gains subsequently narrowed due to a less-than-expected dovish tone from Fed Chairman Powell, which triggered a rebound in the dollar and U.S. Treasury yields.
Policy Expectations and Market Interpretation
According to the CME FedWatch tool, the market is pricing in a 91% probability of another 25 basis point rate cut in October and an approximately 80% probability of a further rate cut in December, consistent with the Fed's dot plot's guidance for another 50 basis point rate cut this year. Powell emphasized that this rate cut is a "risk management" measure aimed at addressing economic uncertainty, and noted that policy does not have a pre-set path and future decisions will be data-driven.
Although a stronger dollar and high US Treasury yields are suppressing gold prices, market expectations of further Fed rate cuts continue to support gold, limiting its downside.
Technical Analysis
Gold's daily chart turned positive after a series of pullbacks, indicating a high-level consolidation pattern. Key resistance currently lies at $3,707, while support lies at $3,613. Caution is advised within this wide range. The weekly chart has deviated from its short-term moving average, requiring time for consolidation, but the broader trend remains supported by fundamentals.
The 1-hour chart shows that gold has broken through its short-term downtrend line, re-establishing a relatively strong trend. $3,660 has transformed from a previous resistance level into support, becoming a key dividing line between bulls and bears in the near term.
Market Outlook
Gold is expected to maintain a volatile, but slightly stronger trend in the short term. We recommend primarily buying on pullbacks, while attempting to short with a small position if a rebound encounters resistance. Upward resistance is expected to be in the $3,702–$3,707 range, while downward support is expected to be in the $3,660–$3,665 range.
Risk Warning
Closely monitor speeches by Federal Reserve officials and economic data releases. Any changes to expectations of rate cuts could trigger significant fluctuations in gold prices.

Gold correction modeAs we can see in 4H chart gold already made a bullish flag and broken out thursday evening and closing was also good i.e 3644 which made 8H,4H, even daily CISD confirm so according to me this can be the next move for gold for friday but 3600-3650 is consolidation area for gold so it can be here for next 2-3 days.
Current gold price fluctuation range: 3620-3675Current gold price fluctuation range: 3620-3675
As shown in Figure 2h:
Gold prices will continue to fluctuate downward.
Correction range: 3620-3660-3675
Current two key resistance areas: 3650/3675
Current two key support areas: 3620/3635
Therefore, the next trading strategy is very clear:
1: As long as the gold price is above 3620, the strategy is to go long at a low price. Stop-loss: below 3620.
2: As long as the gold price is below 3670, the strategy is to go short at a high price. Stop-loss: above 3670.
3:
Optimal buying range: 3620-3630
Optimal selling range: 3660-3670
4: This week, we are more inclined to see a volatile downward correction. The possibility of breaking new highs is low.
In summary: Shorting at high prices is currently the safest intraday trading option.

DeGRAM | GOLD rebound in the ascending channel📊 Technical Analysis
● XAU/USD rebounded sharply from the ascending channel’s lower boundary near 3,640, confirming active demand.
● Price is now targeting 3,685 resistance; a breakout above could extend momentum toward 3,700.
💡 Fundamental Analysis
● Softer U.S. yields and weaker dollar momentum support gold’s short-term bullish outlook despite Fed’s cautious stance.
✨ Summary
Gold bullish above 3,654; near-term targets 3,685 and 3,700. Key support remains at 3,654.
-------------------
Share your opinion in the comments and support the idea with a like. Thanks for your support!

FOMC GOLD UPDATE !Gold Structure Buying In H1
Buy From FVG
Buy From Order Block
Buy From Breaker Block
Buy From MSS FVG
Follow Us For More Trades

Gold Not Bottomed Yet:Selling Rallies Remains Key After a deep V-shaped rebound to near 3673, gold fell sharply again, hitting a new low near 3627. Clearly, after the rate cut, most investors took profits, driving gold prices down. As gold's center of gravity shifts downward, the current short-term resistance area has shifted to 3660-3670.
From the current structural perspective, gold is shifting from strength to weakness, with bears gradually recovering and taking control. Following the sharp rally, there is also a need for a technical pullback. While gold has rebounded slightly, there are no clear bottoming signals. I believe gold has not yet reached a low and is likely to continue to test the 3625-3615 area. If this area is broken, it will open up further downside potential, potentially extending the downward trend to around 3580.

XAU/USD 25 September 2025 Intraday AnalysisH4 Analysis:
-> Swing: Bullish.
-> Internal: Bullish.
Analysis and bias remains the same as yesterday's analysis dated 24 September 2025.
As mentioned in analysis dated 04 September 2025, with respect to alternative scenario, price could potentially continue higher, is how price printed, price continued its bullish trajectory printing all-time-highs. This is continuing.
As per my analysis of yesterday, dated 22 September 2025, whereby I mentioned price could potentially continue to print higher-highs. This is how price printed, showing little to no signs of pullback phase initiation.
Price is currently trading within an internal low and fractal high. CHoCH positioning is denoted with a horizontal blue dotted line.
Intraday Expectation:
Price to print bearish CHoCH to indicate bearish pullback phase initiation, price to then trade down to either discount of internal 50% EQ, or H4 supply zone before targeting weak internal high priced at 3,791,255.
Alternative scenario: Price could potentially print higher-highs.
Note:
The Federal Reserve’s sustained dovish stance, coupled with ongoing geopolitical uncertainties, is likely to prolong heightened volatility in the gold market. Given this elevated risk environment, traders should exercise caution and recalibrate risk management strategies to navigate potential price fluctuations effectively.
Additionally, gold pricing remains sensitive to broader macroeconomic developments, including policy decisions under President Trump. Shifts in geopolitical strategy and economic directives could further amplify uncertainty, contributing to market repricing dynamics.
H4 Chart:
M15 Analysis:
-> Swing: Bullish.
-> Internal: Bullish.
Analysis and bias remains the same as yesterday's analysis dated 24 September 2025.
As per analysis and intraday expectation of previous analysis, price has printed a bearish CHoCH, which is the first indication, but not confirmation, of bearish pullback phase initiation
Price is currently trading within an internal low and internal high.
Intraday Expectation:
Price to trade down to either M15 supply zone, or discount of 50% EQ before targeting weak internal high priced at 3,791.255.
Alternative Scenario: Price could potentially continue to print higher.
Note:
Gold remains highly volatile amid the Federal Reserve's continued dovish stance, persistent and escalating geopolitical uncertainties. Traders should implement robust risk management strategies and remain vigilant, as price swings may become more pronounced in this elevated volatility environment.
Additionally, President Trump’s recent tariff announcements are expected to further amplify market turbulence, potentially triggering sharp price fluctuations and whipsaws.
M15 Chart :

GOLD: 8.000Hi guys, in this chart I don't show lines, arrows, channels, no TA at all.
This is my thought, my vision on the global market need to push gold very high to let the next collapse happen.
This is not either 2000 and 2008, maybe this is worst or just similar, who knows.
One thing I'm following is that this collapse could be hidden, and gold at this price is now more than a confirmed point.

Gold Volatile After Fed, Rebounds to 3670📊 Market Developments:
• After the Fed’s 25 bps rate cut, gold surged sharply and hit a new all-time high at 3707.
• Strong profit-taking and a temporary USD rebound then dragged gold down to 3633 in the Asian session this morning.
• Currently, gold has rebounded to around 3670, showing buying demand returning after the sharp pullback.
📉 Technical Analysis:
• Key Resistance: $3700 – $3707 (new peak).
• Nearest Support: $3630 – $3635 (successfully tested this morning).
• EMA09 (H1): Price just bounced back above the short-term EMA, indicating a short-term recovery trend.
• Candlestick / Momentum: H1 candles printed a long lower wick around 3633 → signal of bottom-fishing demand. Momentum is recovering but resistance at 3700 remains tough, suggesting further choppiness ahead.
📌 Outlook:
Gold is in a highly volatile state following the Fed decision. Holding above 3660–3670 could trigger another test of the 3700–3707 resistance area. Conversely, a break below 3660 may drag gold back to retest 3630.
💡 Suggested Trading Strategy:
• SELL XAU/USD : $3702 – $3705
🎯 TP: 40 / 80 / 200 pips
❌ SL: $3708
• BUY XAU/USD: $3635 – $3638
🎯 TP: 40 / 80 / 200 pips
❌ SL: $3632
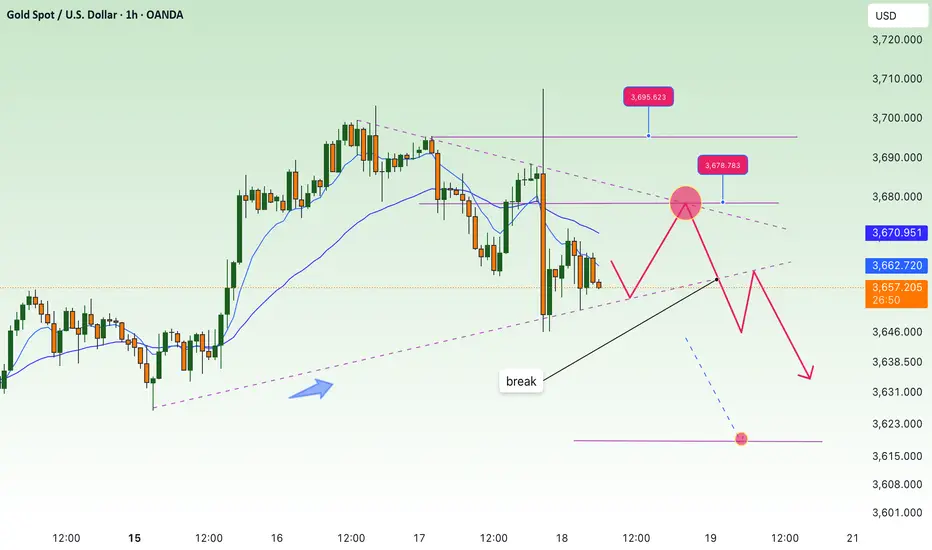
start to correct down, back to 3618⭐️GOLDEN INFORMATION:
Gold (XAU/USD) consolidates after retreating from record highs above $3,700, reached following the Fed’s dovish rate cut. The central bank signaled two more reductions this year, keeping bullion supported in Thursday’s Asian session. Heightened geopolitical risks from the Russia-Ukraine war and Middle East tensions further underpin safe-haven demand.
At his press conference, Fed Chair Jerome Powell framed the move as a “risk management cut” and downplayed urgency for aggressive easing. This helped the US Dollar (USD) extend its rebound from multi-year lows, capping gold’s upside. Still, the broader backdrop favors bulls, with any dips likely to attract fresh buying
⭐️Personal comments NOVA:
The market started to correct down after reaching ATH 3707, the interest rate reduction result was as expected. Pressure to close profits this week
⭐️SET UP GOLD PRICE:
🔥SELL GOLD zone: 3678- 3680 SL 3685
TP1: $3670
TP2: $3660
TP3: $3650
🔥BUY GOLD zone: $3618-$3620 SL $3613
TP1: $3630
TP2: $3640
TP3: $3655
⭐️Technical analysis:
Based on technical indicators EMA 34, EMA89 and support resistance areas to set up a reasonable SELL order.
⭐️NOTE:
Note: Nova wishes traders to manage their capital well
- take the number of lots that match your capital
- Takeprofit equal to 4-6% of capital account
- Stoplose equal to 2-3% of capital account
GOLD NEXT MOVE 3500 or 3700 ?Gold Have A Resistance And Support
Support 3656 / 3653
If Gold Break The 3653 Then Next Target 3500
Resistance 3671 / 3669
If Gold Break 3671 Next Target 3700
Follow Us For More Trades
