Gold Performance Recap for the week📝This week, the price of Gold first rose and then fell. The specific trend is as follows:
Monday: Gold broke through the 4059 mark in the Asian trading session, setting a new historical record
Tuesday- Wednesday: The price continued to rise.
Thursday: Gold reached a maximum of 4298.64.
Friday: First, the price surged after the opening, reaching a high of 4379.44, followed by a sharp decline, touching a low of 4186.17. As of now, the price of Gold is 4247.02, continuing to fall compared to the previous day's closing price.
💎The driving factors are as follows:
💡Upward factors in the early stage
1-Impact of Federal Reserve's loose policy expectations: The Federal Reserve launched a new round of interest - rate - cutting cycle in September. The market anticipates that there may be two consecutive interest - rate cuts in October and December. The expected decline in both nominal and real interest rates has increased the attractiveness of holding non - interest - bearing assets such as gold.
2-Surge in geopolitical risks and safe - haven demand: Factors such as the escalation of the China-US trade war and the US's containment of China's chip sector have intensified market panic, and funds have accelerated their inflow into gold as a safe haven.
3-Drive from global central banks’ gold purchase demand: According to data from the World Gold Council, global central banks’ gold reserves increased by 166 tons in the second quarter of 2025. The People’s Bank of China has increased its gold holdings for 11 consecutive months, which has strengthened market confidence in gold.
💡Downward factors in the later stage:
1-Technical level: The 4280 - 4330 area is a key monthly - level resistance zone. On Friday, Gold broke through the important support level of 4280, triggering a large number of stop-loss orders for long positions. Program based trading triggered SL selling, forming a vicious cycle of "breakdown - SL - further decline".
2-Change in risk appetite: On Friday, US President Trump made moderate remarks on trade issues. Market safe-haven sentiment cooled rapidly, leading to a sharp sell-off of gold.
Trade ideas

SMART MONEY CONCEPT (SMC)🚀 Technical Analysis – XAU/USD (15m, SMC)
The market swept sell-side liquidity 💧, triggering SL before showing a potential Change of Character (ChoCh) 🔄.
The key area is the 1H Order Block (4,052) 📍, where we expect a rejection ✅ after the fake out.
✨ Setup:
• 📌 Entry: 4,052
• 🛑 SL: 3,984
• 🎯 TP: 4,270
• 📈 R/R: 1:3
💡 This move follows the institutional narrative: Accumulation → Fake Out → Mitigation → Bullish Distribution.
🔥 Motivational message:
“Remember trader: institutions hunt liquidity before revealing the true move. Stay patient, trust your setup, and let the market work for you.
GOOD LUCK TRADERS… 🔥 🙌

Gold - Possible intermediate topAfter the multi week rally we are heading into the DCL.
The first stop during this drop will be the tag of the 200 EMA on the hourly at 4129$.
Daily chart will be posted after after the close.

XAUUSD - Long Term Bullish trend's Target has been achieved ?It so interesting to watch weekly candle time frames. As we could see that long term bullish trend has been started since 2015.
It took 10 years until 2025.
And as we can see at fibo extention, it has touch level 3 ( around 4300 level ).
And we knew that last Friday price has been rejected at 4380 level.
It's a hard rejection as price drop almost 2000 pips.
Let see for a further movement as a bearish sign has been appeared.
Have a blessing week a head !

Gold price correction is within expectations, waiting for layout
News:
When it comes to long-term gold trading, attempting to find a "perfect low" is often unrealistic. While Friday's drop of nearly $200 in gold may seem dramatic, it's only half of last week's gains, making the correction still within reasonable bounds. After hitting 4186, prices quickly stabilized and rebounded to 4247, forming a typical bottoming-out pattern. This level is the 0.5 retracement support level of this week's upward trend.
Specifically:
Opportunities often lurk amidst sharp declines. After Friday's pullback to key support, bullish sentiment has stabilized. We maintain a bullish outlook for the start of the week and recommend placing long positions in batches above Friday's low.
Based on recent trends, the market is expected to trade sideways and rise slowly at the beginning of the week, with a focus on the 4220-4210 support zone. If the Asian session can break through and hold the 4275-4285 pressure zone, then you can follow up with long orders in the European and American sessions; if it maintains volatility, then wait patiently for opportunities to accumulate at low levels and stick to the long strategy on pullbacks.
Trading strategy:
Buy: 4225-4220, SL: 4210, TP: 4275-4300

Gold Intraday Trading Plan 10/21/2025Yesterday gold found support around 4220 and rose by more than 1600 pips to reach previous ATH around 4380. This is crazy, one single day of 1.6k pips difference. As forecasted in my weekly post, I did mention that I see the upside in the initial stage of the week.
Currently gold is at the resistance and if this holds, we could see it drop to 4280. If 4380 resistance is broken, gold could rise to 4425 and even 4481. Otherwise, we could see price actions when it reach 4280.

Gold Price Outlook | Buyers Stay in Full ControlGold remains firmly positioned within its broader bullish trajectory, supported by consistent demand from both institutional and retail investors. The market has shown strong resilience, forming a well-defined higher-low structure, which reflects continued accumulation. Price action indicates that buyers are confidently stepping in after each controlled pullback, maintaining upward momentum.
The current market tone favors continuation toward the 4,180–4,250 range if momentum persists. Short-term retracements into the 4,070–4,090 area may offer new buying opportunities for position traders aligning with the prevailing trend. Macroeconomic factors such as ongoing inflation concerns, geopolitical instability, and cautious monetary policy stance continue to underpin gold’s strength.

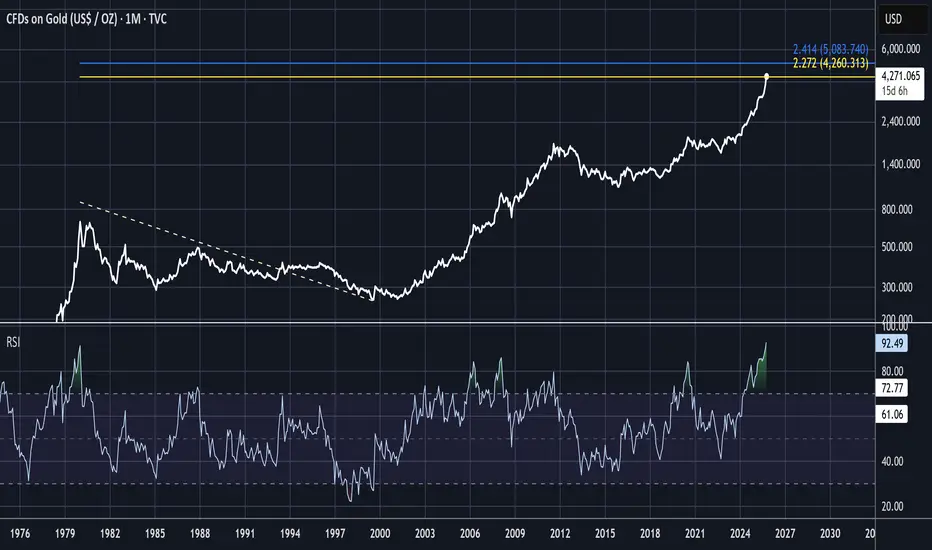
GOLD - Signals That Gold is On The MoonGOLD
Is now hitting the ultra long term 2.272 taking the pivots from the 1980 bear market.
Long term does not mean high accuracy expected and it may well have a loose relationship with the eventual top.
But its another signal that GOLD is very high.
In addition, the month RSI is suddenly as high as its ever been since 1980.
Soooo, its time for a cautious trader to take profit.
This analysis is shared for educational purposes only and does not constitute financial advice. Please conduct your own research and consider that crypto is a dangerous market.
4365 Achieved Excellent profits Booked [1350 PIPS Gained]Thanks to traders who followed and stay Active with me on bullish rally
As highlighted in yesterday’s session update:
My Position:
The ongoing bull rally has played out perfectly, with both of my targets achieved ahead of schedule. I identified strong support around $4,220 & 4190 along condition H4 Candle for bullish rally. Iinitiated aggressive swing buys from that zone. When $4,190 was retested, I held off for a healthy pullback before re-entering.
At $4205& $4,225, I scaled in aggressively (four entries) aiming for $4,345, which was reached — locking in solid overnight gains.
I’m pleased with the overall performance during this multi-month bullish phase and plan to keep accumulating on dips until the $4,490 level is reached from my main re-entry zones.
Additional Tip:
Once again, I caution traders — avoid counter-trend selling.
Many get trapped trying to short Gold in a strong uptrend. Stay aligned with the trend — it’s still firmly bullish.🚀

Lingrid | GOLD Consolidation - Breakout - Momentum TradeThe price perfectly fulfilled my previous idea . OANDA:XAUUSD recently made new all-time high inside a steep upward channel, maintaining strong bullish momentum. The structure suggests a healthy correction phase forming a short-term range above the 4,280 support zone. As long as the price remains above the upward trendline, the bullish structure remains intact with potential continuation toward 4,450 and higher. The ongoing range formation may serve as consolidation before the next impulsive breakout higher.
⚠️ Risks:
A sustained break below 4,280 could trigger a deeper correction.
Rising U.S. yields or hawkish Fed comments may weigh on gold prices.
Reduced geopolitical tension could cool safe-haven demand.
If this idea resonates with you or you have your own opinion, traders, hit the comments. I’m excited to read your thoughts!

XAUUSD on verge[ will again buy] Targeting $5500XAUUSD holding the trendline on D1& H4 from 4270- 4245 zone after the implusive drop. Market is drop after rejecting from Double Top ATH.
What are my conditions For Today's session?
Currently i took buy trade from 4265 zone as bait ,I'm expecting H4 and H1 Candle closing will be above 4270 and on retest then market will left again.
✳️Secondly my last buying area will be around 4245-4250 if H4 remains above trendline on that time.
Targets: 4310- 4345-4370
Additional Tip:
Keep in mind H4 closed below 4245 then stay away from Buy AND Keep watching drop towards 4080 in extension
I will buy in Dips and my Ultimate next target on long run is 5500.

Gold at a vertical angle and requiring the passage of timeWhat is not known about the trend that has been developing since the early 1970s is a transition from the upward swings!
What is more striking is the speed with which these swings have occurred!
Good luck!

Maintain gold buying pressure above 4400⭐️GOLDEN INFORMATION:
Gold (XAU/USD) rebounds toward record highs after an earlier dip to the $4,280 zone, poised to close its ninth straight week in positive territory. Persistent geopolitical risks, renewed US-China trade tensions, and the prolonged US government shutdown keep investors cautious, driving safe-haven demand. Meanwhile, dovish Federal Reserve expectations—with markets pricing in two more rate cuts this year—continue to weigh on the US Dollar and bolster the yellow metal. Despite overbought conditions, steady dip-buying suggests the path of least resistance for Gold remains to the upside.
⭐️Personal comments NOVA:
Gold price has almost no significant selling pressure, huge fomo market for strong uptrend above 4400
⭐️SET UP GOLD PRICE:
🔥SELL GOLD zone: 4436 - 4438 SL 4443
TP1: $4425
TP2: $4412
TP3: $4400
🔥BUY GOLD zone: $4278-$4276 SL $4271
TP1: $4285
TP2: $4298
TP3: $4310
⭐️Technical analysis:
Based on technical indicators EMA 34, EMA89 and support resistance areas to set up a reasonable BUY order.
⭐️NOTE:
Note: Nova wishes traders to manage their capital well
- take the number of lots that match your capital
- Takeprofit equal to 4-6% of capital account
- Stoplose equal to 2-3% of capital account

Gold’s Final Surge Before the Fall: The Herd Joins at the TopGold has rallied over 27% exactly as projected in the previous analysis
Now, the structure shows clear signs of exhaustion — price is approaching the end of wave 5, historically the stage where euphoria peaks and reversals are born.
Across the world, the crowd is piling into gold in a classic late-cycle buying frenzy. This kind of herd behavior — “everyone rushing to buy at once” — has always marked the final chapter of impulsive moves before major trend reversals.
The chart highlights potential trigger zones for the coming reversal:
Upper red dashed lines: triggers for aggressive traders
Lower red dashed lines: triggers for more conservative entries
Once those levels start breaking down, expect momentum to flip hard — and fast — signaling the beginning of a sharp corrective phase for gold.

GoldGold 🥇 | Comprehensive Technical Analysis - Setting a Significant Rejection Zone
Current Price: Around $4,353 | Timeframe: Daily - Weekly
Date: October 21, 2025
══════
📊 Overview On the Market:
Gold has completed an exceptional bullish cycle, reaching new all-time highs above 4,400, which I believe represents the local high for the current phase.
However, several technical factors now point to an imminent correction before any potential continuation.
══════
🔍 Key Technical Notes:
▪️ Price Zone:
The stock is currently trading in a bullish zone—an area where institutional investors historically tend to take profits and open short positions.
▪️ Market Sentiment:
Fear and Greed Index: 78/100 (Extreme Greed)
These extreme readings in bullish zones precede corrections in 85% of historical cases.
▪️ Structural Analysis:
- Overall Structure: Bullish (higher timeframes)
- Internal Structure: Showing signs of weakness and bearish divergence
- A potential Change in Personality (CHoCH) is forming on medium timeframes
▪️ Supply and Demand Zones:
Multiple untested resistance zones below, as well as unfilled fair value gaps that act as price magnets.
▪️ Multiple Timeframe Analysis:
Price is analyzed across multiple timeframes (4-hour, 1-day, 1-week, etc.) using advanced order flow techniques and proprietary market structure mapping tools—all of which point to a potential upcoming correction.
══════
🎯 Expected Scenario (High Probability):
Stage 1 - Initial Correction:
📍 Target 1: $3,777-$3,816
(Balance Zone)
📍 Target 2: $3,688-$3,749
(Discount Zone - Optimal Entry)
Stage 2 - Deeper Correction (Moderate Probability):
📍 Target 3: $3,465-$3,580
(Strong Institutional Demand - Buy Orders)
In addition to unfilled fair value gaps that act as price magnets.
Note: Additional Confirmation Required
After Reaching the Discount Zones:
The possibility of a continued uptrend exists, but is not currently highly likely. The situation will be reassessed upon reaching the demand zones.
══════
⚡ Why this analysis?
This analysis is based on:
✓ Advanced order flow analysis techniques
✓ Professional tools for mapping market structure
✓ Premium/Discount Zone Theory
✓ Detecting institutional order blocks
✓ Market sentiment analysis
✓ Liquidity level mapping
These are not traditional retail trading tools; they are institutional analysis techniques used by professional traders.
═════
📚 Previous Record:
Some may remember my previous analysis of gold in August 2023:
📌 Analysis for August 13 2023:
- Expectations: Rise from 1780
- Targets: 2500 → 2800 → Over 3800
- Result: ✅ 100% Success Rate
- Actual Movement: Reaching over 4400 (147% Profit)
- Update (April 2024): "Trade Closed at Target"
This analysis is based on the same institutional framework applied to this current situation. The methodology is effective because it tracks actual cash flow—not trader sentiment.
═════ ═════
⚠️ Risk Management (Mandatory):
Regardless of your confidence level, risk management is non-negotiable:
✓ Don't risk more than 1-2% of your capital on each trade.
✓ Always set a stop-loss before entering.
✓ Avoid excessive leverage.
✓ Maximize your profits. Steps
✓ Research yourself (DYOR)
══════════════════════════════════════ ═════
⚖️ Disclaimer:
This is educational technical analysis and does not constitute financial advice or an investment recommendation.
Trading carries a significant risk of capital loss.
Past performance does not guarantee future results.
Trade at your own risk.
Consult a licensed financial advisor before making any investment decisions.
══════
💬 Share your opinion with us:
What do you think of gold at these levels?
📊 If you found this analysis helpful, don't forget to like and follow it for more analysis.
🔔 Turn on notifications to receive updates as soon as this setting develops.
═════

Gold Trade Plan 17/10/2025( Looking for 10000 Pips Profit !!!!)Dear Traders,
Gold, influenced by geopolitical factors, has continued its bullish trend without any significant correction and is currently trading around 4300. In my opinion, from this point onward, we should follow a bearish scenario — the price is expected to enter a corrective phase by the end of October. The best zone for entering a long-term position would be between 4420–4475, with a target of at least 10,000 pips from the top. There’s also a high probability that the correction will begin before reaching this zone.
Invalidation Level : 4650 !
regards,
Alireza!

Gold trading plan!!Gold (XAU/USD) rebounds toward record highs after an earlier dip to the $4,280 zone, poised to close its ninth straight week in positive territory. Persistent geopolitical risks, renewed US-China trade tensions, and the prolonged US government shutdown keep investors cautious, driving safe-haven demand. Meanwhile, dovish Federal Reserve expectations—with markets pricing in two more rate cuts this year—continue to weigh on the US Dollar and bolster the yellow metal. Despite overbought conditions, steady dip-buying suggests the path of least resistance for Gold remains to the upside.
Gold price has almost no significant selling pressure, huge fomo market for strong uptrend above 4400
SET UP GOLD PRICE:
SELL GOLD zone: 4436 - 4438 SL 4443
TP1: $4425
TP2: $4412
TP3: $4400
BUY GOLD zone: $4278-$4276 SL $4271
TP1: $4285
TP2: $4298
TP3: $4310
Technical analysis:
Based on technical indicators EMA 34, EMA89 and support resistance areas to set up a reasonable BUY order.

#XAUUSD: Small Time-Frame Big Trade! Comment Your Views! Price is at the 'premium buying level' at this point we could expect it to continue the bullish momentum towards 4300$ or $4350. Please use accurate risk management while trading gold.
Good luck

Gold (XAU) Analysis📊 Gold (XAU) Analysis
After forming a new ATH, XAU is currently in a pullback phase.
Every dip still looks like a buying opportunity for now!
⚠️ This post is for educational purposes only and is not financial advice.
#XAUT #Gold #TradingView #CryptoAnalysis #Education

BEARS ARE IN CONTROL If you want a stress free and low risk sell wait for this current h1 candle in the sphere/ellipse to close below the rectangular block by 1pm or even 2pm UTC for the best entry because the real move is likely to start after 2pm so you will still not miss it, but is good to sell now or even if you entered earlier it's still good but it's best with low risk after 1pm especially after 2pm UTC

Gold's Historic Rally: Where We're HeadingGold broke out of a multi-year consolidation (2020–2024) when it cleared the previous all-time high of $2,080. Once that level broke, we entered price discovery mode .
This is important: There's no overhead resistance from traders who bought at higher levels because there are no higher levels. That's bullish. But it also means we're in uncharted territory.
The weekly chart shows a clean uptrend with no signs of reversal yet. But rallies this big and fast typically need consolidation phases.
Here's where it gets specific. Gold showed a classic consolidation pattern:
- Consolidation range: $2,565–$2,750
- Breakout point: Early 2025
- Measured move target: ~$3400
Using the Fibonacci extension, if the uptrend continues, it suggests the next major resistance is around $4,500 and $4,750.
If you plot these on a chart, you see:
- Gold broke out cleanly from consolidation
- Every pullback has been bought
We're in a controlled uptrend, not parabolic. This is the structure of a trend that could continue.
But it's also the structure that could reverse if critical support breaks.

Gold tests below $4,300 amid strengthening USD October 21Joint statement Ukraine – EU – Trump – Europe:
=> Call for an immediate ceasefire and start peace negotiations.
=> The market reacts risk-on, money flows out of gold => gold drops sharply.
echnical analysis: H1 is in the process of correction after continuously setting the ATH peak, gradually forming a head and shoulders pattern, buyers right at the 4178-4180 area are quite clear.
BUY GOLD : 4180 - 4178
SL: 4172
TP: 50 - 200 - 400PIPS
SELL GOLD : 4320 - 4322
SL: 4330
TP: 50 - 200 - 400PIPS
Trade according to price trends, do not trade predictions, manage and be responsible for your account !

XAU/USD – Gold Technical Rebound Prepares for Next Waveb]🔍 Market Context
After reaching a peak at the ATH GOLD 4,391 USD region, gold has undergone a technical correction — reflecting temporary profit-taking following a strong upward trend.
The market structure still maintains a bullish bias as the support zones below (FVG + OB) remain intact and untested.
Currently, the price is hovering around 4,325 USD, indicating that selling pressure has weakened.
Buyers are likely to return at two strategic zones below — where institutional money (Smart Money) typically accumulates positions before the next upward wave.
💎 Technical Analysis
ATH GOLD: 4,391 USD
Liquidity Zone $$$: 4,465 – 4,424 USD → the upper liquidity zone, the main target for the next upward wave.
FVG Zone: 4,284 – 4,267 USD → an unfilled gap, likely to be retested.
Order Block Zone: 4,244 – 4,230 USD → deep discount zone confluence with Fibo 0.786, high probability of strong reaction.
Liquidity Clear $$$: 4,186 – 4,190 USD → the last defense zone of the main upward trend.
Overall structure remains bullish ; the current decline is merely a phase of adjustment to “accumulate liquidity” before continuing the upward momentum.
📈 Trading Scenarios
1️⃣ BUY Setup #1 – FVG Zone 4,267 USD
Entry: 4,267 – 4,270
SL: 4,255
TP: 4,330 → 4,366 → 4,391
✅ Condition: Confirming bullish candle (rejection / engulfing bullish) at the FVG zone or a small BoS appears on M15.
➡️ Short-term “buy-the-dip” setup, leveraging the unfilled FVG zone — where technical buyers often initiate positions first.
2️⃣ BUY Setup #2 – Order Block Zone 4,244 USD
Entry: 4,244 – 4,230
SL: 4,210
TP: 4,284 → 4,366 → 4,391 → 4,424
✅ Condition: Strong confirming candle (engulfing bullish) or a retracement pattern breaking a small BoS back up.
➡️ Swing-buy setup at deep discount zone — confluence of OB + Fibo 0.786, high probability and optimal R:R.
⚠️ Risk Management
Avoid FOMO buying in the middle of the range (4,320–4,340).
Prioritize waiting for clear reactions at 4,267 and 4,244 before entering trades.
If the price closes an H1 candle below 4,210 → pause all buy orders, re-evaluate price action at 4,186.
Maintain moderate trading volume during the current rebound phase.
💬 Conclusion
Gold is in a phase of healthy technical correction within a major upward trend.
The two zones 4,267 USD (FVG Zone) and 4,244 USD (Order Block Zone) are key “accumulation” areas for large capital.
When bullish confirmation signals appear, these will be safe buy positions before gold heads back to the peak 4,391 – 4,465 USD .
👉 Reasonable Strategy:
Buy at 4,267 – 4,270 USD if reversal confirmation occurs.
Buy at 4,244 – 4,230 USD if a strong OB reaction signal appears.
🔥 “Smart money waits at precise levels — not at the top. The next gold wave will emerge between 4.267 and 4.244.”
