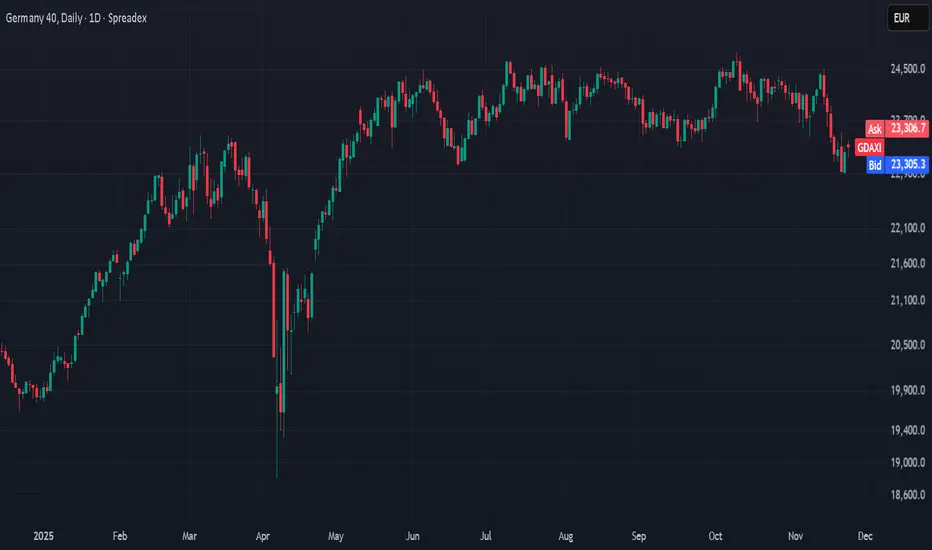
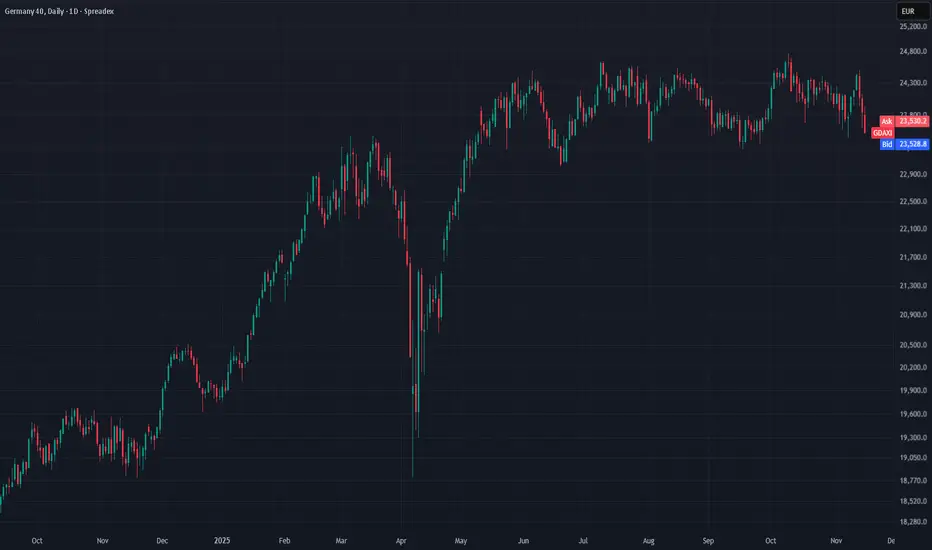
Technical Analysis WeeklyGermany 40 looks bearish with a possible breakdown from its current trading range. Trading at 23,283 and below the VWAP of 23,710, RSI at 39.7 supports a more negative sentiment. Support lies at 22,917, while resistance is at 24,504.
Wall Street remains bullish but is now in a correction phase, trading at 46,237 under the VWAP at 46,953. RSI at 42.2 suggests weakening momentum and potential for deeper pullback. Support is at 45,684, resistance at 48,223.
UK 100 continues to trend bullishly but has entered a correction phase. Price is at 9,567, beneath the VWAP of 9,686. RSI at 45.3 reflects neutral to soft momentum. Support is 9,456, with resistance at 9,915.
GBP/USD remains bearish and in a sideways correction. Price is 1.3122, slightly below the VWAP at 1.30914 and broken support at 1.3150. RSI of 38.6 suggests limited rebound potential. Support is 1.3034, resistance at 1.3208.
EUR/USD continues in a bearish leg of an otherwise neutral market, having not broken down past major support. The price is 1.1548 right at the VWAP. RSI at 44.7 indicates ongoing indecision. Support sits at 1.1470, resistance at 1.1638.
USD/JPY holds a bullish impulse structure, trading at 157.41 above the VWAP of 156.85, however there was a bearish engulfing candlestick at resistance from the January peak. RSI at 68.4 - down from very overbought levels signals slowing upwards momentum. Support is at 152.18, resistance at 157.41.
Gold remains in a correction of its bullish trend, trading at 4,069 just above VWAP of 4,068.94. The correction is contracting, which will lead to a resumption of the trend or an extended correction. RSI at 51.0 indicates balanced momentum. Support is 3,916 with resistance at 4,196.
Brent Crude has broken down to its lowest levels since October but remains above the critical $60 level, with price at 6,191 below VWAP at 6,357. RSI at 40.3 reflects downside pressure. Support is 6,105 and resistance is 6,553.
Trade ideas
24650 Still Holds for DaxDAX still could not break the 24650 resistance. The range is getting tighter and a possible breakout is closing but the direction of the breakout is still a question. Watch 23300 and 24650 as key levels.

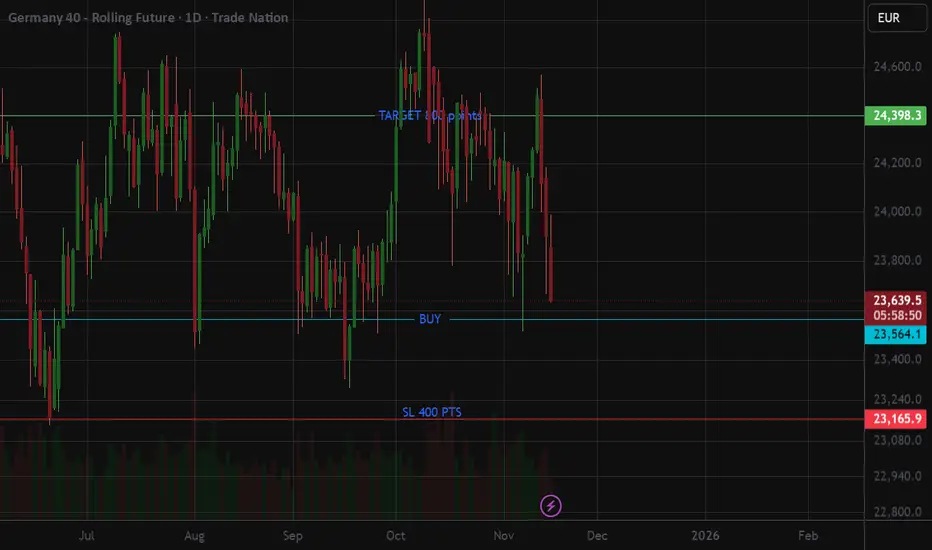
DAX futures buying in bottom of trading range dailya 1:2 RR swing trade in the german index futures (expect to hold this for some days). Risking 400 points, entry by order to gain 800 points. big swing, which means adding to your winner should be possible without increasing your risk! Buy more if the trade is 150 points + in profit and adjust both stop losses on second entry.
Big trading range in DAX, and it is looking bearish this monday.
DAX Germany 40 index Sell planSwept PWH.
Market structure shift.
Targetting liqudity Sitting below.
waiting for an pullback above in point of intrest.

GER40 Day Trading Act═════════════════════════════════════════════════════════════════════
GER40 INTRADAY TECHNICAL ANALYSIS & MARKET OUTLOOK
November 17, 2025 | 10:25 AM UTC+4 | Current Level: 23,871.1
═════════════════════════════════════════════════════════════════════
CRITICAL SUPPORT & RESISTANCE LEVELS
RESISTANCE ZONES (Sell Targets):
R1: 23,920.50 (First Profit Zone - 49.4 points) | RSI 65-70 zone
R2: 23,985.75 (Intermediate Target - 114.65 points) | EMA 20 confluence
R3: 24,065.25 (Strong Resistance - 194.15 points) | Weekly pivot + Gann angle
SUPPORT ZONES (Buy Opportunities):
S1: 23,815.30 (Initial Support - 55.8 points) | 15m Bollinger Band lower band
S2: 23,745.60 (Intermediate Support - 125.5 points) | SMA 50 daily level
S3: 23,670.40 (Strong Support - 200.7 points) | Harmonic reversal node
CURRENT PRICE ACTION
Index consolidating 23,850-23,895 (45-point range). Ichimoku cloud below price on 4h = bullish bias. RSI at 54 (neutral-bullish) on 1h. Volume building = breakout directional move likely within 90 minutes. Wyckoff accumulation phase near completion.
═════════════════════════════════════════════════════════════════════
ENTRY & EXIT SETUPS - INTRADAY EXECUTION
═════════════════════════════════════════════════════════════════════
BULLISH SETUP (Optimal on 5m breakout):
ENTRY: 23,895.75 (Break above consolidation high + candle close confirmation)
STOP LOSS: 23,835.00 (Beneath S1 by 0.30 risk)
TARGET 1: 23,920.50 (24.75 points) | Scale 50% profits
TARGET 2: 23,985.75 (90 points) | Scale 30% profits
TARGET 3: 24,065.25 (170 points) | Hold 20% to runner with trailing stop at 24,020
RISK/REWARD: 1:5.3 ratio | Risk 60.75 to win 325.75
BEARISH SETUP (Optimal on 1h rejection):
ENTRY: 23,825.40 (Break below consolidation low + rejection candle)
STOP LOSS: 23,895.00 (Above R1 by 0.30 risk)
TARGET 1: 23,815.30 (10.1 points) | Scale 50% profits
TARGET 2: 23,745.60 (79.8 points) | Scale 30% profits
TARGET 3: 23,670.40 (154.8 points) | Hold 20% with trailing stop at 23,700
RISK/REWARD: 1:2.4 ratio | Risk 69.60 to win 169.60
═════════════════════════════════════════════════════════════════════
TIMEFRAME-SPECIFIC TACTICS
═════════════════════════════════════════════════════════════════════
5-MIN SCALPING: Watch for 3-candle breakout patterns above/below 23,871. Target 15-20 points quick scalps. Use 23,855-23,890 as tactical range.
15-MIN SWING: RSI divergence at 23,920 = sell signal. Break of 23,860 with volume = buy signal. Hold 35-45 points per trade.
30-MIN POSITION: Bollinger Band squeeze breaking. Watch for EMA 9 crossing EMA 21. Head & Shoulders pattern potential if price rejects R2.
1-HOUR MACRO: Ichimoku cloud support at 23,750 blocks downside. Tenkan-sen/Kijun-sen alignment bullish. Wyckoff markup phase initiating—breakout confirmation critical.
4-HOUR BIAS: Daily level 23,745 is institutional battle zone. Price must close above 23,895 to confirm sustained bullish impulse. Below 23,815 triggers stop-hunting cascade into S2.
═════════════════════════════════════════════════════════════════════
SESSION EXECUTION RULES
═════════════════════════════════════════════════════════════════════
✓ ENTRY ONLY on candle close confirmation (not wick touch)
✓ STOP always 0.30-0.50 points BEYOND level (never AT level)
✓ SCALE profits: Take 50% at R1/S1, 30% at R2/S2, trail 20% to R3/S3
✓ IF price closes below 23,815 or above 23,920 = trend day imminent
✓ Maximum 3 trades per session. Walk away at 2 losses in a row
✓ Volume confirmation mandatory—low volume = false breakout likely
═════════════════════════════════════════════════════════════════════
Risk Disclaimer: Analysis is educational. Past performance ≠ future results.
═════════════════════════════════════════════════════════════════════

DAX40 The Week Ahead The Key Trading LevelsThe DAX is currently trading with a bearish bias, aligned with the broader downward trend. Recent price action shows a retest of the falling resistance, suggesting a temporary relief rally within the downtrend.
Key resistance is located at 23940, a prior consolidation zone. This level will be critical in determining the next directional move.
A bearish rejection from 23940 could confirm the resumption of the downtrend, targeting the next support levels at 23600, followed by 23430 and 23285 over a longer timeframe.
Conversely, a decisive breakout and daily close above 23940 would invalidate the current bearish setup, shifting sentiment to bullish and potentially triggering a move towards 24095, then 24217.
Conclusion:
The short-term outlook remains bearish unless the price breaks and holds above 23940. Traders should watch for price action signals around this key level to confirm direction. A rejection favours fresh downside continuation, while a breakout signals a potential trend reversal or deeper correction.
This communication is for informational purposes only and should not be viewed as any form of recommendation as to a particular course of action or as investment advice. It is not intended as an offer or solicitation for the purchase or sale of any financial instrument or as an official confirmation of any transaction. Opinions, estimates and assumptions expressed herein are made as of the date of this communication and are subject to change without notice. This communication has been prepared based upon information, including market prices, data and other information, believed to be reliable; however, Trade Nation does not warrant its completeness or accuracy. All market prices and market data contained in or attached to this communication are indicative and subject to change without notice.
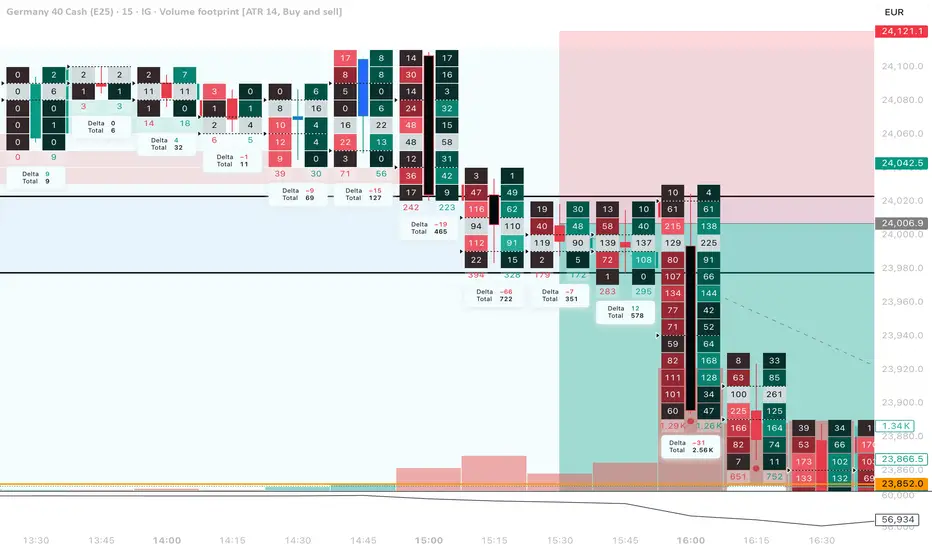
DAX – Clean Supply Retest + Absorption-Based Short SetupThis short setup formed after price broke below a key demand zone and flipped it into fresh supply.
On the retest, buyers showed aggressive activity, but orderflow revealed significant buy-side absorption — positive delta without any upward follow-through.
Price failed to reclaim the zone and created a clean lower high, showing exhaustion from buyers.
A red candle with strong negative delta confirmed the seller takeover and provided the entry trigger.
This setup was based on a confluence of:
• Structural break (Demand → Supply flip)
• Buy-side absorption
• Lower-high rejection
• Negative-delta confirmation
All conditions pointed toward a high-probability continuation to the downside.

GER30 H1 | Bullish Bounce OffMomentum: Bullish
The price has respected the buy entry level, which aligns with the 50% Fibonacci retracement, indicating strong bullish momentum.
Buy Entry: 23,989.16
Pullback support
50% Fibonacci retracement
Stop Loss: 23,850.33
Pullback support
61.8% Fibonacci retracement
Take Profit: 24,250.47
Pullback resistance
50% Fibonacci retracement
High Risk Investment Warning
Stratos Markets Limited (tradu.com ), Stratos Europe Ltd (tradu.com ):
CFDs are complex instruments and come with a high risk of losing money rapidly due to leverage. 70% of retail investor accounts lose money when trading CFDs with this provider. You should consider whether you understand how CFDs work and whether you can afford to take the high risk of losing your money.
Stratos Global LLC (tradu.com ): Losses can exceed deposits.
Please be advised that the information presented on TradingView is provided to Tradu (‘Company’, ‘we’) by a third-party provider (‘TFA Global Pte Ltd’). Please be reminded that you are solely responsible for the trading decisions on your account. Any information and/or content is intended entirely for research, educational and informational purposes only and does not constitute investment or consultation advice or investment strategy. The information is not tailored to the investment needs of any specific person and therefore does not involve a consideration of any of the investment objectives, financial situation or needs of any viewer that may receive it. Past performance is not a reliable indicator of future results. Actual results may differ materially from those anticipated in forward-looking or past performance statements. We assume no liability as to the accuracy or completeness of any of the information and/or content provided herein and the Company cannot be held responsible for any omission, mistake nor for any loss or damage including without limitation to any loss of profit which may arise from reliance on any information supplied by TFA Global Pte Ltd.

Technical Analysis WeeklyGermany 40 is neutral and ranging, with price at 23,843 slightly below the VWAP of 24,026. RSI at 44.2 reflects limited bearish conviction. Support is at 23,610, resistance at 24,410.
Wall Street remains bullish in a pullback phase, with price at 47,217 under the VWAP at 47,439. RSI at 50.6 signals neutral momentum and room for recovery. Support is at 46,823, resistance at 47,919.
UK 100 continues its bullish trend but is in a short-term pullback. Price at 9,689 trades back below the VWAP of 9,743. RSI at 51.2 indicates neutral momentum. Support sits at 9,611, resistance at 9,875.
GBP/USD is still bearish, but is in a pullback phase- bouncing towards the bottom of its former range, trading at 1.3163 on top of its VWAP. RSI at 43.6 hints at mild rebound potential within a broader downtrend. Support lies at 1.3015, resistance at 1.3315.
EUR/USD stays under bearish pressure but is an extended correction with a breaking of downtrend-line and rebound over the VWAP. RSI at 50.3 shows consolidation after prior weakness. Support is at 1.1477, resistance at 1.1677.
USD/JPY holds a bullish bias - pushing into the 155 round number, trading at 154.72 above the VWAP of 153.72. RSI at 63.8 confirms ongoing, yet fading, upward momentum. Support lies at 152.11, resistance at 155.33.
Gold is still undergoing a general correction - forming lower peaks but rising troughs, priced at 4,081 just above the VWAP of 4,039. RSI at 52.7 reflects balanced momentum after strong gains. Support stands at 3,886, resistance at 4,191.
Brent Crude is neutral and range-bound, trading at 6,366 near the VWAP of 6,412. RSI at 48.3 confirms indecision with neither side dominant. Support is at 6,255, resistance at 6,568.
long on DAX at the current support levels-currently DAX It's correcting but soon Market Makers should start to buy the dip at the levels showed in the chart. I'm planning to buy a small position at the current price and to take one more long position if the price will go lower
- DAX already for a long period of time didn't made new highs so It's possible if the DAX it's breaking the resistance level that could start a long strong trend


DAX Bearish pullback capped at 23940The DAX is currently trading with a bearish bias, aligned with the broader downward trend. Recent price action shows a retest of the falling resistance, suggesting a temporary relief rally within the downtrend.
Key resistance is located at 23940, a prior consolidation zone. This level will be critical in determining the next directional move.
A bearish rejection from 23940 could confirm the resumption of the downtrend, targeting the next support levels at 23600, followed by 23430 and 23285 over a longer timeframe.
Conversely, a decisive breakout and daily close above 23940 would invalidate the current bearish setup, shifting sentiment to bullish and potentially triggering a move towards 24095, then 24217.
Conclusion:
The short-term outlook remains bearish unless the price breaks and holds above 23940. Traders should watch for price action signals around this key level to confirm direction. A rejection favours fresh downside continuation, while a breakout signals a potential trend reversal or deeper correction.
This communication is for informational purposes only and should not be viewed as any form of recommendation as to a particular course of action or as investment advice. It is not intended as an offer or solicitation for the purchase or sale of any financial instrument or as an official confirmation of any transaction. Opinions, estimates and assumptions expressed herein are made as of the date of this communication and are subject to change without notice. This communication has been prepared based upon information, including market prices, data and other information, believed to be reliable; however, Trade Nation does not warrant its completeness or accuracy. All market prices and market data contained in or attached to this communication are indicative and subject to change without notice.

Sell Plan (DE40 | Daily) Garmany DAX**Sell Plan (DE40 | Daily)**
Price has swept short-term highs after taking out liquidity near the previous range top. The most recent daily candle is still active, showing a potential shift from buy-side to sell-side liquidity.
Wait for price to retest the marked zone to confirm weakness or rejection. Once confirmation appears, look for entries aligned with the trade plan.
Bearish targets lie toward the liquidity pool below and the higher timeframe demand zone.
Follow plan strictly — trade only as per setup, without adjusting SL, BE, or TP once in the trade.


Bullish momentum to extend?DAX40 (DE40) has reacted off the pivot and could rise to the 1st resistance, which has been identified as a swing high resistance.
Pivot: 24,350.30
1st Support: 24,103.22
1st Resistance: 24,777.41
Disclaimer:
The opinions given above constitute general market commentary and do not constitute the opinion or advice of IC Markets or any form of personal or investment advice.
Any opinions, news, research, analyses, prices, other information, or links to third-party sites contained on this website are provided on an "as-is" basis, are intended to be informative only, and are not advice, a recommendation, research, a record of our trading prices, an offer of, or solicitation for, a transaction in any financial instrument and thus should not be treated as such. The information provided does not involve any specific investment objectives, financial situation, or needs of any specific person who may receive it. Please be aware that past performance is not a reliable indicator of future performance and/or results. Past performance or forward-looking scenarios based upon the reasonable beliefs of the third-party provider are not a guarantee of future performance. Actual results may differ materially from those anticipated in forward-looking or past performance statements. IC Markets makes no representation or warranty and assumes no liability as to the accuracy or completeness of the information provided, nor any loss arising from any investment based on a recommendation, forecast, or any information supplied by any third party.

GER40 INSTITUTIONAL ACCUMULATION PHASE: 📊 GER40 INSTITUTIONAL ACCUMULATION PHASE: Breakout Architecture & Supply Zone Defense - November 13, 2025
Asset: GER40 (DAX CFD Spot) | Current Level: 24,475 | Analysis Date: Nov 13, 2025 | Market Condition: Bull Continuation Setup
━━━━━━━━━━━━━━━━━━━━━━━━━━━━━━━━━━━━━━━━━━
🔍 STRUCTURAL TREND FRAMEWORK
Sequential price action demonstrates consistent markup pattern across timeframe hierarchy. Bullish structure remains robust with price stabilization above the 200-period simple moving average confirming ongoing accumulation cycle. Support-level rejections exhibit strong demand absorption - upward participation bias exceptionally high.
📍 PATTERN RECOGNITION ARCHITECTURE
5-Min Zone: Ascending pennant nearing apex - directional breakout probability elevated
Quarter-Hour Interval: Bullish wedge consolidation - upper band penetration signals continuation
30-Min Structure: Inverted formation resembling cup build with handle positioning near key level
Hourly Context: Rectangular consolidation box - breakout vector pointing skyward
4-Hour Viewpoint: Reverse shoulder-head-shoulder formation with neckline action pending
⚙️ QUANTITATIVE INDICATOR MATRIX
Momentum Gauge: 4H oscillator range 63-68 (sustained positive momentum, non-stretched extremes)
Bollinger Band Position: Price action above centerline on 1H - volatility expansion pattern emerging
Moving Average Stack: 20-period > 50-period > 200-period (Golden Cross architecture established)
Volume-Weighted Benchmark: Price deployment above daily volume-weighted average confirms buyers in control
Cloud Formation: Senkou alignment favoring upside - Leading Span B crossed above Span A
🎯 EXECUTION FRAMEWORK & SCENARIOS
DOMINANT BULLISH SCENARIO:
Activation Trigger: Hourly candle closure exceeding 24,080 with intraday volume acceleration
Price Objectives: 24,175 (R1) → 24,245 (R2) → 24,330 (Weekly Apex)
Downside Guard: Stop placement below 24,000 (Triple formation base breach)
CONTINGENCY BEARISH SCENARIO:
Trigger Point: Failure from 24,105 + Closing below 4H support + Volume washout
Target Zones: 23,980 → 23,900
Protective Stop: Above 24,150
🔑 PRICE LEVEL HIERARCHY
Resistance Cluster: 24,105 | 24,175 | 24,245 | 24,330
Support Foundation: 24,015 | 23,980 | 23,900
📐 HARMONIC & CYCLICAL MECHANICS
Geometric pattern analysis identifies potential Gartley structure approaching completion - asymmetric retracement zones suggesting reversal environment. Angular analysis from cyclical lows validates ascending trajectory with structural integrity intact through geometric resistance markers.
✅ DECISION CRITERIA CHECKLIST
Bullish Confirmation Criteria: Volume bar expansion | Hourly close above threshold | Oscillator non-divergence
⚠️ Risk Disclosure: Analysis provided for educational framework only. Position management and capital preservation via stop-loss implementation remain trader responsibility. Market dynamics subject to instantaneous regime change.

GER30WE looking very bullish after retesting the strong demand and price rejected from the same demand zone and still anticipating for bullish momentum.

Germany DAX 1H Trade PlanGermany DAX 1H Trade Plan
Market is recovering after a deep selloff, showing signs of short-term strength. I’m watching for a move toward the first target to complete liquidity collection before any potential reversal.
If price reaches premium levels, I’ll look for signs of distribution or rejection to align with the higher-timeframe bearish context.
Bias remains bearish overall, but I’ll allow short-term buy setups until the upper liquidity is cleared.

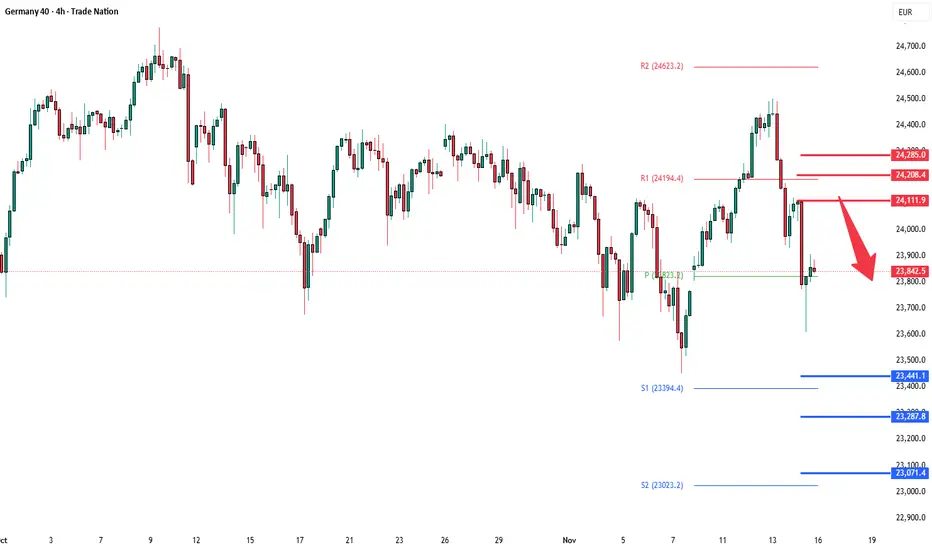
GER40 In-Depth: Mid-Day Technical SynthesisGER40 In-Depth: Mid-Day Technical Synthesis | November 12
Live Data: 24,245.6 | 11:30 UTC+4
EXECUTIVE SNAPSHOT
The German blue-chip index is currently navigating a critical juncture. Mid-morning action reveals a market organism responding to competing forces: institutional demand supporting lower levels while supply emerges at recent highs. This synthesis dissects the underlying mechanics.
STRUCTURAL ANATOMY
▪ Dow Theory Application: The primary uptrend, established in late October, shows signs of maturation. Recent price action has produced a lower high relative to the prior swing peak, suggesting potential exhaustion. The integrity of this trend remains contingent upon defense of the 24,150 support band.
▪ Japanese Candlestick Morphology: The 30-minute timeframe exhibits a series of indecisive candles— shooting stars and hammers alternating at resistance, indicating rejection of higher price levels followed by temporary recovery attempts. This oscillatory behavior typifies late-stage accumulation before directional commitment.
▪ Elliott Wave Architecture: A potential Wave (4) corrective phase is unfolding, characterized by a triangle formation on the 1-hour chart. The geometric containment suggests Wave (5) is imminent, pending triangle resolution.
MICRO-INDICATOR READOUT
Ichimoku (4H): Price trades immediately beneath the Kumo cloud ceiling (~24,380). The Tenkan-Sen (blue) and Kijun-Sen (red) are converging, creating a potential bullish alignment if price breaks above the cloud.
RSI (1H): Hovering in the 45–55 band. No divergence signals present; momentum is neutral. However, sustained pressure below 40 would signal bearish acceleration.
VWAP: Slightly above current price (~24,260), suggesting intraday sellers retain marginal structural advantage.
Bollinger Bands (15M): Bands are in a moderate squeeze state, indicating volatility compression. A breakout is anticipated within the next 2–4 hours.
HARMONIC & GANN CONSIDERATIONS
A Gartley Pattern (bearish variant) is approaching completion near 24,380, with the Price Reversal Zone spanning 24,350–24,400. This convergence with the Ichimoku cloud overhead creates a formidable resistance barrier. A rejection here would validate the bearish Gartley thesis.
Conversely, a Rising Wedge is simultaneously visible on the 4-hour chart. Traditionally, wedges resolve in the direction opposite to their slope, suggesting downside bias if the upper trendline is breached below support.
EXECUTION FRAMEWORK
LONG SCENARIO (Conditional – 45% Probability):
Activation occurs on a decisive push above 24,380 (Ichimoku cloud & Gartley resistance zone), coupled with volume confirmation.
- Entry: 24,400–24,420
- Stop Loss: 24,280
- Target 1: 24,550
- Target 2: 24,700
SHORT SCENARIO (Primary – 55% Probability):
Activation upon breakdown and close below the triangle support (~24,100), confirming Gartley completion and rising wedge failure.
- Entry: 24,080–24,050
- Stop Loss: 24,200
- Target 1: 23,900
- Target 2: 23,650
COMMENTARY:
The DAX remains a market in balance. Pattern confluence at resistance (Ichimoku-Gartley-Wedge) argues for caution on extended longs. Support defense at 24,150 is the operative thesis. Breaks here warrant swift tactical repositioning.

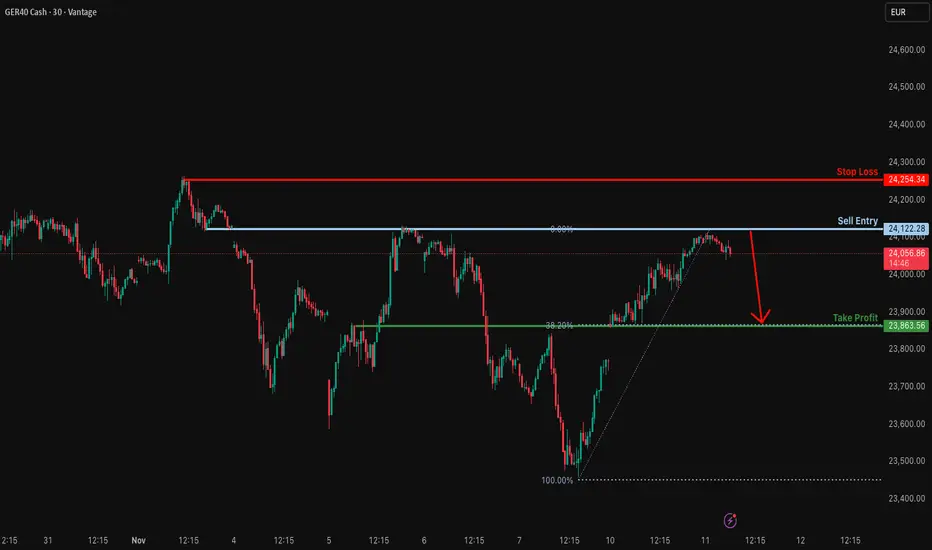
Could we see a reversal from here?GER40 has rejected off the resistance level, which is a pullback resistance, and could drop from this level to our take profit.
Entry: 24,22.28
Why we like it:
There is a pullback resistance level.
Stop loss: 24,54.34
Why we like it:
There is a swing high resistance level.
Take profit: 23,863.56
Why we like it:
There is an overlap support level that aligns with the 38.2% Fibonacci retracement.
Enjoying your TradingView experience? Review us!
Please be advised that the information presented on TradingView is provided to Vantage (‘Vantage Global Limited’, ‘we’) by a third-party provider (‘Everest Fortune Group’). Please be reminded that you are solely responsible for the trading decisions on your account. There is a very high degree of risk involved in trading. Any information and/or content is intended entirely for research, educational and informational purposes only and does not constitute investment or consultation advice or investment strategy. The information is not tailored to the investment needs of any specific person and therefore does not involve a consideration of any of the investment objectives, financial situation or needs of any viewer that may receive it. Kindly also note that past performance is not a reliable indicator of future results. Actual results may differ materially from those anticipated in forward-looking or past performance statements. We assume no liability as to the accuracy or completeness of any of the information and/or content provided herein and the Company cannot be held responsible for any omission, mistake nor for any loss or damage including without limitation to any loss of profit which may arise from reliance on any information supplied by Everest Fortune Group.
DAX Oversold bounce resistance retest at 23940The DAX is currently trading with a bearish bias, aligned with the broader downward trend. Recent price action shows a retest of the falling resistance, suggesting a temporary relief rally within the downtrend.
Key resistance is located at 23940, a prior consolidation zone. This level will be critical in determining the next directional move.
A bearish rejection from 23940 could confirm the resumption of the downtrend, targeting the next support levels at 23600, followed by 23430 and 23285 over a longer timeframe.
Conversely, a decisive breakout and daily close above 23940 would invalidate the current bearish setup, shifting sentiment to bullish and potentially triggering a move towards 24095, then 24217.
Conclusion:
The short-term outlook remains bearish unless the price breaks and holds above 23940. Traders should watch for price action signals around this key level to confirm direction. A rejection favours fresh downside continuation, while a breakout signals a potential trend reversal or deeper correction.
This communication is for informational purposes only and should not be viewed as any form of recommendation as to a particular course of action or as investment advice. It is not intended as an offer or solicitation for the purchase or sale of any financial instrument or as an official confirmation of any transaction. Opinions, estimates and assumptions expressed herein are made as of the date of this communication and are subject to change without notice. This communication has been prepared based upon information, including market prices, data and other information, believed to be reliable; however, Trade Nation does not warrant its completeness or accuracy. All market prices and market data contained in or attached to this communication are indicative and subject to change without notice.

Dax.Monday 24th NovemberA wodge of resistance is looming.Above 23400 does not seem to be liked
Latest movement is a bullish pattern
Lets see what happens

DAX – Liquidity Sweep + Absorption + Reversal StructureThis analysis focuses on how price reacted around a key liquidity area on DAX.
The market first swept the previous high, triggering stop orders and collecting liquidity. After the sweep, the footprint data showed a concentration of aggressive orders hitting into the opposite side without follow-through.
Key observations:
1. Liquidity Sweep at the High
Price moved above the previous session’s high, taking stops and clearing liquidity before slowing down.
2. Absorption Characteristics
After the sweep, several candles formed with:
Elevated volume
Small real bodies
Opposing orderflow behavior
This commonly reflects absorption, where the market absorbs incoming orders instead of continuing the prior move.
3. Shift in Behavior
Once absorption appeared multiple times near the swing high, the market failed to continue upward and began showing signs of a shift in pressure.
4. Reversal Development
After the shift, price broke a minor structural level and continued lower, suggesting the absorbed area acted as temporary resistance.
This post highlights how liquidity behavior + volume response can help understand potential turning points in price.
It is not financial advice — just sharing market observation and technical behavior based on publicly visible price/volume patterns.