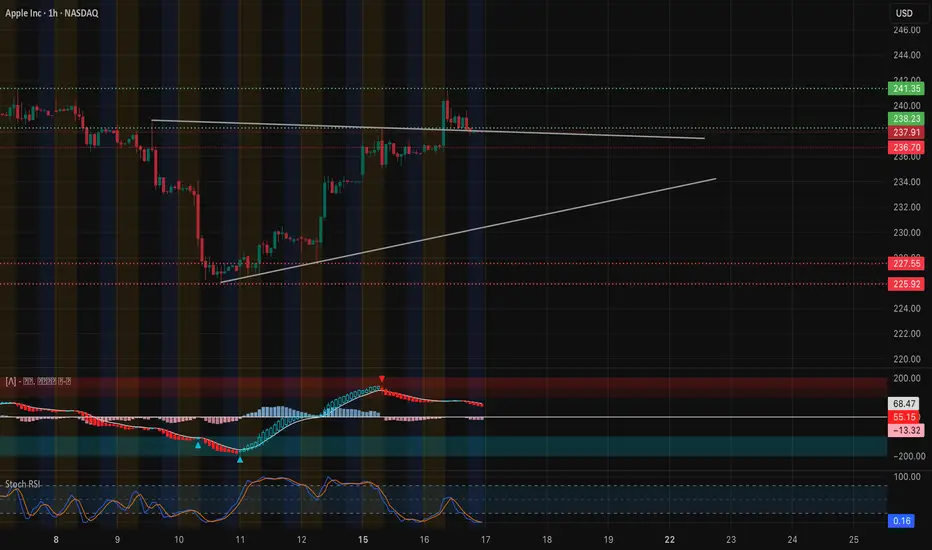
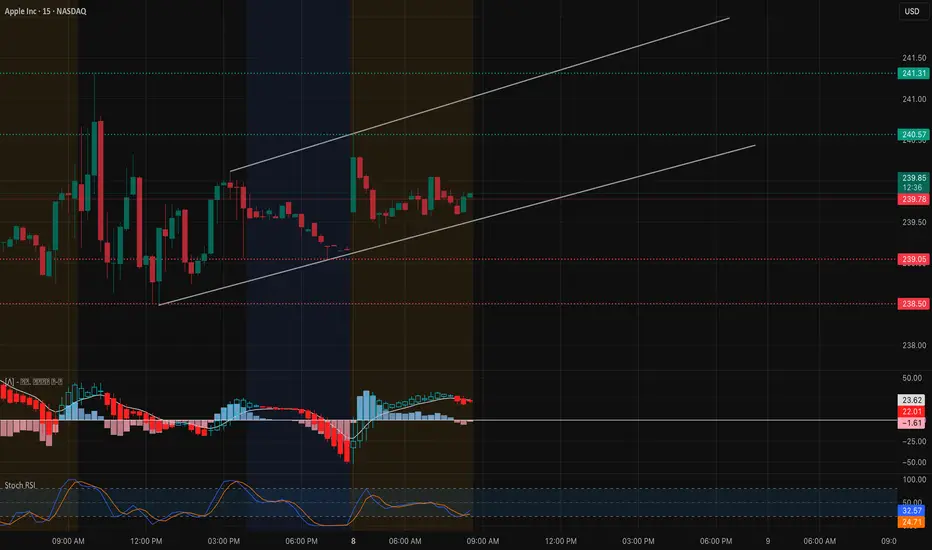
AAPL: Building a Base at 238 – Swing & Scalp Setups for Sept 17 1-Hour Chart Technical View
Apple’s 1-hour chart shows a constructive rebound from the early September selloff. After reclaiming the $236.7–$238.2 zone, price is consolidating beneath $241.3. MACD has eased back toward neutral and Stoch RSI is mid-range, indicating digestion after the recent pop.
* Immediate Support: $237.9–$238.2 (short-term breakout retest)
* Major Support: $236.7 (trend-defining pivot)
* Upside Zone: $241.3–$243.8 is the next key resistance band; a breakout above could open $245–$250
9 EMA remains above the 21 EMA, keeping the micro-trend bullish as long as $236.7 holds.
GEX & Options Flow
Options positioning supports the idea of a slow upward bias:
* Call Walls: $241.3 (highest positive NET GEX / call resistance), $242.5, and $245.
* Put Support: $217.5 is the main deep downside hedge.
* GEX Bias: Modest call concentration at ~6.7% with IVR ~14 (IVx ~26.5), showing lower option demand and relatively quiet volatility pricing.
This suggests market makers are not pricing in a major move but will likely support dips near $236–$238.
Trade Thoughts & Suggestions
* Swing Idea: Enter on dips into $238 with a stop below $236.5, aiming for $241.3–$243.8 and possibly $245–$250 if momentum improves.
* Scalp Idea: Buy quick pullbacks to $238 or play a clean breakout above $241.3 with volume confirmation.
* Bearish Scenario: A decisive break under $236.5 could test $232 and lower.
Quick Take
AAPL is building a steady base just under $241. For Sept 17, holding $238 keeps the bull case intact with $241–$245 as the upside zone to watch.
Disclaimer: This analysis is for educational purposes only and does not constitute financial advice. Always do your own research and manage risk before trading.
APC trade ideas
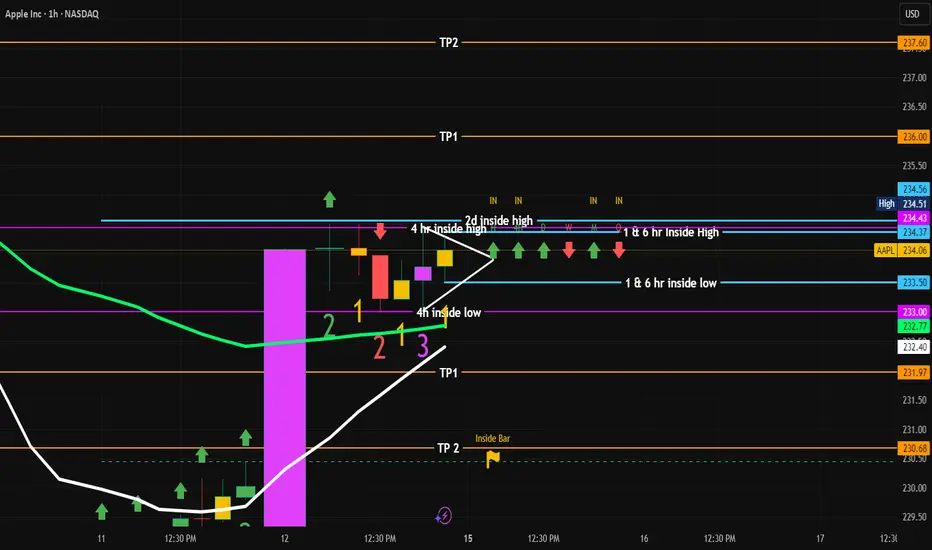
AAPL trade plan on 9/15/25Trade Plan: AAPL (1H + 4H Inside Bars)
🔹 Context
Current price stuck between 1hr/6hr inside bar high (≈234.4) and inside bar low (≈233.5).
Multiple inside bars → compression → expect breakout soon.
Targets (TP1/TP2) are pre-marked above and below.
✅ Entry Triggers
Long Entry:
Buy above 234.5 (clear break of 1H & 4H inside high).
Confirmation: candle closes above 234.5 on 1H timeframe.
Short Entry:
Sell below 233.5 (break of 1H & 4H inside low).
Confirmation: candle closes below 233.5 on 1H timeframe.
🛑 Stop Loss (S/L)
For Longs: just below inside bar low → 233.2.
For Shorts: just above inside bar high → 234.7.
👉 Keeps S/L tight, clear invalidation.
🎯 Take-Profit (TP)
Upside Targets:
TP1 = 236.0
TP2 = 237.6
Downside Targets:
TP1 = 231.9
TP2 = 230.6
🚫 No-Trade Zone
Between 233.5 – 234.5 (the inside bar range).
This is chop city → no edge.
Wait for break + close outside this zone before entering.
⚖️ Risk-Reward
Entry at 234.5 → Stop at 233.2 → Risk ≈ $1.3.
TP1 = 236 → Reward ≈ $1.5 → R:R ≈ 1.15.
TP2 = 237.6 → Reward ≈ $3.1 → R:R ≈ 2.4.
👉 Don’t settle for TP1 only. Hold partial to TP2 for 2:1+ R:R.
🔑 Final Checklist
No trades inside 233.5 – 234.5 box.
Enter only on breakout + close beyond that range.
Hard stop just outside opposite end of range.
Scale out at TP1, hold runner to TP2.
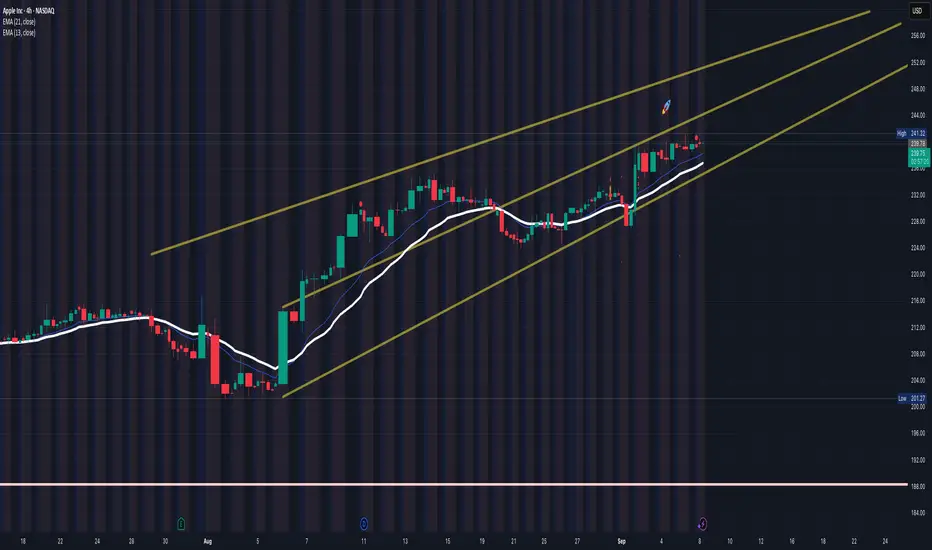
Apple: Pulling Back, but Uptrend Still IntactApple has recently faced substantial downward pressure, retracing enough to erase the gains made in the first week of September. Our primary outlook is that the stock will soon rebound and, during green wave , rise toward resistance at $260.10. Following a moderate pullback in wave , shares should ultimately break through this level in wave , further advancing the broader upward trend. However, we continue to monitor our 37% likely alternative scenario. In this case, AAPL would have completed beige wave alt.b with its recent peak and could next target a new major low for blue wave alt.(IV) via wave alt.c . Here, the price would fall below support at $201.50 but ideally rebound above the lower mark at $168.

AAPL – Pullback Setup After Keynote-Induced DipMy original post was hidden due to a house rule violation, but I’m sharing the setup again here:
Apple’s stock dropped heavily after the recent iPhone 17 / iPhone Air keynote, landing on a key support level that previously aligned with an upside break of structure.
This sharp decline appears to have started an Elliott 5-wave move. Wave 3 has already completed, and I’m now speculating for Wave 4 to develop — which could complete a tight 0.5R setup.
Confluences:
• RSI and MACD both showing divergences at support
• Stochastic oversold, also printing divergence
• Structure remains intact, likely aiming for a retest of the above resistance area
For this setup, a 1 ATR target protected by a 2 ATR stop loss on the 1H timeframe should be enough.
Disclaimer: This idea is for educational purposes only. Please do not place trades solely based on this setup.
Apple Wave Analysis – 10 September 2025- Apple broke daily Rising Wedge
- Likely to fall to support level 225.00
Apple recently reversed from the resistance area between the resistance level 240.00 (which also reversed the price in March) and the upper daily Bollinger Band.
The downward reversal from this resistance area started the active downward correction which then broke the daily Rising Wedge from August.
Apple can be expected to fall further toward the next support level 225.00 (low of the previous correction 2 from August).
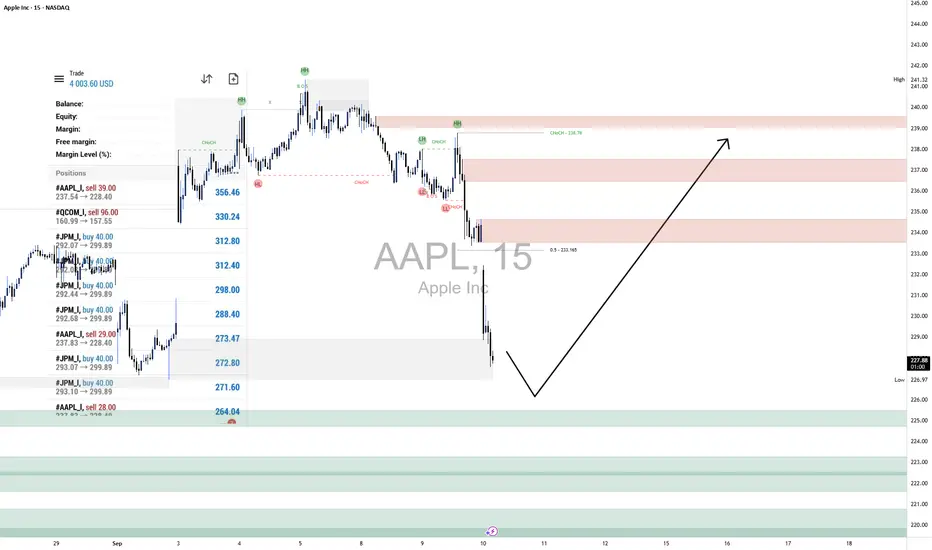
AAPL LongOn AAPL (15m), the broader market structure has shifted bearish after multiple CHoCH signals near 239–238 and a decisive Break of Structure (BOS) around 236, which confirms sellers have taken control following the rejection from the recent swing high at 241.02. The rapid downside move into the current session suggests continuation pressure, but a short-term corrective rally remains possible if demand levels hold.
The supply zones between 233–239 look strong, as price repeatedly failed to hold above them and sold off sharply each time, showing clear seller dominance. The stacked demand levels below 227 down to 220 are important to watch: buyers previously stepped in with strength here, creating impulsive rallies, but their ability to defend these zones again will determine whether a deeper recovery can take place.
Price is now trading at 227.91, extending a sharp leg lower into nearby demand. The marked projection suggests price may attempt a bounce from this area, targeting a corrective move back toward 233–238 supply. If buyers manage to defend current lows and create a bullish reaction, a retracement into those red zones is likely. However, failure to hold above 226.90 would expose lower demand layers toward 224–222.
The current trade bias is bearish, but near-term expectation is for a corrective bullish retracement into supply before sellers look to re-engage. The outlook would be invalidated if price breaks and closes decisively above 239, as that would flip structure back in favor of buyers. Momentum currently favors sellers given the sharp downside drive, but any slowing of bearish candles at demand or the appearance of strong bullish engulfing patterns would support a corrective move higher.
AAPL 1D Time frameCurrent Price & Market Metrics
Current Price: $234.35 USD
Market Cap: $3.01 Trillion
P/E Ratio: 30.28
EPS: $6.59
Beta: 1.15
Volatility: 2.32%
52-Week Range: $139.34 – $200.00 USD
🔎 Technical Indicators
Relative Strength Index (RSI): 67.00 — Neutral
Moving Averages:
5-day: $237.11 — Buy
10-day: $233.72 — Buy
20-day: $231.59 — Buy
50-day: $219.01 — Buy
100-day: $210.66 — Buy
200-day: $220.99 — Buy
Moving Average Convergence Divergence (MACD): 5.61 — Sell
Stochastic Oscillator: 89.58 — Sell
Commodity Channel Index (CCI): 136.25 — Sell
Average True Range (ATR): 4.41
📈 Support & Resistance Levels
Support: $220.11
Resistance: $239.78
📅 Outlook
Bullish Scenario: A breakout above $239.78 could signal a move toward $255.59.
Bearish Scenario: A drop below $220.11 may lead to further downside.
Overall Bias: Neutral to Bullish, with mixed signals from momentum indicators and moving averages.

Apple Shares (AAPL) Fall After iPhone 17 LaunchApple Shares (AAPL) Fall After iPhone 17 Launch
Yesterday, Apple unveiled its new products, including the iPhone 17. The new model features a sleeker form factor, an improved display and battery, and a new processor. However, analysts believe the model lacks the breakthrough impact needed to drive the stock higher.
The charts confirm this: while the main stock indices rose yesterday, AAPL shares fell by around 1.5%.
Technical Analysis of Apple Shares (AAPL)
When analysing the chart six days ago, we:
→ confirmed the upward channel (shown in blue);
→ highlighted the $235 support level;
→ suggested that while AAPL stock could maintain upward momentum, disappointment over the new product launch might trigger a correction.
In addition to the AAPL price action we noted earlier, several bearish signals on the hourly chart support the correction scenario:
→ a long upper shadow (marked with an arrow);
→ aggressive price action when breaking the $235 support;
→ bearish divergences on the RSI indicator.
Bulls might find support at line S, which is part of a fan drawn from the starting point of the bullish impulse on 6 August.
However, if bearish sentiment persists, price action could unfold within the structure shown in red (potentially a bull flag pattern inside the prevailing bullish trend). Bearish pressure could aim to push AAPL shares down towards the median of the red channel.
In that case, bulls may find support in the area where several lines converge:
→ the lower rays of the fan (shown in orange);
→ the psychological $230 level (which has repeatedly switched roles between resistance and support since August);
→ the median of the blue channel;
→ the lower boundary of the bullish gap from 2 September.
This article represents the opinion of the Companies operating under the FXOpen brand only. It is not to be construed as an offer, solicitation, or recommendation with respect to products and services provided by the Companies operating under the FXOpen brand, nor is it to be considered financial advice.
AAPL 4Hour Time frame📊 Apple (AAPL) Snapshot
Current Price: ~$234.35
Day Range: $233.01 – $238.66
Open Price: ~$236.73
Market Cap: ~$3.0 Trillion
P/E Ratio: ~30.3
EPS: ~6.59
🔎 Pivot Levels (Daily Basis → useful for 4H)
Pivot Point: ~$234.6
Resistance:
R1: ~$235.9
R2: ~$238.0
R3: ~$239.2
Support:
S1: ~$232.5
S2: ~$231.3
S3: ~$229.1
📉 Technical Indicators (4-Hour Insight)
RSI: ~40 → weak, leaning bearish.
MACD: Negative → bearish momentum.
Moving Averages: Short-term averages show Sell, long-term still supportive (Buy).
📌 4-Hour Frame Outlook
Momentum: Neutral-to-bearish; price is consolidating around the pivot zone ($234–235).
Bullish Scenario: If AAPL breaks above $238, short-term upside could open toward $239+.
Bearish Scenario: If price slips below $232, risk increases for a move toward $230.
✅ Conclusion: On the 4-hour chart, Apple is in a neutral to bearish phase, with weak momentum. Bulls need a breakout above $238 to take control, while bears may dominate if it breaks under $232.
AAPLChart practice
Levels marked and the timeframe color code:
yearly = black
monthly = pink
weekly = grey
daily = red.
posted on a 4hr chart.
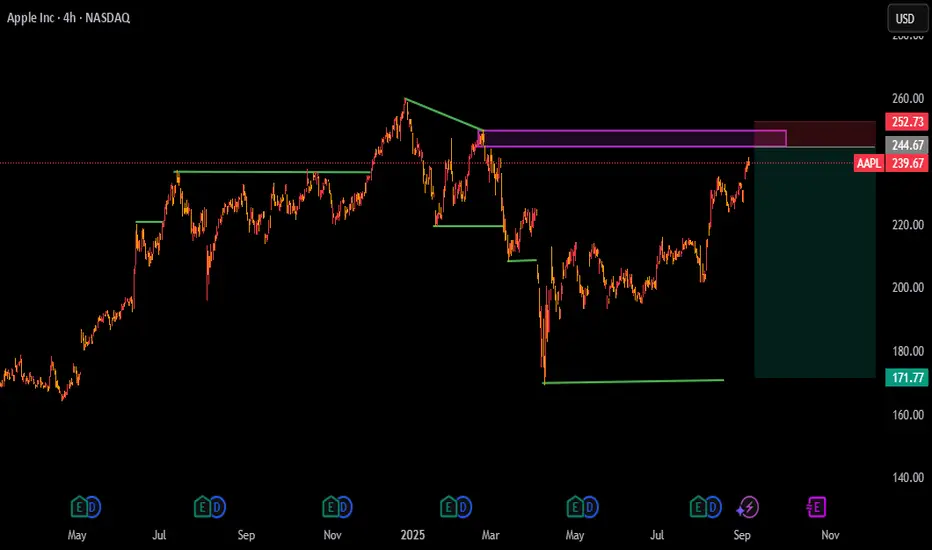
AAPL Eyes $300—Bullish Breakout in PlayAAPL Eyes $300—Bullish Breakout in Play
AAPL could reach $300 in the coming months.
Since our last update, the stock has climbed nearly 20%, rising from $200 to $240.
It recently broke out of a small triangle pattern, showing strong bullish momentum. This breakout suggests the rally may continue.
My key upside targets are: $257.50, $270, $280, and eventually $300.
Watch the full analysis for more insights.
Thank you!

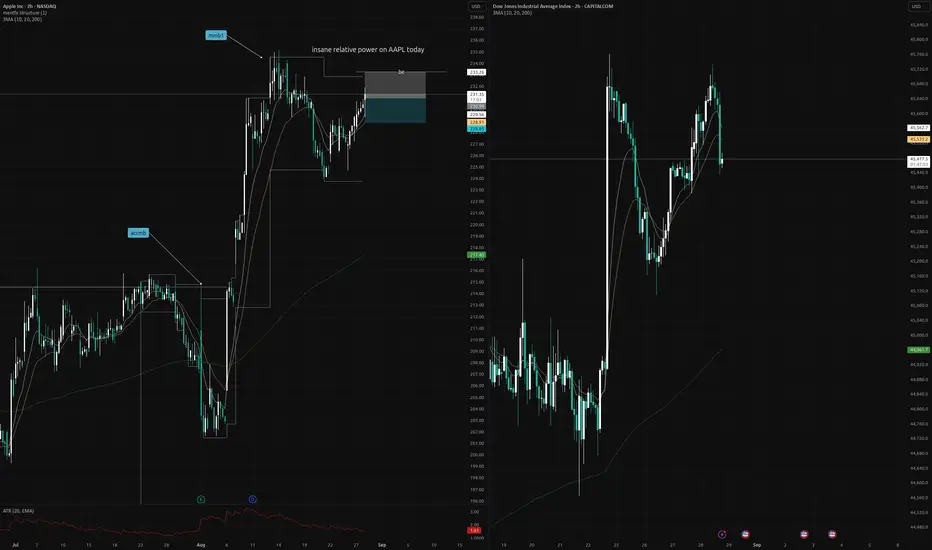
AAPL relative strength to US30 today Because APPLE is going up but US30/US2000 is falling like crazy, we can say that APPLE is one of the strongest stock in comparison with the overall stock market in US
What you think about this trade?
Apple – Can the Company’s “Awe Dropping” Event Deliver?The Apple share price has been on a roll of late, trading from a low of 224 on August 21st to print a 6 month high of 241 on Friday (Sept 5th), consolidating its position as the third biggest company in the world with a market capitalisation of $3.56 trillion, just behind Microsoft in second place at $3.68 trillion.
However, what happens next for the Apple share price may depend in part on how well traders respond to the company’s biggest product launch of 2025, which is due for release at its “Awe Dropping” event later today.
Apple are due to showcase their next generation iPhone line up, alongside new smartwatches, and other devices. This hardware is seen as important for the future success of the company given Apple has fallen behind its key competitors in the AI space and so needs customers to keep buying these products while it revitalises its plans to catch up.
The Apple Event kicks off at 1800 BST. It could be helpful for traders to monitor the product announcements and keep focused on any impact they have on price action for Apple stock throughout the evening and early trading on Wednesday.
The share price could experience pockets of volatility across this crucial 24 hour period before traders switch their focus to the US inflation releases that are scheduled for 1330 BST Wednesday (PPI) and 1330 BST Thursday (CPI).
Technical Update: Optimism Ahead of the Product Launch?
It might be argued the current price of Apple shares reflects positive investor sentiment ahead of today’s product launch.
Since the April 8th low, traders have consistently bought into price dips, pushing the stock above resistance marked by the previous failure high.
As the chart above shows, improving sentiment has helped form an uptrend in price, with Friday marking the highest trade in Apple shares since March 7th.
While the positive trend is encouraging, it is no guarantee of continued price strength, and much will depend on how the market reacts to this evening’s key sentiment driver.
That said, a close above the 241 high could trigger a further phase of strength toward higher resistance levels.
A successful close above 241 might signal a push toward resistance at 250, which is the February 25th high, or even 260, which is the December 26th peak.
However, if the market reacts negatively to the product launch, breaking key support levels might be an indication for risks of further price declines in Apple’s share price.
As shown in the chart above, the rising Bollinger mid-average, currently at 232, may offer initial support. Last week's decline held at this level, helping to establish fresh buying interest and the latest move to new recovery highs.
As such, the 232 level may serve as the first possible support, with a close below it signalling potential for increased downside risks.
A close below 232 could potentially trigger a deeper decline toward 224, the August 21st low, or even 202, the August monthly downside extreme.
The material provided here has not been prepared accordance with legal requirements designed to promote the independence of investment research and as such is considered to be a marketing communication. Whilst it is not subject to any prohibition on dealing ahead of the dissemination of investment research, we will not seek to take any advantage before providing it to our clients.
Pepperstone doesn’t represent that the material provided here is accurate, current or complete, and therefore shouldn’t be relied upon as such. The information, whether from a third party or not, isn’t to be considered as a recommendation; or an offer to buy or sell; or the solicitation of an offer to buy or sell any security, financial product or instrument; or to participate in any particular trading strategy. It does not take into account readers’ financial situation or investment objectives. We advise any readers of this content to seek their own advice. Without the approval of Pepperstone, reproduction or redistribution of this information isn’t permitted.

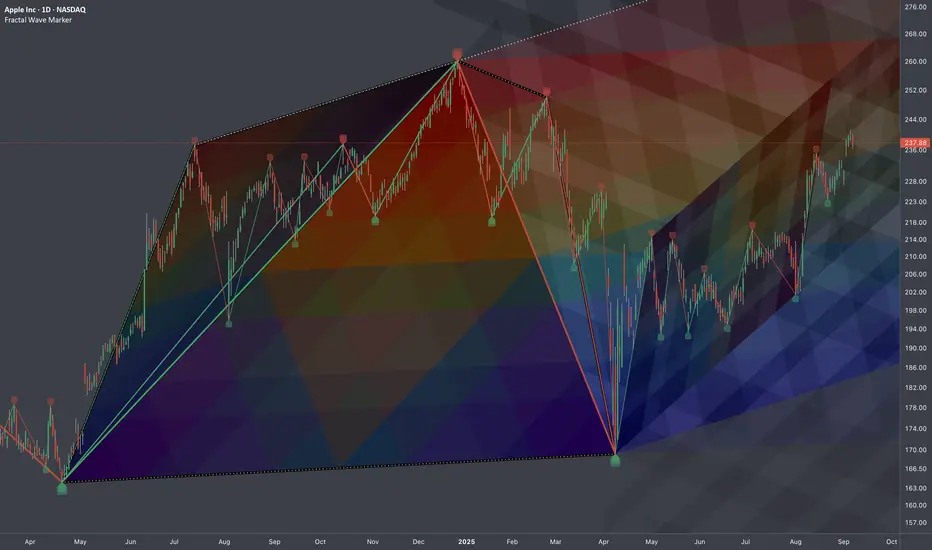
$AAPL: Interplay of ShapesResearch Series
Given multitude of historic motions in highlighted area
I'd like to study their impact on future wave encoding processes
Commodity Futures Trading in the Global Market1. Historical Evolution of Commodity Futures Trading
Ancient Trading Roots
Commodity trading dates back thousands of years, with evidence from Mesopotamia and Ancient Greece showing contracts for the future delivery of crops.
In Japan during the 17th century, rice futures were traded at the Dojima Rice Exchange, one of the earliest organized futures markets.
The Chicago Board of Trade (CBOT)
Established in 1848, CBOT standardized forward contracts into formal futures contracts.
Grain farmers in the U.S. Midwest needed to protect themselves against unpredictable prices, while buyers wanted stable supply at predictable rates.
Futures contracts solved this by locking in future delivery prices, reducing uncertainty.
Expansion to Other Commodities
After grains, futures expanded to include livestock, metals, energy, and eventually financial instruments like currencies and interest rates.
By the late 20th century, futures markets had become central not just to commodities but also to global finance.
2. Fundamentals of Commodity Futures
What is a Futures Contract?
A futures contract is a standardized agreement to buy or sell a commodity at a specific price on a future date, traded on an organized exchange.
Key features:
Standardization – Each contract specifies quantity, quality, and delivery terms.
Margin and Leverage – Traders post margin (collateral) to participate, giving them leverage.
Clearinghouses – Ensure counterparty risk is minimized.
Expiration & Settlement – Contracts either settle physically (delivery of the commodity) or financially (cash-settled).
Types of Commodities Traded
Agricultural Commodities – Wheat, corn, soybeans, coffee, sugar, cotton.
Energy Commodities – Crude oil, natural gas, gasoline, heating oil.
Metals – Gold, silver, copper, aluminum, platinum.
Soft Commodities – Cocoa, rubber, palm oil.
3. Key Participants in Global Commodity Futures
1. Hedgers
Farmers, miners, oil producers, airlines, and manufacturers use futures to protect against price volatility.
Example: An airline buys jet fuel futures to lock in prices and protect against oil price spikes.
2. Speculators
Traders who take positions based on price expectations, seeking profits rather than delivery.
Provide liquidity to the market but also increase volatility.
3. Arbitrageurs
Exploit price discrepancies across markets or between spot and futures prices.
Help align prices globally.
4. Institutional Investors
Hedge funds, mutual funds, pension funds use commodity futures for diversification and inflation hedging.
5. Market Makers & Brokers
Facilitate transactions, ensuring continuous liquidity.
4. Global Commodity Futures Exchanges
United States
Chicago Mercantile Exchange (CME Group) – World’s largest futures exchange, trading agricultural, energy, metals, and financial futures.
New York Mercantile Exchange (NYMEX) – Key hub for energy futures like crude oil and natural gas.
Intercontinental Exchange (ICE) – Specializes in energy and soft commodities like coffee, cocoa, and sugar.
Europe
London Metal Exchange (LME) – Benchmark for industrial metals like copper, aluminum, and nickel.
Euronext – Trades agricultural and financial futures in Europe.
Asia
Shanghai Futures Exchange (SHFE) – Major player in metals, energy, and chemicals.
Multi Commodity Exchange of India (MCX) – Leading Indian commodity exchange.
Tokyo Commodity Exchange (TOCOM) – Focuses on energy, metals, and rubber.
Singapore Exchange (SGX) – Emerging hub for global commodities, especially Asian benchmarks.
5. Mechanics of Commodity Futures Trading
1. Opening a Position
Long position (buy futures) if expecting prices to rise.
Short position (sell futures) if expecting prices to fall.
2. Margin System
Initial margin: Upfront collateral to open a position.
Maintenance margin: Minimum balance required.
Daily mark-to-market adjusts accounts based on price movements.
3. Settlement Methods
Physical delivery: Actual exchange of the commodity.
Cash settlement: Price difference settled in cash, common for financial futures.
4. Price Discovery
Futures markets reflect expectations of supply and demand.
Example: Rising oil futures may signal geopolitical risks or expected shortages.
6. Importance of Commodity Futures in the Global Economy
1. Risk Management
Producers and consumers hedge against adverse price swings.
2. Price Discovery
Futures prices act as benchmarks for global trade.
Example: Brent crude futures influence oil prices worldwide.
3. Market Liquidity
Continuous trading provides deep liquidity, enabling efficient transactions.
4. Economic Indicators
Futures prices offer insights into future economic trends (e.g., rising copper prices suggest industrial growth).
7. Challenges and Criticisms
1. Speculative Excess
Excessive speculation can cause price bubbles, hurting real producers and consumers.
Example: 2008 oil price surge partly attributed to speculative trading.
2. Volatility & Market Shocks
Futures markets can amplify volatility, especially during geopolitical or weather-related events.
3. Market Manipulation
Large players can influence prices (e.g., "cornering the market").
4. Regulatory Concerns
Need for global harmonization as futures markets are interconnected.
8. Regulation of Global Commodity Futures
United States
Commodity Futures Trading Commission (CFTC) oversees futures and options markets.
Europe
European Securities and Markets Authority (ESMA) sets regulations under MiFID II.
Asia
Each country has its regulator: SEBI (India), CSRC (China), FSA (Japan).
Global Cooperation
IOSCO (International Organization of Securities Commissions) works on harmonizing standards.
9. Technological Transformation in Commodity Futures
Electronic Trading
Transition from open-outcry trading floors to electronic platforms like CME Globex.
Algorithmic & High-Frequency Trading (HFT)
Now dominate volumes, enabling faster price discovery but raising flash crash risks.
Blockchain & Smart Contracts
Potential to streamline settlement, reduce fraud, and improve transparency.
10. Case Studies
Oil Futures (NYMEX WTI & ICE Brent)
Key benchmarks for global crude oil pricing.
The 2020 COVID-19 crisis saw WTI futures turn negative, highlighting the complexities of storage and physical delivery.
Gold Futures (COMEX)
A hedge against inflation and financial instability.
Demand spikes during geopolitical crises or economic uncertainty.
Agricultural Futures (Chicago Board of Trade)
Corn, wheat, and soybean futures directly impact global food prices.
Conclusion
Commodity futures trading is more than just speculation—it is the nervous system of the global economy. From farmers securing prices for their harvest to airlines hedging jet fuel, and from speculators driving liquidity to regulators ensuring stability, futures markets are indispensable.
They provide transparency, risk management, and global price discovery. Yet they also bring challenges of volatility, speculation, and regulatory complexity.
Looking ahead, technological innovation, sustainability concerns, and the rise of emerging markets will reshape global commodity futures trading. Its importance will only grow as commodities remain the backbone of human survival, industrialization, and energy security.
Apple earnings on the 29th look to shortApple earnings on the 29th look to short for the monthly gap at 124 only visible when selecting monthly mode.

AAPL Game Plan: September 8, 2025
Premarket Range:
* High: $240.34 (PMH estimate from chart)
* Low: $239.01(AHL)
* PDH: $241.32
* PDL: $238.49
* VWAP + 13EMA clustered around $239.75–239.85
🟢 BULLISH SCENARIO: Range Break + Squeeze Toward $241.32–243.00
Trigger:
* Strong open above \$240.34 (PMH)
* Price holds above AHH \$239.86
* SPY + NQ support the move
* VIX remains < 16
Setup:
* Long on reclaim of $240.34 or bounce off \$239.86 support flip
* Use tight stop below VWAP or \$239.
Targets:
* TP1: \$241.32 (PDH)
* TP2: \$243.00
* TP3 (Stretch): $248.00 (macro level from wedge top)
Risk:
* False breakout → snap back into range
NEUTRAL SCENARIO: Ping-Pong Between \$239.00 and \$240.34**
Trigger:
* Price stuck inside PM range
* No volume confirmation
* VIX drifting but not spiking
Setup:
* Fade extremes:
* Long near \$239.01–239.20 (AHL + EMA zone)
* Short near \$240.20–240.34 (PMH test)
* Avoid middle zone congestion (\$239.50–239.80)
Targets:
* TP1: \$239.85
* TP2: \$240.30
* TP3: \$238.70 if range breaks down
Risk:
* Breakout trap while fading levels
🔴 BEARISH SCENARIO: Breakdown to \$238.00–236.00
Trigger:
* Break below AHL $239.01 → then PDL \$238.49
* VIX rises > 16
* SPY breaks VWAP / tech turns red
Setup:
* Short on flush through \$238.49 with volume
* Can also short failed reclaim of $239.01 after break
* Keep stop tight above $239.50–239.60
Targets:
* TP1: $237.75
* TP2: $236.00 (major DP level)
* TP3 (Stretch): $228.00 (
AAPL Market Preview for Monday, September 8Price Action & Market Structure
* AAPL is trading around 239.8, consolidating after multiple rejections near 240.5–241.3.
* Price is still within a rising channel, but short-term momentum is softening.
* Structure remains constructive as long as price holds 239–238.5 support.
Key Levels
* Resistance (Upside Caps):
* 240.6–241.3 → Immediate resistance.
* 245.0 → 2nd Call Wall resistance.
* 247.5–250 → Heavy Gamma resistance zone.
* Support (Downside Floors):
* 239.0 → Key intraday support.
* 238.0–238.5 → Secondary support buffer.
* 232.5–227.5 → HVL + Put Support anchor.
Options Sentiment (GEX & IV)
* GEX: Tilted slightly bullish, with Calls outweighing Puts.
* IVR: Low at 11.6, showing options are pricing muted moves.
* Gamma Walls:
* 245–250 = Strong upside cap.
* 232.5–227.5 = Strong downside support zone.
Indicators
* MACD (15m): Slight bearish momentum showing, indicating short-term consolidation.
* Stoch RSI: Resetting near oversold, which could allow another push higher if buyers step in.
Scenarios for Today
Bullish Case (if 239 holds):
* Hold above 239.0, push through 240.6–241.3.
* Targets → 243.0 → 245.0, with possible extension to 247.5–250 Gamma Wall.
Bearish Case (if 239 breaks):
* Lose 239.0, test 238.0–238.5.
* If weakness accelerates, deeper pullback toward 235.0 → 232.5 HVL zone.
Trading Thoughts
* Longs: Favor dip entries near 239.0–238.5 with bounce confirmation, targeting 241–243.
* Shorts: Fade rejection at 241–243, stops above 244.5.
* Stops:
* Longs → below 238.0.
* Shorts → above 244.5.
Summary
AAPL sits at a pivotal 239–240 zone. Holding this support opens upside to 243–245, with Gamma resistance capping higher at 247.5–250. If 239 fails, expect a quick dip into 238–235, with stronger support at 232.5–227.5. Low IVR suggests controlled moves, but GEX positioning favors mild bullish bias unless support breaks.
⚠️ This analysis is for educational purposes only and not financial advice. Always manage risk properly.
APPL Breakout Play: Ride Momentum w/ $250 Calls
# 🚀 APPL Swing Trade Setup (2025-09-07)
**Bias:** 🔥 Bullish (multi-timeframe momentum confirmed)
**Conviction:** ⭐⭐⭐⭐ (75%)
### 📊 Key Takeaways
* ✅ Daily RSI = 73.3 → strong momentum
* ✅ Multi-timeframe alignment → bullish trend continuation
* ⚠️ Volume = \~1.0x avg → breakout needs confirmation
* ⚖️ Options flow = neutral (C/P \~1.0) → no big institutional push
* 🌐 VIX \~15 → low vol = cheap calls
---
### 🎯 Trade Plan
* **Instrument:** \$APPL
* **Direction:** CALL (single-leg)
* **Strike:** \$250
* **Expiry:** 2025-09-19
* **Entry Price:** 0.78 (ask)
* **Profit Target:** 1.56 (≈100% gain)
* **Stop Loss:** 0.47 (\~40% risk)
* **Size:** 1 contract (adjust to 2% account risk)
* **Entry Timing:** Open (or breakout > \$241.5 + volume)
---
### 🧠 Rationale
* \$250 strike = liquid (OI 36k+) & balanced delta/liquidity
* Low VIX keeps theta drag manageable (12 DTE)
* Upside continuation likely toward \$246–\$250 zone
* Defined risk/reward w/ simple naked call
---
### ⚠️ Risks
* ❌ Failed breakout → fast premium decay
* ⏳ Time decay accelerates after 7–8 DTE
* 📰 Macro/news shocks = whipsaw risk
---
## 📌 TRADE DETAILS (JSON)
```json
{
"instrument": "APPL",
"direction": "call",
"strike": 250.0,
"expiry": "2025-09-19",
"confidence": 0.75,
"profit_target": 1.56,
"stop_loss": 0.47,
"size": 1,
"entry_price": 0.78,
"entry_timing": "open",
"signal_publish_time": "2025-09-07 13:19:26 EDT"
}
```
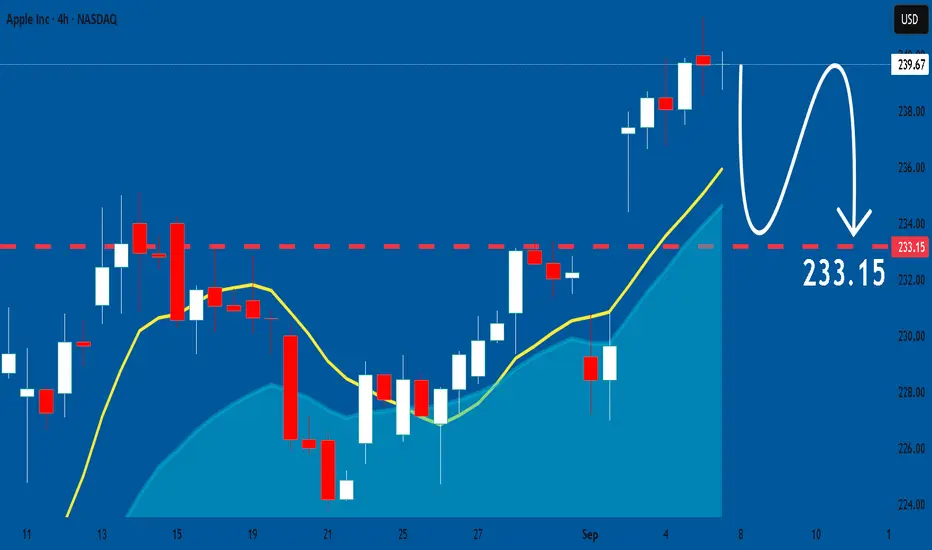
APPLE Massive Short! SELL!
My dear friends,
Please, find my technical outlook for APPLE below:
The price is coiling around a solid key level - 239.67
Bias - Bearish
Technical Indicators: Pivot Points High anticipates a potential price reversal.
Super trend shows a clear sell, giving a perfect indicators' convergence.
Goal - 234.66
About Used Indicators:
The pivot point itself is simply the average of the high, low and closing prices from the previous trading day.
Disclosure: I am part of Trade Nation's Influencer program and receive a monthly fee for using their TradingView charts in my analysis.
———————————
WISH YOU ALL LUCK
AAPLE Inc. High Probale Plummet To Be TriggeredAAPL which has been on a quite an ecstacy in the past few weeks might have its Joy short-lived due to activities its did below. Activities being 'The change of character"
APPLE: Will Start Falling! Here is Why:
The price of APPLE will most likely collapse soon enough, due to the supply beginning to exceed demand which we can see by looking at the chart of the pair.
Disclosure: I am part of Trade Nation's Influencer program and receive a monthly fee for using their TradingView charts in my analysis.
❤️ Please, support our work with like & comment! ❤️
AAPL LongBroader Market Structure (AAPL 1H):
The broader structure has shifted bullish after a strong recovery from the lows near $223.78, which marked the prior Change of Character (CHoCH) to the downside. Since then, price has reclaimed higher levels and printed a clear Break of Structure (BOS) above $241.32, confirming bullish continuation. This transition suggests sellers have lost control and the market is now favoring higher highs unless a key demand zone is broken.
Supply and Demand Analysis:
The demand zone between $237–239 is fresh, formed after buyers stepped in with strength and drove price impulsively higher. This makes it a strong candidate for a retest and bounce. The deeper demand around $228–230 remains significant since buyers created a clean rally from that base, but given that it has been tapped once already, it is somewhat weaker than the higher zone. On the supply side, there’s no immediate strong resistance overhead until new highs are formed, giving bulls open space to extend the move.
Price Action Within Marked Region:
At present, price is consolidating near the top after breaking higher, and the projection suggests a pullback into the $237–239 demand zone before resuming upside. The candles are showing reduced momentum after the breakout, hinting that a corrective retracement is likely before continuation.
Current Trade Bias & Outlook:
The bias is bullish, with the expectation that price will dip into demand before resuming higher toward $245–248. The invalidation level for this bullish outlook would be a break below $228, which would erase the recent BOS and tilt structure bearish again.
Momentum & Candlestick Behavior:
Momentum favors buyers, as seen in the impulsive move that cleared prior highs. However, current candles show signs of slowing, which supports the idea of a short-term pullback before buyers re-enter. No reversal patterns have formed yet at the highs, so the structure still supports continuation.
