Tesla - Technicals are pretty clear!🚨Tesla ( NASDAQ:TSLA ) respects the triangle:
🔎Analysis summary:
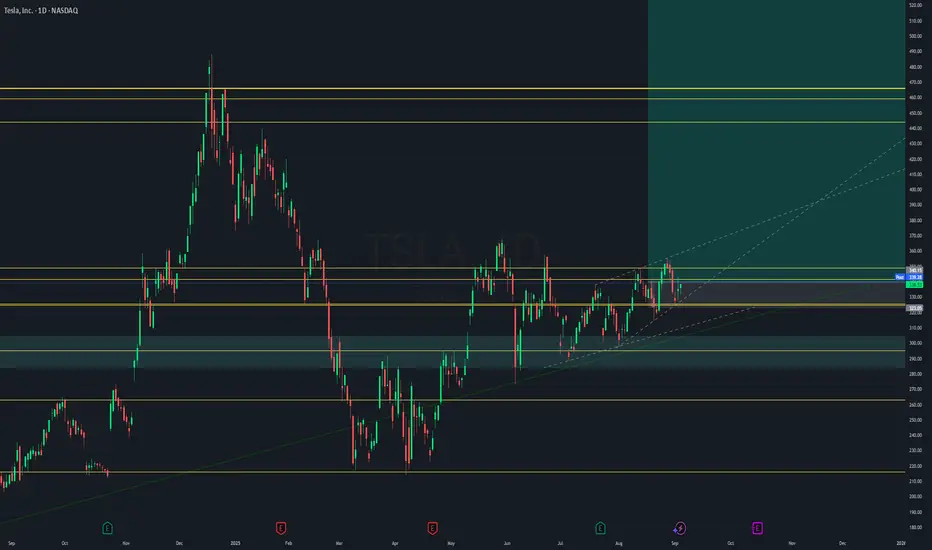
Ever since Tesla was listed on the Nasdaq, we saw perfect cycles playing out. Since 2021, Tesla has once again been consolidating within a bullish triangle pattern. Therefore with the recent bullish break and retest, it becomes more and more likely that Tesla will break out soon.
📝Levels to watch:
$400, $250
SwingTraderPhil
SwingTrading.Simplified. | Investing.Simplified. | #LONGTERMVISION
TL0 trade ideas

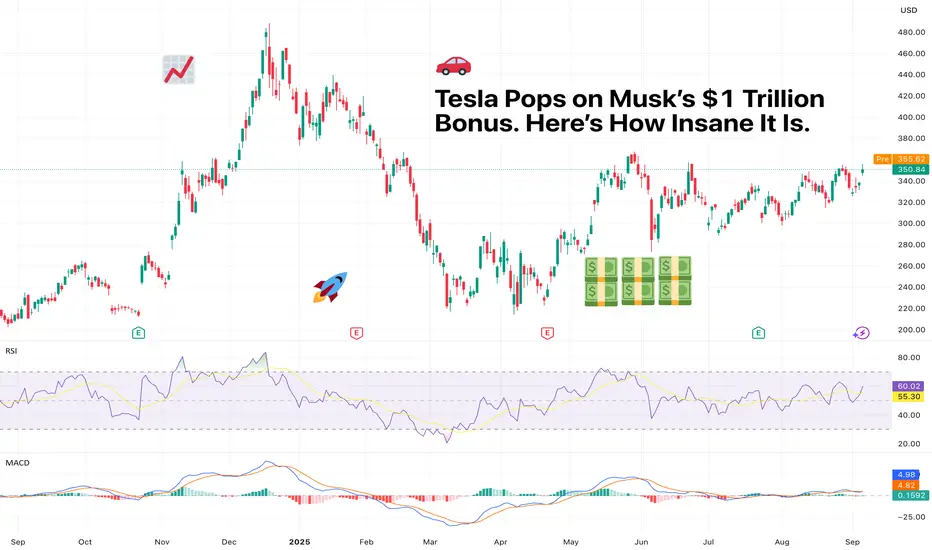
Tesla Pops on Musk’s $1 Trillion Bonus. Here’s How Insane It Is.The mother of all KPIs.
Elon Musk has a new carrot dangling in front of him, and it’s not a Mars colony or a flamethrower.
Tesla’s board is asking investors to approve a bonus so massive, so absurd, so galaxy-brained, that it makes past compensation packages look like pocket change.
Ready? We’re talking about the potential for a $1 trillion payday if Musk manages to drag Tesla to an $8.5 trillion valuation. In ten years.
That’s nearly eight times where it is today. So let’s unpack just how unhinged this deal really is, why Tesla stock popped on the news, and what it would take for Musk to collect.
🚀 The Trillion-Dollar Tease
Tesla stock NASDAQ:TSLA climbed 3.6% Friday on the back of this announcement, not because anything happened then and there, but because something could happen ten years out.
The board dropped the proposal in a securities filing, outlining that Musk could receive up to 423 million shares – worth over $1 trillion – if Tesla smashes through a series of market cap and operational milestones.
In other words, the board is looking to lock Musk in and make sure he doesn’t get distracted by rocket launches, robot brains, or tweeting memes about NPCs at 2 a.m.
💰 What’s the Catch?
The catch is that this isn’t free money. To claim the full $1 trillion, Musk has to lead Tesla into uncharted corporate territory: Boost Tesla’s market cap from $1 trillion to $8.5 trillion by 2035. That’s more than double Nvidia’s NASDAQ:NVDA current valuation ($4.2 trillion) and equal to the GDP of Japan, Germany, and the UK, combined.
Deliver 12 million more EVs (as of this summer, Tesla has managed about 8 million in its entire history).
Land 10 million autonomous driving subscriptions.
Register and operate 1 million robotaxis (Not on the market right now).
Sell 1 million AI robots (Not on the market right now).
Increase adjusted earnings from $13 billion to $400 billion. That’s a 24x jump in profit.
Next stop? Tesla’s earnings report ( Earnings Calendar for reference) in about a month from now.
🪄 The Board’s Spin
Tesla Chair Robyn Denholm called the package “fundamental to Tesla becoming the most valuable company in history.” Translation: Elon, please.
In a letter to shareholders, the board said the award “aligns extraordinary long-term shareholder value with incentives that will drive peak performance from our visionary leader.”
Which is corporate-speak for: We know he’s mercurial, but this should keep him tethered for at least a decade.
⚡ The Stakes for Tesla
Tesla’s stock reaction says investors are cautiously optimistic – emphasis on cautiously. Shares have been down nearly 30% since mid-December, plagued by slowing EV sales , rising competition, and Musk’s very public political feuds (including an ongoing rift with President Trump that’s cost Tesla federal EV incentives).
To make matters trickier, Tesla’s brand halo isn’t as shiny as it used to be. EV rivals like BYD, Rivian, Hyundai, and Mercedes are cutting into Tesla’s dominance, while price cuts have compressed margins.
Analysts expect Tesla to deliver 1.6 million vehicles this year, down from last year’s totals. On top of that, revenue continues to slide, lower by 12% in the last quarter , indicating a shrinking business.
So why the big gamble? Because if this plan works, Tesla wouldn’t just catch up – it would become the undisputed king of EVs, autonomous driving, AI robotics, and energy storage. In other words, a full-blown tech empire.
💰 Musk’s 25% Solution
Part of Musk’s motivation here isn’t just about the money – though a trillion-dollar payday to one person is actually insane. Musk has repeatedly said he wants at least 25% voting control over Tesla to feel “comfortable” keeping his focus there.
Under the proposed plan, if Musk hits every target, his stake in Tesla would rise to 25% from his current holdings of 12%, giving him outsized influence over its future direction. That means if Tesla’s valuation is at $8.5 trillion, he’d be holding shares worth $2.12 trillion. But if he misses? He gets nothing. Zero.
It’s a high-wire act for both Musk and shareholders: reward him with historic wealth if he delivers, but don’t overpay if he falls short.
🤖 Robotaxis, Humanoids, and AI Dreams
A key piece of this plan hinges on Musk’s boldest vision yet: turning Tesla into an autonomous AI platform. Forget just cars – think fleets of robotaxis generating recurring subscription revenue and Optimus humanoid robots replacing repetitive labor in warehouses, factories, and maybe even households.
If this strategy pays off, Tesla won’t just be an automaker – it’ll be an AI-powered infrastructure company. But right now, that future is priced into a present that still depends on selling Model Ys and Cybertrucks.
🔍 The Market’s Split Personality
Wall Street’s reaction has been mixed, and here’s why:
The bulls argue that Tesla has the innovation engine, the brand, and, yes, the Musk factor to make the impossible happen. They point to SpaceX’s reusable rockets and Nvidia’s AI dominance as proof that moonshots sometimes land.
The bears see the trillion-dollar pay package as monopoly money that’ll never be real. Between slowing EV demand, Tesla’s underwhelming Q2 deliveries, and Musk’s penchant for side quests, they’re skeptical Tesla can hit even half of these KPIs.
🏁 The Bottom Line
Tesla’s proposed Musk mega-package is nothing short of audacious. It’s an all-in bet on:
Explosive growth in EVs and autonomous driving
Turning Tesla into an AI + robotics powerhouse
Keeping Musk’s focus locked on Tesla instead of Mars, memes, or political campaigns
Is the plan bold? Absolutely. Is it risky? Without a doubt.
Off to you : Do you believe Musk deserves the “One-Trillion-Dollar Man” (or $2T) title? Or is all that a desperate move to keep him around? Share your thoughts in the comments!
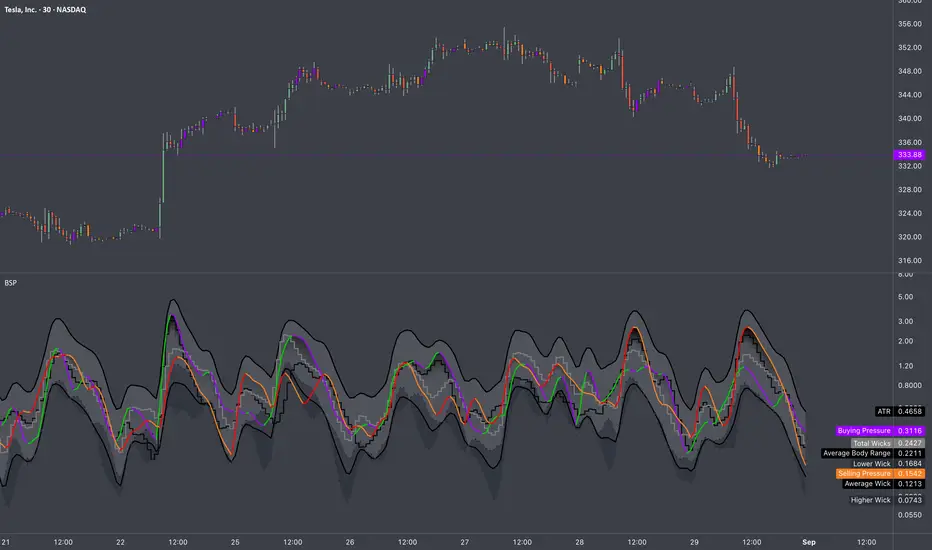
Candle Metrics: BSP Guide🏛️ RESEARCH NOTES
Buying & Selling Pressure measures the internal dynamics within a candlestick that shapes the trends. It dissects each OHLC range into distinct components made of Body Range, Higher & Lower Wicks, making it possible to quantify bullish & bearish parts of bar range. BSP doesn’t just point direction, it reveals magnitude - how much buyers or sellers injected into the move, and whether that push is accelerating or running out of steam.
Unlike Average %Δ , which uses separate conditional averaging by "count", BSP processes candles through periodic averaging that makes it more responsive for important transitions like: divergence from volatility benchmarks. incentive change (spotting early reversals after impulsive move), filtering false breakouts, confirming trend strength, etc.
⚖️ Candle Metrics
Buying Pressure (BP)
Represents the degree of upward displacement relative to prior reference points.
🟢 Rising BP: Signals growing demand absorption and accumulation, often preceding sustained advances.
🟣 Falling BP: Indicates waning participation from buyers; persistent declines while price rises suggest trend fatigue and elevated risk of retracement.
Selling Pressure (SP)
Captures downward displacement relative to highs and prior closes.
🔴 Rising SP: Reflects heightened distribution activity, consistent with institutional supply or hedging flows.
🟡 Falling SP: Suggests sellers are withdrawing liquidity; commonly observed near troughs as downside momentum exhausts.
Average True Range (ATR) Rising ATR = higher volatility, falling ATR = calm markets. High BP in low ATR = stealth accumulation.
Body Range (BR) Large bodies show conviction, small bodies = indecision. Strong BR + rising BP = solid bullish trend.
Higher Wick (HW) Long HW means rejection at highs (supply). Falling HW means buyers are holding gains.
Lower Wick (LW) Long LW means rejection at lows (demand). Falling LW signals less defense from buyers.
Total Wicks (TW) More wick length = intrabar battles. Expansion of TW with small bodies often precedes reversals.
Average Wick (AW)
Rising AW = more volatility both ways. Falling AW = cleaner, directional trend.
Darkened Tops
Tracks the strongest side (BP or SP) over the lookback period. Its primary function is to dynamically highlight moments of extreme pressure. When either the Buying or Selling Pressure value reaches the level, the tops would . This provides an immediate visual cue for:
Black Colored Plot: A signal that the current buying or selling pressure has hit a significant level relative to recent history, often pointing to climactic activity or a potential exhaustion point.
◇ Practical Interpretation
Trend Confirmation BP ↑, SP ↓, BR ↑, ATR steady → sustainable directional advance.
Exhaustion BP ↓, SP steady or rising, HW ↑ = buyers tiring at resistance, overextended into supply.
Accumulation BP ↑, LW ↑, TW ↑ but ATR low = stealth buying before breakout.
Distribution SP ↑, HW ↑, TW ↑ = sellers unloading into strength. supply emerging into strength, caution warranted.
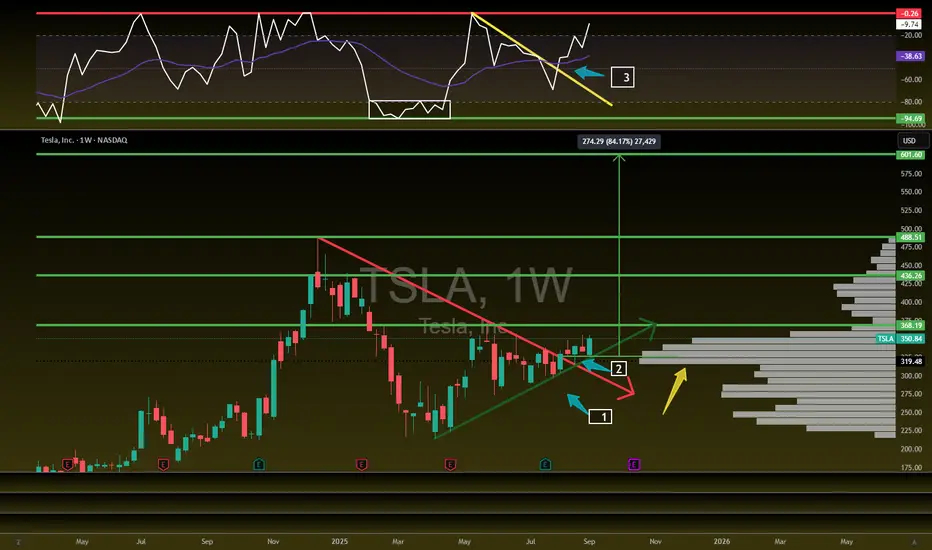
Tesla Looks Primed!NASDAQ:TSLA Looks primed!
Bullish as all getup!
Breaking out-Volume Shelf-Bullish Willy
Targets: $368/ 436/ 488/ 601
TSLA support $324.48 has to hold for longTSLA bounced off $35 range support this morning on 4 hour was oversold. Needs to hold $324.48 bottom of uptrend support to see wave 5 target of $426 otherwise the trade is no longer valid and will need to wait for another support and oversold condition to go long

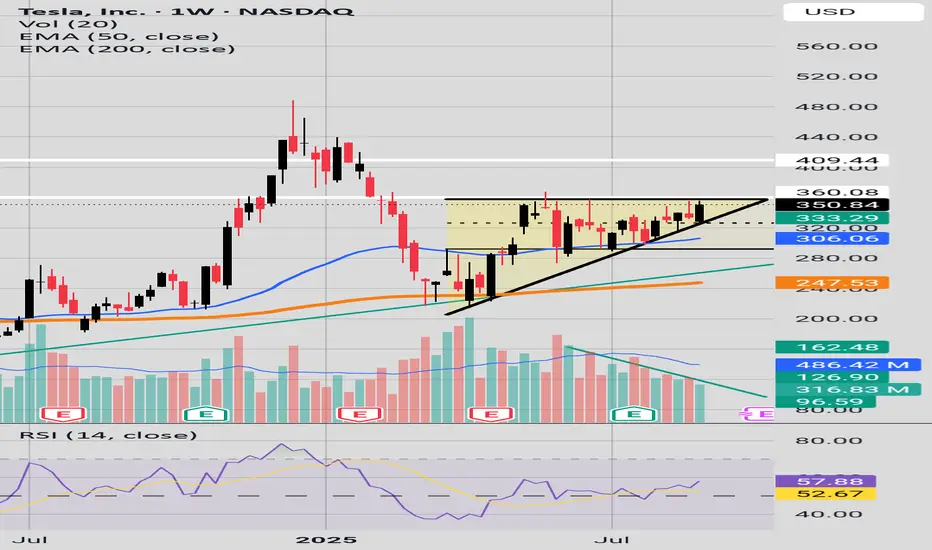
Tesla - The triangle is still valid!🚔Tesla ( NASDAQ:TSLA ) remains totally bullish:
🔎Analysis summary:
If we look at the chart of Tesla, we can see a very long term consolidation over the past four years. This, however, does not mean that the bullrun is over but rather preparing for the next bullish move. We just have to wait for the bullish ascending triangle pattern breakout.
📝Levels to watch:
$400
SwingTraderPhil
SwingTrading.Simplified. | Investing.Simplified. | #LONGTERMVISION

What do you think about TSLA?!If it goes down it cannot be a small move. If it goes up it will be a common pattern (consolidation then breakout).
I think we well see it in two or three days!

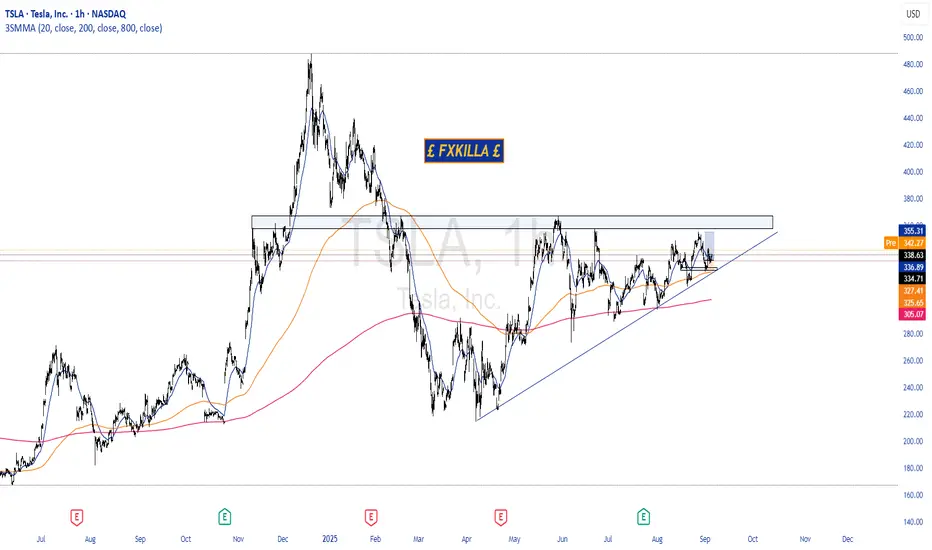
TESLA HIGH PROBABILITY SETUP SOON!!!🚨 TESLA HIGH PROBABILITY BUY SETUP 🚨
* Here We Can See Clearly The Next Potential Move For Tesla Coming Hours/Days.
* Keep Your Eyes Close On Your Trading Positions.
* Happy PIP Hunting Traders.
£ FXKILLA £
TSLA TESLA Institutional Roadmap for September Discount ZoneTesla NASDAQ:TSLA – Institutional Roadmap for September: Discount Zones, Breakout Triggers, and Squeeze Targets
Tesla continues to trade as one of the clearest institutional battlegrounds in the market. The footprints in option open interest, dark pool levels, and anchored VWAP create a very precise map for swing traders who want to follow the flow rather than fight it.
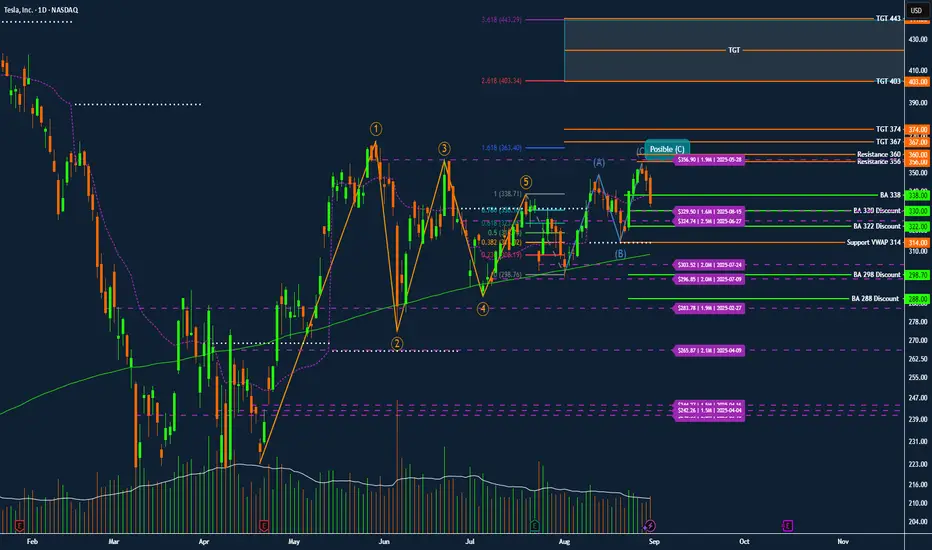
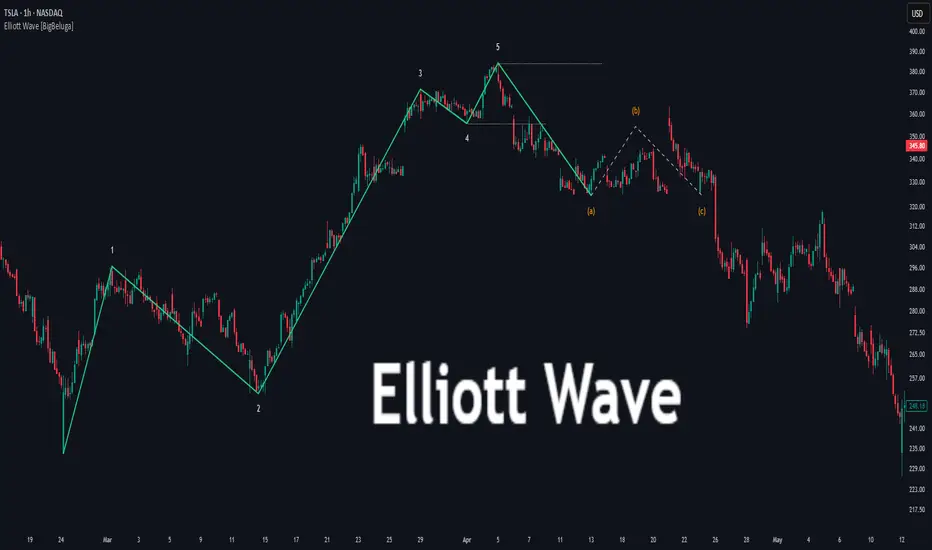
Elliott Wave Context
Tesla completed a clean 1–5 impulse wave earlier in the year. The stock has since been retracing in an A–B–C corrective structure, with wave (C) still tentative. The rejection near 348–350 matches heavy open interest and serves as a possible end of (C). However, the high-volume sell candle at 333 suggests the correction may continue lower into discount zones before the next advance.
Institutional Discount Zones
330–332: first defense level, with recent dark pool support
322: deeper discount aligned with the 0.618 retracement
314: anchored VWAP level, a frequent institutional reload zone
298–300: July dark pool activity and strong confluence support
288: extreme discount zone from February
Breakout Triggers
BA 338: first bullish-above confirmation trigger, but only valid if defended by volume
356–360: the real battleground. Massive call open interest is stacked here. A clean break above confirms institutional participation
Upside Targets
367–374: first expansion target and resistance magnet
403: Fibonacci 2.618 extension
443: Fibonacci 3.618 extension
467: Fibonacci 4.236 extreme target if momentum continues
Flow and Volume Notes
Options flow shows concentrated put open interest between 300–320, confirming institutional defense of that floor. Call interest is stacked heavily at 350–360, which explains the recent rejection zone. The latest sell-off candle came with above-average volume, reinforcing the probability of a deeper retest into 330–322 or even 314 VWAP.
Trading Roadmap
If Tesla holds 330–332, expect a potential reversal with BA 338 as confirmation.
If 330 breaks, expect a move into 322 or 314, and a flush to 298 remains possible.
If 356–360 is reclaimed with volume, the squeeze path opens toward 367–374.
Breaking above 374 accelerates directly into 403 and later 443.
Conclusion
Tesla remains a classic institutional shakeout pattern rather than a breakdown. The map is clear: watch the discount zones for accumulation, use BA 338 and the 356–360 battleground as confirmation triggers, and follow the roadmap toward 374, 403, and 443 once the breakout validates. Patience is edge. Institutions will reload near VWAP and dark pool levels, while retail chases 350. Follow the Darkpools not the noise.
Long way to go - BEARISHNASDAQ:TSLA still has a long runway before robotaxis deliver meaningful revenue or global car sales improve (if at all). Lower rates are a prerequisite and execution from Musk remains critical. Despite the chatter, this is not a bullish breakout. It’s a large symmetrical triangle forming as we enter seasonally weak months, with global EV sales slowing, robotaxi rollout lagging, and ongoing political overhang.

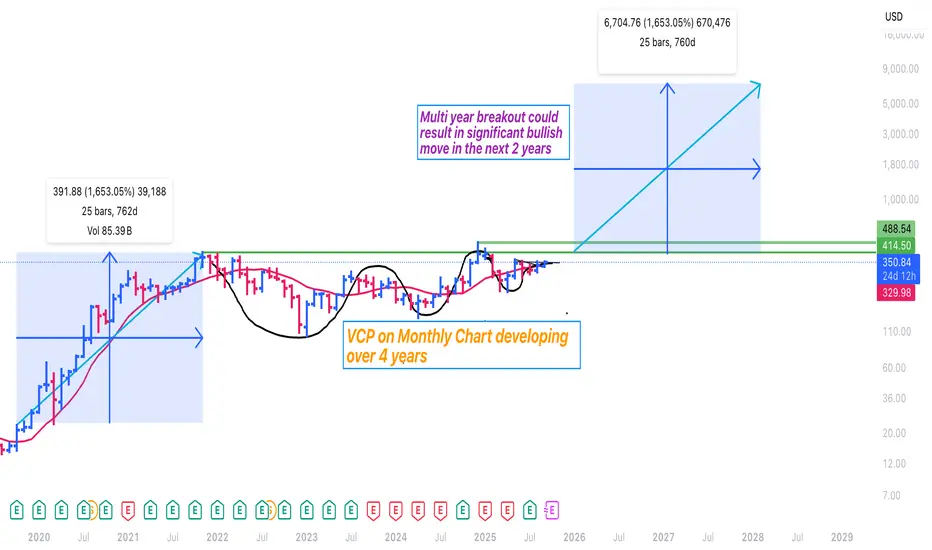
$TSLA showing multi year VCP & a breakout would be Bullish+++AB = CD pattern could emerge once broken out of this multi-year VCP / consolidation pattern that is developing in $TSLA.
Price action seem to indicate $280 - 310 is the likely bottom and odds favor a signficant move up!
Let's see how it pans out.
I am bullish.
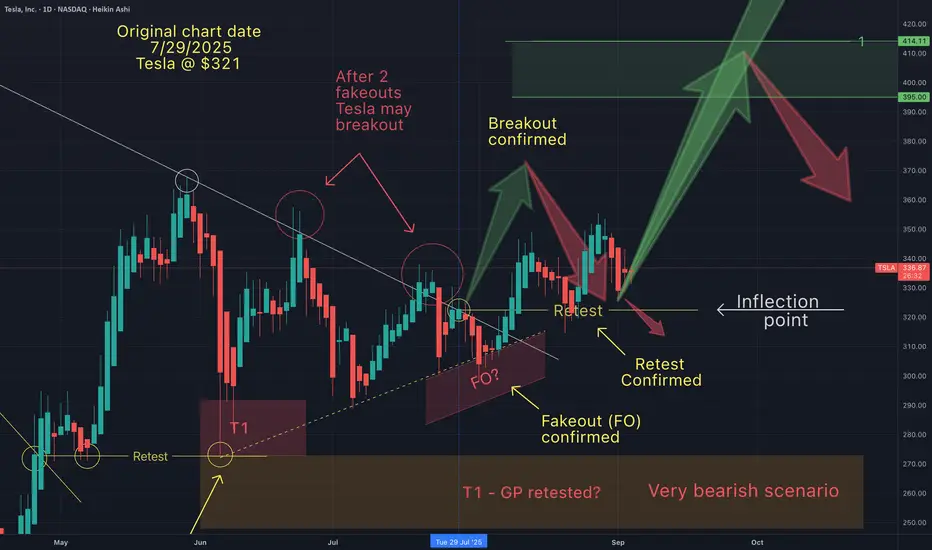
You will ask yourself, "how did he know Tesla would do that"?On July 29th I suggested that Tesla would drop into into my fakeout zone, followed by the usual "stop hunt-rise" and retrace (to test the breakout).
Once I saw 2 fake breakouts of trend, I expected this breakout to occur (after the fakeout). Once the breakout occurs, we always see the retest. The only question that remains is Tesla going to continue to follow the path outlined on my chart?
If Tesla does what it almost always does during this pattern, the answer is yes. There may be a quick liquidity grab below the breakout low, before continuing up towards my Bullish T1 target.
But keeping in mind, that Tesla is at an inflection point, I'm prepared for the possibility of a bearish scenario. Anticpating price action helps me quickly invalidate my trade ideas, so I can pivot accordingly. Therefore if Tesla holds resistance below $300, I expect a test of my bearish T2 target.
For now I remain cautiosly bullish until proven otherwise.
May the trends be with you.
Mastering the Elliott Wave Pattern🔵 Mastering the Elliott Wave Pattern: Structure, Psychology, and Trading Tips
Difficulty: 🐳🐳🐳🐋🐋 (Intermediate+)
This article is for traders who want to understand the logic behind Elliott Waves — not just memorize patterns. We’ll cover the structure, trader psychology behind each wave, and practical tips for applying it in modern markets.
🔵 INTRODUCTION
The Elliott Wave Theory is one of the oldest and most respected market models. Developed by Ralph Nelson Elliott in the 1930s, it proposes that price doesn’t move randomly — it follows repeating cycles of optimism and pessimism.
At its core, Elliott Wave helps traders see the bigger picture structure of the market. Instead of focusing on one candle or one setup, you learn to read the “story” across multiple waves.
2021 BTC TOP
TESLA Stock
🔵 THE BASIC 5-WAVE STRUCTURE
The foundation of Elliott Wave is the Impulse Wave — a 5-wave pattern that moves in the direction of the trend.
Wave 1: The first push, often driven by smart money entering early.
Wave 2: A correction that shakes out weak hands but doesn’t retrace fully.
Wave 3: The strongest and longest wave — fueled by mass participation.
Wave 4: A pause, consolidation, or sideways correction.
Wave 5: The final push — often weaker, driven by late retail traders.
🔵 THE CORRECTIVE 3-WAVE STRUCTURE
After the 5-wave impulse comes a 3-wave correction , labeled A-B-C.
Wave A: First countertrend move — often mistaken as a dip.
Wave B: A false rally — traps late buyers.
Wave C: A stronger decline (or rally in bearish market), often equal to or longer than Wave A.
Together, the impulse (5) and correction (3) form an 8-wave cycle .
🔵 PSYCHOLOGY BEHIND THE WAVES
Each wave reflects trader psychology:
Wave 1: Smart money positions quietly.
Wave 2: Retail doubts the trend — “it’s just a pullback.”
Wave 3: Mass recognition, everyone piles in.
Wave 4: Profit-taking and hesitation.
Wave 5: Final retail FOMO.
A-B-C: Reality check, trend unwinds before cycle resets.
🔵 TRADING WITH ELLIOTT WAVES
1️⃣ Spot the Trend
Identify whether the market is in an impulse (5-wave) or correction (A-B-C).
2️⃣ Use Fibonacci for Validation
Wave 2 usually retraces 50–61.8-78.6% of Wave 1.
Wave 3 often extends 161.8% of Wave 1.
Wave 5 is often equal to Wave 1.
3️⃣ Trade the Highest-Probability Waves
Wave 3 (trend acceleration) and Wave C (correction completion) are often the cleanest opportunities.
4️⃣ Don’t Force It
Not every market move is Elliott Wave. Use it as a framework, not a rulebook.
🔵 COMMON MISTAKES
Over-labeling: Trying to force waves where they don’t exist.
Ignoring timeframes: Waves may look different across scales.
Trading every wave: Not all waves are high-probability setups.
🔵 CONCLUSION
The Elliott Wave Theory isn’t about perfection — it’s about perspective. It helps traders understand market cycles, recognize crowd psychology, and anticipate major turning points.
Use Elliott Wave as a map , not a prediction tool. When combined with confluence — volume, liquidity zones, or trend filters — it becomes a powerful edge.
Do you trade with Elliott Waves? Or do you think they’re too subjective? Share your experience below!
TESLA 5TH SEP 2025 PRICE ACTION Price action for Tesla is here. I have clearly explained my plan on how to trade tesla considering every factor in market.
NOTE: OPTION WILL BURN YOUR CAPITAL

Check if it can rise above 347.21
Hello, traders!
Follow us to get the latest updates quickly.
Have a great day!
-------------------------------------
(TSLA 1D chart)
The key is to determine which direction the price breaks out of the two support and resistance areas of 268.07-311.48 and 347.21-382.40.
For a step-up trend to occur, the price must remain above 334.09-347.21.
However, a step-up trend is highly likely only if the price rises above the support and resistance levels of 382.40 and 421.06 on the 1W and 1M charts.
Even so, a larger increase is likely if the price rises above the 334.09-347.21 range on the 1D chart.
-
The 268.07-311.48 range also falls within the HA-High indicator.
Therefore, it's important to remember that the current position is not a buy position, but rather a sell position.
However, for new buys, it's best to initiate them when support is found near the M-Signal indicator on the 1M chart, if possible.
Therefore, when the 268.07-311.48 range acts as a support zone, it can be considered a buying opportunity.
However, since it's within the HA-High indicator zone, trades should be executed with short and quick responses.
The key volatility period is around October 7th, but before that, we should check the movements around September 5th and September 12th.
At this time, the trend is likely to be determined by which direction the price moves: the 268.07-311.48 range or the 347.21-382.40 range.
-
Thank you for reading to the end.
I wish you successful trading.
--------------------------------------------------

TESLA TO $410 SOON? (September 7, 2025)In this video, we look at Tesla stock from numerous time frames together at the evidence presented for new all-time highs

“Resistance Blocks at $340, Path Tilts Toward $320 Support”📖 Crown Point Research
1️⃣ Date & Time : 02/09/2025 - 09.01 PM
2️⃣ Fundamental News (If Any)
No major Tesla-specific earnings/policy events overnight.
Movement is being driven purely by structure and technical flows.
3️⃣ Public Sentiment & Human Behaviour
Retail psychology: Traders rushed in expecting a bounce near $330, treating it as a “cheap entry.”
Institutional behaviour: Distribution visible at $340+ zones, where resistance repeatedly capped upside.
Social Signal: Headlines frame “dip-buying,” but structural read shows controlled pullback, not reversal.
4️⃣ Current Structure
Macro
Resistance: $340–360 zone.
Support: $320
Stage: Macro candles remain in Maturity → Exhaustion phase.
Micro
Resistance: $332–335 zones
Support: $320 → $315.
Behaviour: Controlled pullbacks, failed rescues
5️⃣ Projection
Primary Path (65%): Continuation lower toward $320 support.
Alternate Path (25%): Short bounce attempt if $332–335 reclaimed, but capped below $340.
Low Path (10%): Breakout above $340–345 → requires strong macro rescue (policy or global shock).
6️⃣ Pullback Levels
Shallow: $330–332 zone.
Medium: $325.
Deep: $320 (critical Titan Wall support).
7️⃣ Final View
Bias: Bearish intraday → Path remains toward $320
8️⃣ Essence (Philosophy Line)
“ Microframes are in Collapse. Pullbacks are rebalances, not rescues. B earish flow dictates.”
9️⃣ Disclaimer
⚠️ This analysis is shared for educational and research purposes only. It is not financial advice, trading advice, or investment recommendation. Market decisions are entirely your own responsibility.

TSLA – Daily Fib Continuation: Watch $350–355 for Break & Go (taTL;DR: TSLA is holding above the 0.5 retrace (~$334). A daily close above $355 opens $366 → $372 → $381. Lose $334 → $330 and the setup degrades toward $324/314.
Thesis
The prior swing’s Fibonacci map shows confluence at $350–355 (0.786/0.886 + round-number supply).
Structure is compressing above $334–335 support. A clean break/hold above $355 would likely trigger an extension leg to 1.272/1.414/1.618 at $366.7 / $372.5 / $381.0.
Below $334, momentum likely rotates back into the $330 → $324 → $314 demand ladder.
Key Levels
Support: $334.5 (0.5), $330.0 (0.382), $323.9 (0.236), $314.2 base
Trigger/Resistance: $347–350 (0.786–0.886), $355.5 (1.0)
Upside Targets: $366.7 (1.272) / $372.5 (1.414) / $381.0 (1.618) then $396.7 / $408.0 / $422.2 / $444.9
Trade Plan (alerts + confirmations, no auto-trading)
Scenario A – Break & Go (preferred)
Confirmation: Daily close above $355.
Execution: Drop to M15 for structure; take a retest of $350–355 as support.
M5 confirm: Bullish engulfing + MACD uptick.
Risk: Invalidation below $347 (or last M15 swing-low).
Targets: $366.7 → $372.5 → $381.0 (scale out).
Scenario B – Pullback Buy
Price tags $334–336 and holds (wicks rejection).
M15 forms HL; M5 prints engulfing + MACD cross.
Risk: Invalidation below $329.9.
Targets: $347 → $355 → $366.7.
Scenario C – Bearish Breakdown
Invalidation of bull idea: Full M15 body below $329.9 → look for $324 → $314. No longs until reclaimed.
Risk (keep it tight)
Risk %: 0.5–1% per idea.
Placement: Below invalidation or last M15 swing.
Scaling: 30/30/40 across targets; move stop to breakeven after Target 1.
TESLA Under Pressure! SELL!
My dear followers,
This is my opinion on the TESLA next move:
The asset is approaching an important pivot point 350.79
Bias - Bearish
Safe Stop Loss - 354.45
Technical Indicators: Supper Trend generates a clear short signal while Pivot Point HL is currently determining the overall Bearish trend of the market.
Goal - 343.14
About Used Indicators:
For more efficient signals, super-trend is used in combination with other indicators like Pivot Points.
Disclosure: I am part of Trade Nation's Influencer program and receive a monthly fee for using their TradingView charts in my analysis.
———————————
WISH YOU ALL LUCK

Inflection PointWe have now and ascending triangle forming with key resistance around the 360$ price area.
RSI is above 50.
Volume levels drying up.
Are we soon going to get a possible breakout to the 400$ price levels are a retreat to the green trend line around 290$?
TESLA RISING SUPPORT|LONG|
✅TESLA is trading in an uptrend
Along the rising support line
Which makes me bullish biased
And the pair is about to retest the rising support
Thus, a rebound and a move up is expected
With the target of retesting the level above at 350$
LONG🚀
✅Like and subscribe to never miss a new idea!✅

tesla sellToday play is a put this is going to be a sell based on the down trend as we can higher lows and lower lows
im doing puts around 325
I understand that gaps will happen but based on this chart
I'm only looking for today's prices
for a average buyer and sell I believe they can get cheaper price
in the long run
i know this is my option but i believe
q1 you buy
q2 you hold
q3 look to take profit or exit position
q4 look for set ups
i don't trades stocks as much just its so slow but that's me
have fun and enjoy the day

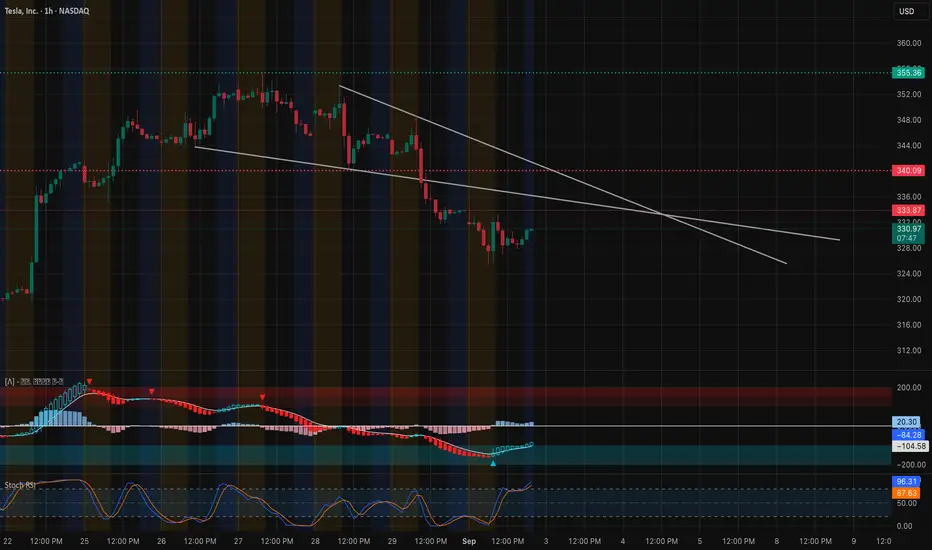
TSLA Technical Analysis-September 3Tesla remains in a short-term downtrend, capped by descending resistance lines. Price is hovering around 330, trying to base after multiple failed rallies. MACD is curling higher, showing early bullish divergence, while the Stoch RSI is lifting from oversold, suggesting some room for upside momentum if buyers step in.
* Resistance:
* First test sits at 333–335, right at descending trendline resistance.
* If cleared, the next upside targets are 342.5 → 345, with stronger supply stacked at 350–355.
* Support:
* Immediate support is 325, reinforced by the put wall.
* A breakdown below opens risk into 322.5 and deeper toward 315–314, which marks the recent swing low and key defense for bulls.
Trend remains pressured, but signs of stabilization are emerging — bulls need to reclaim 335 to start shifting momentum.
🔍 Options / GEX Confirmation
* Resistance Clusters:
* 335 confirmed as resistance by options flow.
* Above that, 345–350 aligns with major call walls, matching chart supply zones.
* Support Layers:
* 325 → strong put support.
* 322.5 and 320 → layered GEX support levels.
* 315 → final line of defense; losing this risks accelerating downside.
This confirms the chart setup: TSLA is boxed between 325–335, with the next directional break likely defining momentum into next week.
🎯 Trade Scenarios
* Bullish: Break above 335 with volume → upside targets 342.5 → 345 → 350.
* Bearish: Rejection at 333–335 and failure to hold 325 → opens downside to 322.5 → 315.
🧠 Final Take
TSLA is at a decision zone between 325–335. Bulls defending 325 and breaking 335 could spark a rally into the 340s, but failure to hold support risks a retest of 315. Options data confirms these levels as the critical battlegrounds.