TESLA RISING SUPPORT|LONG|
✅TESLA is trading in an uptrend
Along the rising support line
Which makes me bullish biased
And the pair is about to retest the rising support
Thus, a rebound and a move up is expected
With the target of retesting the level above at 350$
LONG🚀
✅Like and subscribe to never miss a new idea!✅
TL0 trade ideas

TSLA Creeping up from original triangle, but still in a larger tNASDAQ:TSLA continues to take the stairs of worry up to my trading signal target from the original triangle analysis, $386, but the pattern has morphed into what appears to be a barrier triangle now as price struggles at $360 with a series of higher lows.
RSI is comfortable at the EQ with room to grow while price remains above the daily pivot.
Analysis is invalidated below wave (C) $284
Safe trading
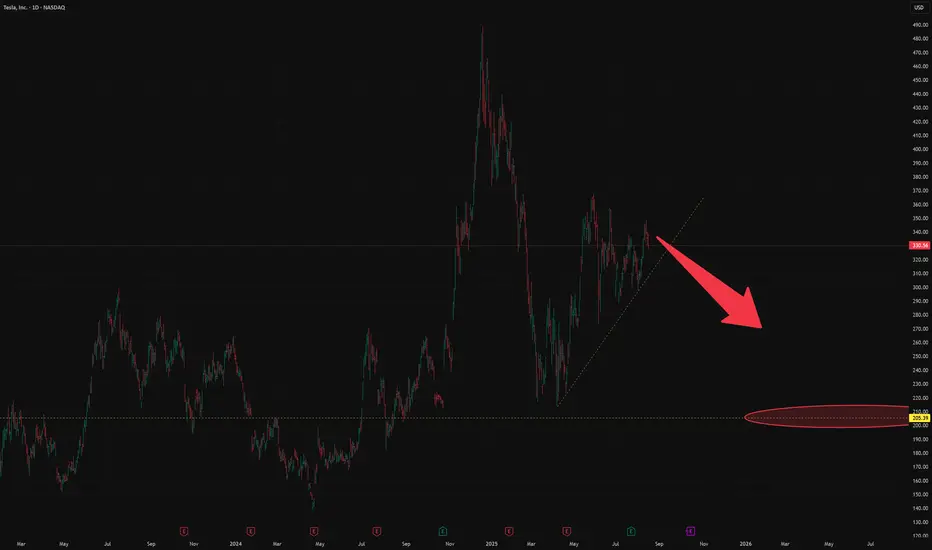
We are not positive about TeslaFollow us and don't miss a next idea on Global Markets
The impact of tariffs and expiring EV credits is expected to pressure future US deliveries and regulatory credit revenue in the near term
Elon Musk: Well, we're in this weird transition period where we will lose a lot of incentives in the US. Slab incentives actually in many other parts of the world. But we'll lose them in the US. Across all of it at the relatively early stages of autonomy. On the other hand, autonomy is most advanced and most available from a regulatory standpoint in the US. Does that mean we could have a few rough quarters? Yeah. We probably could have a few rough quarters. I'm not saying that we will, but we could. Q4, Q1, maybe Q2.
Revenue -12% y/y ( decline for the first time in 10 years)!!!
EPS 0,27 $ agj vs 0,39 $ estimated
FCF -89% y/y but still positive ( just 146 M$)
CAPEX for 2025 increased
EBITDA dropped by 7.8%.
Price to Sales 12,7
P/B 14
Expensive
We expect declining of the stock price to 210 $
And, yes, many still regard Tesla as a car manufacturer, but this is not a correct view of the company. Later in our blog we will touch on the question of how to correctly look at the brainchild of Elon Musk.
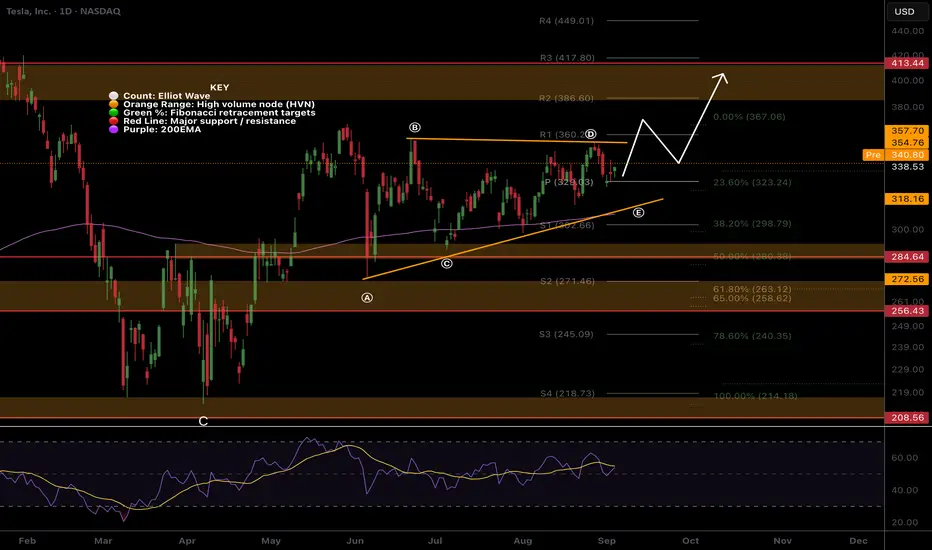
TESLA Bullish Wave C still underway...NASDAQ:TSLA is a tough count, the entire macro chart looks like a complex correction (wave 4?) with many series of 3 wave structures.
A triangle in wave B of the current wave appears complete, leading to a terminal thrust up with a target of the High Volume Node resistance at $410 followed by a poke above the swing high touching the R1 pivot at $548.
RSI remains at the EQ.
Analysis is invalidated below the wave B triangle.
Safe trading

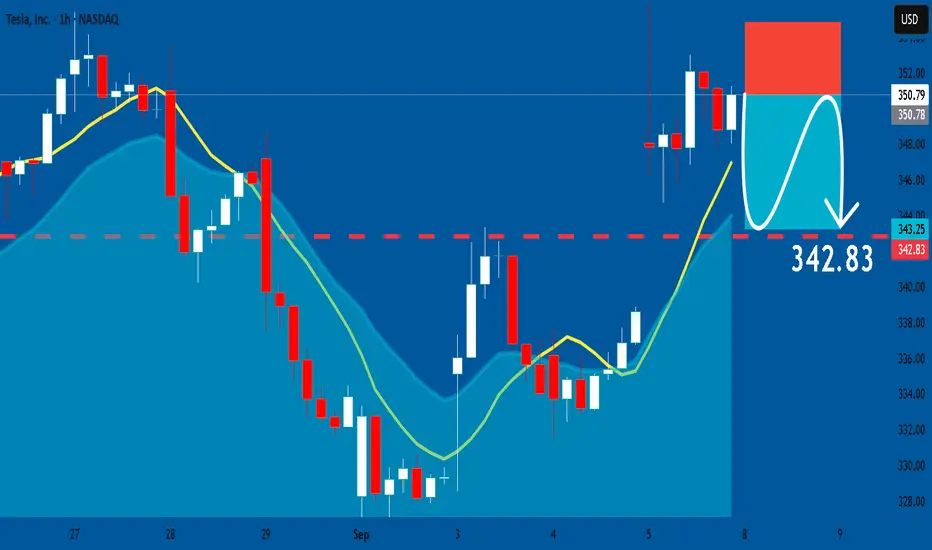
TESLA: Bearish Continuation & Short Signal
TESLA
- Classic bearish setup
- Our team expects bearish continuation
SUGGESTED TRADE:
Swing Trade
Short TESLA
Entry Point - 350.79
Stop Loss - 354.84
Take Profit - 342.83
Our Risk - 1%
Start protection of your profits from lower levels
Disclosure: I am part of Trade Nation's Influencer program and receive a monthly fee for using their TradingView charts in my analysis.
❤️ Please, support our work with like & comment! ❤️
TSLA (daytrading) 2 plan for itPlan 2 could be possible because:
(p1 price is on sma 50 d1,p2 could be sma 200)
TSLA still has a small gap below that might need to be filled.
This week doesn’t look good for the overall market.
I will continue to watch it closely

$TSLA Daily Bands Finally TightNASDAQ:TSLA daily bands are finally tight. Can see a bigger move here. OTM calls came in at the lows this morning. 350C 11/21/25 @ 25.43 for 2.5 million
TSLA Market Preview for Monday, September 8, 2025,
Price Action & Market Structure
* TSLA is trading around 354–356, up +3.6% overnight, showing relative strength compared to SPY.
* Price broke out of a descending wedge, now consolidating near upper channel resistance.
* Momentum is cooling after the strong overnight run, but structure remains bullish unless price loses 352 support.
Key Levels
* Resistance Zones (Upside Targets):
* 357.5–360 → Near-term rejection zone.
* 362.5 → 365.0 → GEX cluster + Call Wall resistance.
* 370.0 → Major Gamma Wall / Highest positive NET GEX.
* Support Zones (Downside Risk):
* 352.8–354.0 → Local breakout retest support.
* 343.8–345.0 → Strong structural support + previous demand zone.
* 335.0 → HVL anchor + Put hedge support.
Options Sentiment (GEX & IV)
* GEX: Balanced but slightly tilted bullish → Calls 49.4% vs Puts 3.5%.
* IVR: Low at 8.5, options are cheap → potential for strong directional move.
* Gamma Walls:
* 370 → Strong Call Wall (cap).
* 335 → Strong Put Support (floor).
This positioning suggests TSLA is “boxed” between 335 support vs 370 resistance, with intraday swings possible.
Indicators
* MACD (15m): Just made a bearish crossover after extended green histogram → short-term pullback risk.
* Stoch RSI: Rolling down from overbought → signals cooling momentum.
Scenarios for Today
Bullish Case (favored if 352 holds):
* Hold 352–354 support → reclaim 357.5.
* Targets: 362.5 → 365 test, with potential extension to 370 Gamma Wall.
Bearish Case (watch if 352 breaks):
* Lose 352 → retrace quickly to 345 zone.
* If heavy market weakness (SPY fails), could extend to 335 HVL.
Trading Thoughts
* Scalp Longs: Look for bounces near 352–354 support, aiming for 360+.
* Fade Shorts: If price rejects 357.5–360 zone without volume confirmation.
* Stops:
* Longs → below 352.
* Shorts → above 360.5.
Summary
TSLA remains stronge as long as 352 holds, bulls have room to test 360–365 and possibly squeeze toward 370. If 352 fails, expect a deeper retrace to 345–335. Options flow leans bullish, but intraday volatility is likely.
⚠️ This analysis is for educational purposes only, not financial advice. Manage risk and confirm with live price action before trading.

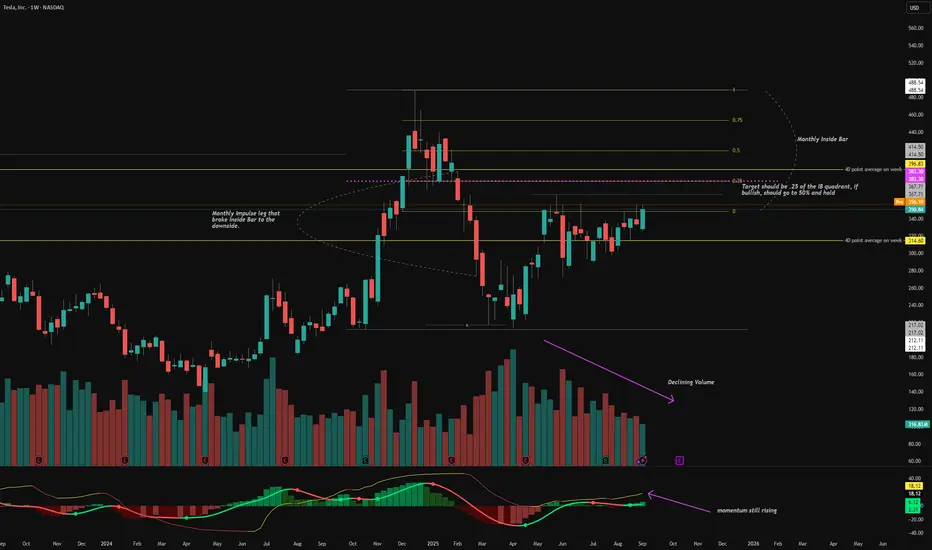
TSLA - LongTSLA looks to be heading to the 25% of the Inside Bar on the monthly. Need to have strict risk management on this incase it falls through. Weekly looks good, with targets of 25% and 50% of the Inside Bar quadrant. TSLA also moves an average 40 points per week, so the upside looks more accurate then downside.
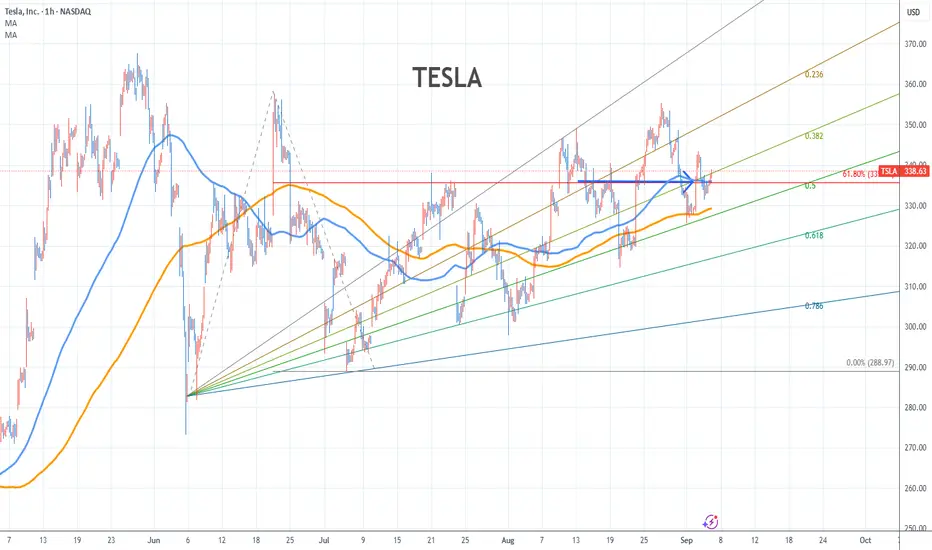
Tesla Stock Chart Fibonacci Analysis 090425Trading Idea
1) Find a FIBO slingshot
2) Check FIBO 61.80% level
3) Entry Point > 335/61.80%
Chart time frame:B
A) 15 min(1W-3M)
B) 1 hr(3M-6M)
C) 4 hr(6M-1year)
D) 1 day(1-3years)
Stock progress:A
A) Keep rising over 61.80% resistance
B) 61.80% resistance
C) 61.80% support
D) Hit the bottom
E) Hit the top
Stocks rise as they rise from support and fall from resistance. Our goal is to find a low support point and enter. It can be referred to as buying at the pullback point. The pullback point can be found with a Fibonacci extension of 61.80%. This is a step to find an entry-level position. 1) Find a triangle (Fibonacci Speed Fan Line) that connects the high (resistance) and low (support) points of the stock in progress, where it is continuously expressed as a Slingshot, 2) and create a Fibonacci extension level for the first rising wave from the start point of the slingshot pattern.
When the current price goes over the 61.80% level, that can be a good entry point, especially if the SMA 100 and 200 curves are gathered together at 61.80%, it is a very good entry point.
As a great help, TradingView provides these Fibonacci speed fan lines and extension levels with ease. So if you use the Fibonacci fan line, the extension level, and the SMA 100/200 curve well, you can find an entry point for the stock market. At least you have to enter at this low point to avoid trading failure, and if you are skilled at entering this low point, with the fibonacci6180 technique, your reading skill of to chart will be greatly improved.
If you want to do day trading, please set the time frame to 5 minutes or 15 minutes, and you will see many of the low points of rising stocks.
If you prefer long-term range trading, you can set the time frame to 1 hr or 1 day
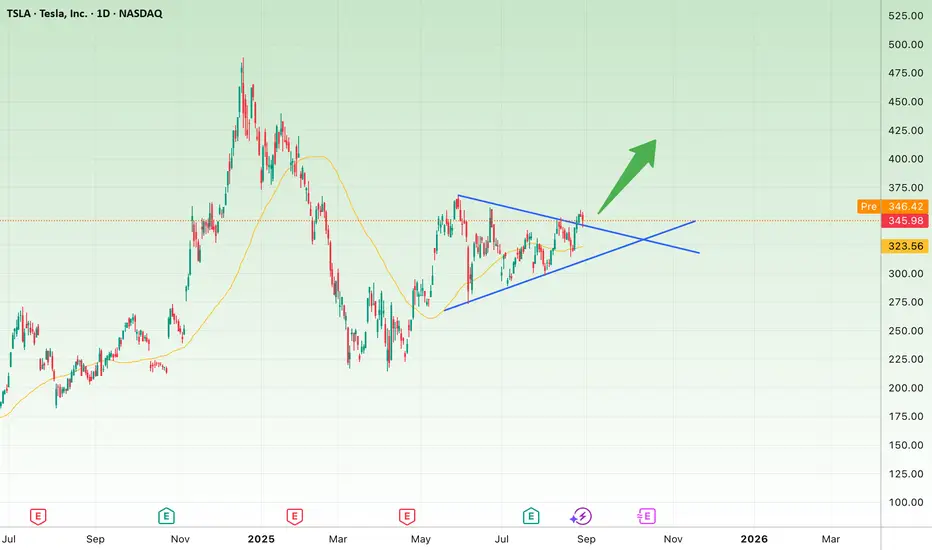
Tesla (TSLA) Breaking Out – Is the Next Bull Run Starting?📊 TSLA Technical Analysis (Daily Timeframe)
After a period of consolidation inside a Symmetrical Triangle, Tesla’s price is now showing a potential breakout to the upside. This could be an early signal for the beginning of a new bullish wave.
🔹 Key Support: $323 – $325
🔹 Next Resistances: $375 and, if broken, higher targets at $400 – $420
The 50-day moving average is currently supporting the uptrend, and a confirmed close above the $346 level would strengthen the bullish outlook.
⚠️ However, if the price fails and breaks below $323, the bullish scenario may lose validity and a corrective move could follow.
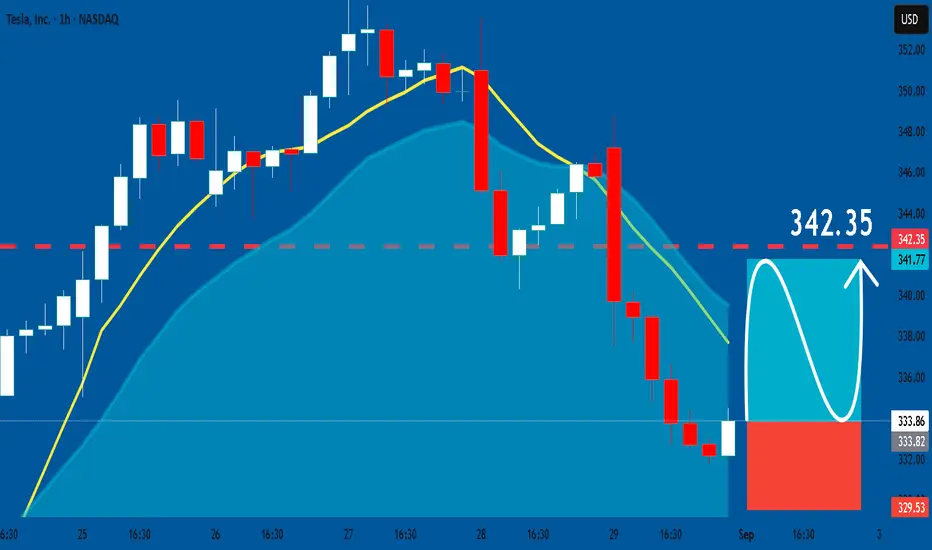
TESLA: Long Trade with Entry/SL/TP
TESLA
- Classic bullish setup
- Our team expects bullish continuation
SUGGESTED TRADE:
Swing Trade
Long TESLA
Entry Point - 333.86
Stop Loss - 329.53
Take Profit - 342.35
Our Risk - 1%
Start protection of your profits from lower levels
Disclosure: I am part of Trade Nation's Influencer program and receive a monthly fee for using their TradingView charts in my analysis.
❤️ Please, support our work with like & comment! ❤️
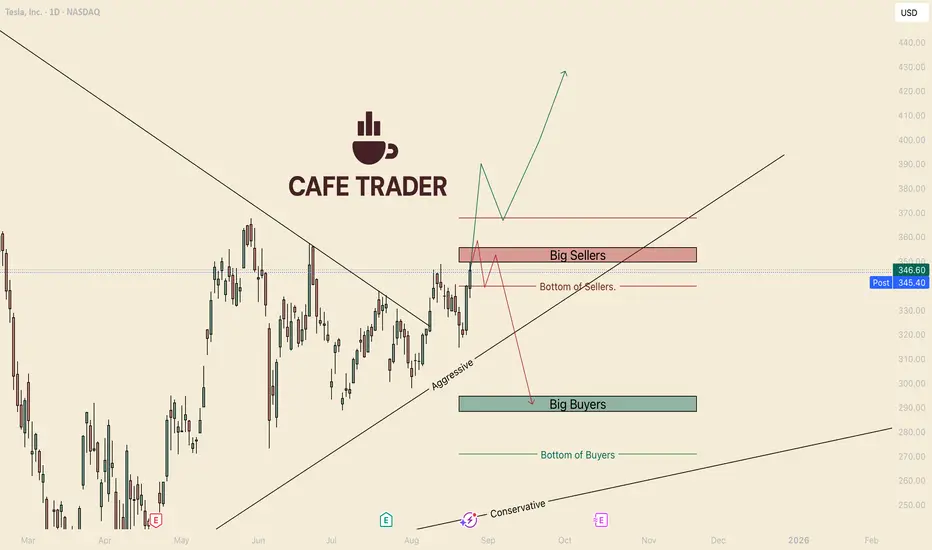
TESLA's Make it or Break it WeekHello I am the Cafe Trader.
Today we are taking another look at Tesla. Everyone knows what a beast this has been in the past, I am going to prep you on what to do when awakens.
As of today, we sit under the last strong seller before the 400's, breaking this and holding (a close above on a Friday) would make a strong case to test highs (minimum).
Overall, I still think there is a strong case for the downside, but this seller determines everything. This is due to the time we have been in the top of the range. So here are your two scenarios
Green Scenario
If Tesla can push through the strong seller zone (roughly 350–365) and actually close above it, then bulls would gain full control. That opens the door for a continuation move toward 400+.
If this happens, I will publish some trade ideas with a new chart.
Red Scenario
If This Seller continues to flush out these buyers, this could spark a large reaction to the downside. In that situation we would be looking for a move back into the big buyer zone around 290. A failure there could drag us all the way to the conservative trend line near 270.
Personally I lean short biased in the next 2-4 weeks, Very bullish over the next few years.
Hope you enjoyed, please DM or comment with questions or another stock you would like analyzed.
Happy Trading
@thecafetrader
TSLA: Rising ChannelUnless some super positive sentiment comes out over the long weekend, I think we will hit that $325 support. Maybe even go below it during next week.
As long as we close above $325 for the week or so, We are cleared to head back up within the channel.
Tesla investors need to understand that until we see meaningful change to revenue, Tesla will continue to chop around. That's how things will be on the hourly, daily, and weekly chart. 2026 '27, '28... Just keep buying and accumulate. Just sit and wait. You're future self will kick you for trying to play this any other way.

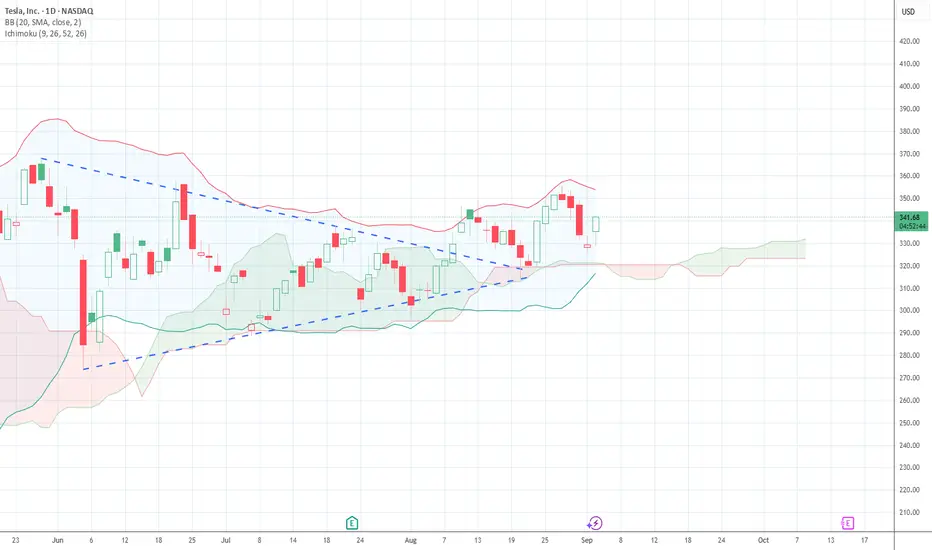
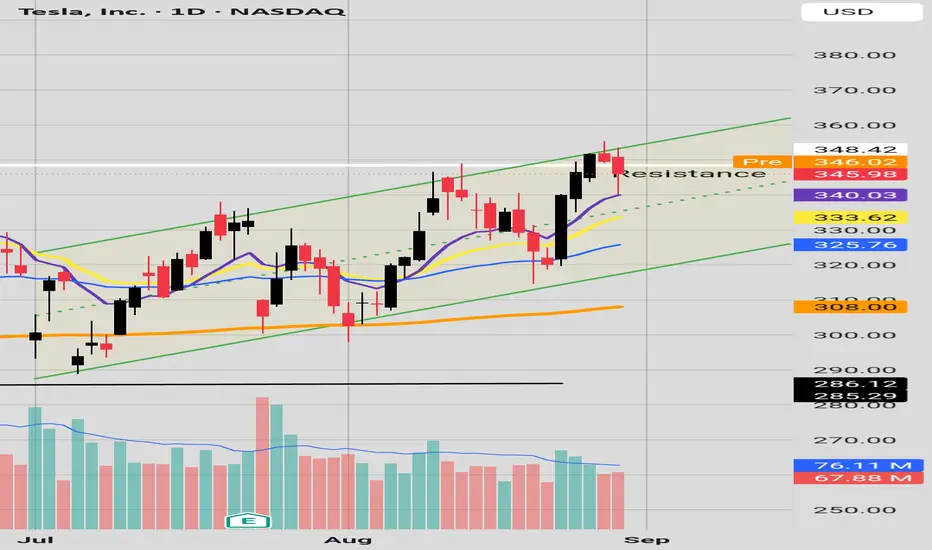
Parallel ChannelWe have Tesala facing resistance on the daily at 345.98 and also resistance in the upward parallel channel. However, the EMA's are lined up nicely 10 in purple 21 in yellow and 50 in blue and 200 in orange. If we get a pullback, hopefully it would just be to the 21 EMA 333.62 and maybe the pull back is over?Let's see if we get a bullish candle on the 10 EMA.
Have a nice day
What Is Symmetrical Distribution, and How Do Traders Use It?What Is Symmetrical Distribution, and How Do Traders Use It?
Symmetrical distribution is a key concept in market analysis, helping traders assess price behaviour and volatility. When price movements are evenly distributed around a central point, it can provide insights into potential market trends. This article explores what symmetrical distribution is, how it compares to other price patterns, and how traders use it in strategies like mean reversion to refine their market approach.
What Is a Symmetric Distribution?
The symmetric distribution definition states that data points are evenly spread around a mean, meaning price movements exhibit balance over time. In simple terms, if price movements form a symmetrical shape when plotted on a chart, it suggests that past price behaviour has been balanced, with roughly equal deviations on either side of the average. This balance is supposed to help traders analyse price trends and volatility.
One of the most well-known symmetrical distribution examples is the normal distribution, often visualised as a bell curve. In markets, this means prices are more likely to cluster around the average and become less frequent as you move further away. For example, if a stock has a mean daily return of 0.5%, most days are believed to see returns close to that figure, while extreme price moves—both positive and negative—will be much rarer.
Symmetrical distribution plays a key role in statistical analysis and quantitative trading. It helps traders assess the probability of certain price movements occurring, particularly when using models that rely on historical data.
How Traders Use Symmetrical Distribution in Market Analysis
Traders use symmetrical distribution to analyse price behaviour, identify potential trading opportunities, and refine their strategies. When price movements are evenly distributed around a central point, it provides a structured way to assess market conditions. This concept is particularly useful in mean reversion strategies.
Mean Reversion Strategies
Symmetrical distribution suggests that prices tend to fluctuate around an average, making mean reversion a widely used approach. Traders applying this strategy assume that when an asset moves significantly away from its mean, it is likely to return over time. Bollinger Bands and moving averages are commonly used to measure price deviations and identify potential turning points. This is particularly relevant in markets with balanced volatility, where extreme price moves are less frequent.
Identifying Market Conditions
Analysing whether a market follows a symmetrical distribution can help traders determine which strategies might be effective. In markets where price movements are balanced, traders may focus on range-bound approaches. In contrast, when distributions become skewed, momentum and trend-following strategies might be more suitable. Recognising these shifts allows traders to adapt their methods to changing market conditions.
How to Identify a Symmetrical Distribution
Identifying a symmetrical distribution in market data involves analysing price behaviour to determine whether movements are evenly spread around a central value. While markets don’t always follow perfect symmetry, traders use statistical tools and visual techniques to assess whether a price distribution aligns with this pattern.
Histogram Analysis
A histogram is one of the simplest ways to check for symmetry in price movements. By plotting historical returns or price changes on a frequency chart, traders can see whether data points cluster evenly around the mean. If the left and right sides of the distribution mirror each other, the market may be exhibiting a symmetrical pattern.
Histograms can also reveal uniform distributions, where all values occur with equal probability, forming a flat graph rather than a bell curve. A symmetric and uniform graph can help distinguish between these two patterns—while a uniform distribution shows no central clustering, a symmetric distribution forms a peak around the mean. Recognising whether a market follows a symmetric or uniform structure helps traders determine which statistical tools are most relevant for analysis.
Statistical Measures: Mean and Standard Deviation
Symmetrical distributions tend to have a mean (average) return that sits at the centre of price movements, with standard deviations determining how far prices typically move from that mean. If price fluctuations are evenly distributed around the mean, it suggests a balanced market where extreme moves are less common.
Skewness and Kurtosis
Two key statistical measures help traders confirm symmetry:
- Skewness quantifies how unevenly data points are distributed around the mean. A value close to zero suggests a symmetrical distribution, while a positive or negative skew indicates an imbalance.
- Kurtosis measures how frequently extreme price movements occur. A symmetrical, normally distributed market typically has a kurtosis value near three.
Visualising with Moving Averages
When plotted on a chart, symmetrical price behaviour often aligns with a stable moving average, where price deviations are relatively even on both sides. In contrast, a market with consistent upward or downward bias may show clear asymmetry.
Symmetrical Distribution vs. Other Market Distributions
However, markets don’t always move in a balanced way. While symmetrical distribution means price movements are evenly spread around a central point, real-world trading often shows skewed distributions, where prices are more likely to move in one direction than the other. Understanding the difference is key to assessing market behaviour.
A positively skewed distribution means there are more small downward price moves, but the occasional sharp rally pushes the average return higher. This often happens in growth stocks or high-volatility assets, where losses are frequent but gains can be explosive. On the other hand, a negatively skewed distribution occurs when prices drift upwards gradually but occasionally experience sudden drops. This is common in carry trades, where traders potentially earn small returns over time but risk significant losses during market shocks.
Skewed distributions challenge the assumption that markets follow normal distribution patterns. For example, many risk models assume a symmetrical spread of price moves, but in reality, market crashes and parabolic rallies occur far more often than a normal distribution would assume. This is why relying solely on symmetrical models can lead to underestimating risk in extreme conditions.
Traders who recognise whether a market is symmetrical or skewed can adjust their strategies accordingly. In a symmetrical market, mean reversion strategies could be more effective, while in a skewed market, trend-following approaches could perform better.
Symmetrical Distribution in Risk Management
Risk management relies heavily on statistical analysis, and symmetrical distribution plays a key role in estimating potential market movements. When price changes are symmetrically distributed, traders can use probability models to assess how far an asset is likely to move within a given timeframe.
Value at Risk (VaR) and Probability Modelling
One common application is Value at Risk (VaR), which estimates the maximum expected loss over a period based on historical price data. If potential returns follow a symmetrical distribution, traders can calculate the probability of losses exceeding a certain threshold. For example, in a normal distribution, around 95% of price movements fall within two standard deviations of the mean, allowing traders to set potential risk limits accordingly.
Risk-Reward Calculations
A symmetrical distribution also helps traders refine their risk-reward ratios. If price movements are evenly distributed, traders can estimate potential returns relative to potential losses with greater confidence. In markets where symmetry holds, a trader aiming for a 3:1 risk-reward ratio can assume that price fluctuations are balanced enough for this structure to be viable.
Position Sizing and Stop Placement
By understanding the distribution of price movements, traders can potentially improve position sizing. If historical data suggests symmetrical price behaviour, traders may adjust their position sizes based on expected volatility. Similarly, stop-loss levels might be set relative to the standard deviation of past price movements, ensuring that exits are placed within a statistically reasonable range.
Limitations and Challenges
While symmetrical distribution provides a structured way to analyse price movements, real-world markets rarely follow a perfect balance. External factors, market psychology, and liquidity shifts often distort price behaviour, making it important for traders to recognise the limitations of relying solely on symmetrical models.
Market Skew and Imbalances
Many assets, especially stocks and commodities, exhibit skewed distributions due to long-term trends, supply-demand imbalances, or macroeconomic factors. Price movements often lean in one direction rather than forming a perfect bell curve.
Impact of News and Events
Unexpected events—such as central bank decisions, earnings reports, or geopolitical developments—can cause sudden price moves that disrupt symmetrical patterns. These events create fat tails, where extreme moves occur more frequently than a normal distribution would suggest.
Volatility Clustering
Markets tend to experience periods of high and low volatility in clusters, rather than maintaining a steady distribution. Symmetrical models often underestimate the likelihood of extreme price swings, leading to miscalculations in risk assessment.
Liquidity and Order Flow Distortions
Large institutional orders and algorithmic trading can cause short-term price imbalances, breaking the assumption of symmetrical price behaviour. These distortions can lead to misleading statistical signals.
The Bottom Line
Symmetrical distribution provides traders with a structured way to analyse price movements, assess volatility, and refine strategies. While markets don’t always follow perfect symmetry, understanding when and how these patterns appear may support your trading analysis.
FAQ
What Is Symmetrical Distribution?
Symmetrical distribution refers to a data distribution where values are evenly spread around the mean. In financial markets, this means price movements are balanced, with equal-sized fluctuations on both sides of an average value.
What Is an Example of Symmetric Data?
A common symmetrical data example is the normal distribution, where most data points cluster around the mean, and extreme values occur less frequently. In trading, an asset with daily potential returns that are equally distributed above and below the mean exhibits symmetry.
What Is the Difference Between Uniform and Symmetric Distribution?
When comparing uniform vs symmetric distribution, the key difference is that a uniform distribution gives each value an equal probability with no central clustering. A symmetrical distribution can have values clustered around the mean.
What Is the Difference Between Symmetrical Distribution and Normal Distribution?
A normal distribution is a common symmetric distribution example, creating a bell-shaped curve. While all normal distributions are symmetrical, not all symmetrical distributions follow the strict characteristics of a normal distribution.
This article represents the opinion of the Companies operating under the FXOpen brand only. It is not to be construed as an offer, solicitation, or recommendation with respect to products and services provided by the Companies operating under the FXOpen brand, nor is it to be considered financial advice.
Tesla Short: Expecting Wave 3 of 3 DownIn this video, I go through the Elliott Wave Analysis for Tesla in detail and talk about how the final corrective wave may not be ideal but is still al valid place for a short. In essence, I think that Tesla should be going for a wave 3 of 3 down that will see it going to $273 for a short-term target and even below $214 based on the general market condition that I have previously discussed.
The stop loss for this idea is above 349.54 but I recommend setting it higher around 351.85.
Good luck!

Tesla, it cant be this easy.Tesla is following the trendlines like a FINRA book would have you believe, which makes me suspicious. Just the same, dont fight whats in front of you. Should run into some resistance from 362ish. Stay nimble.
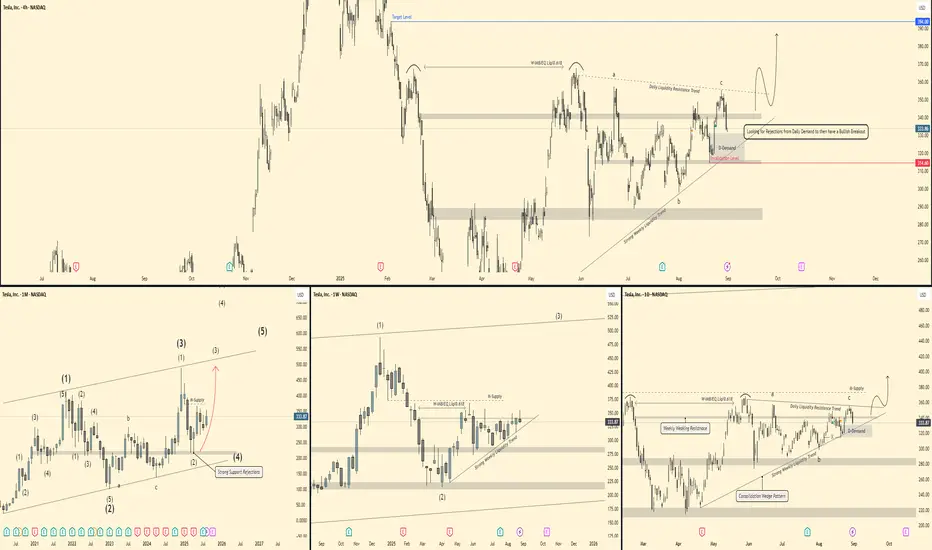
Tesla - Mutli-timeframe breakdown 🕰 Monthly View
Price is respecting a long-term ascending channel.
Strong rejections from support confirm bullish momentum.
Current wave count suggests we are working through a larger impulsive structure – potential for Wave (3) continuation higher.
If momentum holds, upside could target the 450–500 zone in the longer run.
📆 Weekly View
Structure shows a 3-wave correction complete (ABC) into demand.
Price has tapped weekly demand + liquidity trendline.
Currently bouncing, with a breakout potential toward 375–400 (supply zone).
Breakout of the wedge pattern would confirm strength and continuation higher.
📅 Daily View
Price is reacting off Daily Demand (≈320–325 zone).
Strong liquidity resistance trend overhead (≈355–365).
If rejections hold and demand stays valid, a bullish breakout setup forms → target near 390–400.
Invalidation if we close below 314 (daily demand break).
⏱ 4H View
Local liquidity sweep into demand.
Bullish scenario: push toward 350–355 short-term.
Watch for confirmation: rejection candles + momentum shift needed before entry.
🎯 Bias & Trade Idea
Bias: Bullish (buy from demand)
Entry Zone: 320–330 (Daily Demand)
Targets:
Short-term → 355
Mid-term → 390–400
Invalidation: Daily close below 314
⚠️ Risk Note
Tesla is highly volatile. Stick to clear confirmations at demand before entry, and manage risk tightly below invalidation.
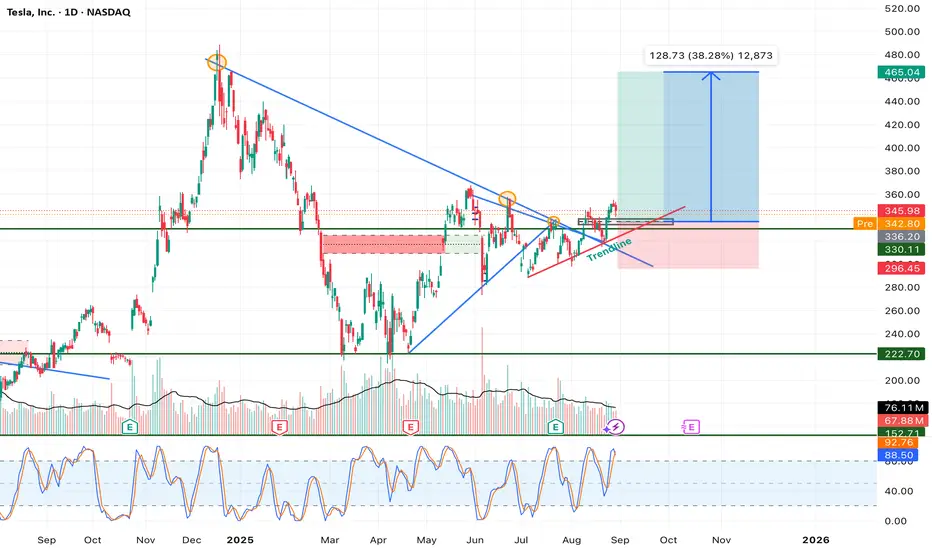
Tesla – Symmetrical Triangle Breakout With 38% Upside PotentialTesla (TSLA) has been consolidating for several months within a symmetrical triangle formation, bounded by a descending resistance trendline from the November 2024 high and an ascending support trendline from the April 2025 low. This consolidation has now resolved with a breakout above resistance, suggesting the start of a new bullish leg.
Technical Breakdown:
1. Symmetrical Triangle Formation:
• Price compressed into tighter ranges, with lower highs and higher lows converging.
• Breakout occurred above the descending trendline, confirming bullish bias.
2. Volume Confirmation:
• Breakout was accompanied by a noticeable uptick in buying volume, strengthening the validity of the move.
• Historical patterns show Tesla often rallies strongly after high-volume breakouts from consolidation zones.
3. Support & Resistance Zones:
• Immediate support: $336 (former resistance turned support, aligned with trendline retest).
• Stronger support: $296 (previous demand zone, key invalidation level).
• Resistance target: $465 (measured move from triangle breakout, aligning with prior swing levels).
4. Momentum Indicators:
• Stochastic RSI is rebounding from oversold territory, suggesting fresh buying momentum.
• MACD (not shown on chart but implied) likely supports bullish crossover given recent price action.
5. Risk-to-Reward Setup:
• Entry: $340–$345 zone after breakout retest.
• Stop Loss: Below $296 (breakdown invalidation).
• Target: $465 (38% upside potential from current levels).
• Risk/reward ratio favors long positions with significant asymmetry.
Trade Thesis:
The breakout from a well-defined symmetrical triangle suggests a continuation of Tesla’s mid-term bullish trend. The measured move projection points toward ~$465, representing a potential 38% rally from current prices. As long as price sustains above the $336–$340 support zone, bulls remain in control. A breakdown below $296 would invalidate this structure and open the door for a deeper retracement.
Conclusion:
Tesla has entered a critical bullish phase after months of consolidation. With volume confirmation, favorable risk-to-reward, and momentum recovery, the path of least resistance is higher. Upside targets sit near $465, with invalidation set at $296.
NASDAQ:TSLA
TESLA Expected Growth! BUY!
My dear friends,
Please, find my technical outlook for TESLA below:
The price is coiling around a solid key level - 333.86
Bias - Bullish
Technical Indicators: Pivot Points High anticipates a potential price reversal.
Super trend shows a clear buy, giving a perfect indicators' convergence.
Goal - 344.59
Safe Stop Loss - 327.03
About Used Indicators:
The pivot point itself is simply the average of the high, low and closing prices from the previous trading day.
Disclosure: I am part of Trade Nation's Influencer program and receive a monthly fee for using their TradingView charts in my analysis.
———————————
WISH YOU ALL LUCK

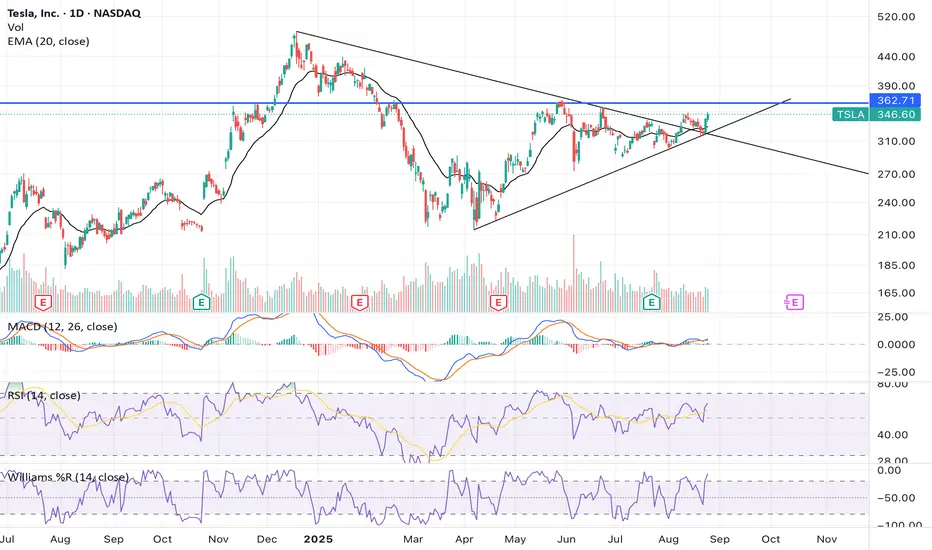
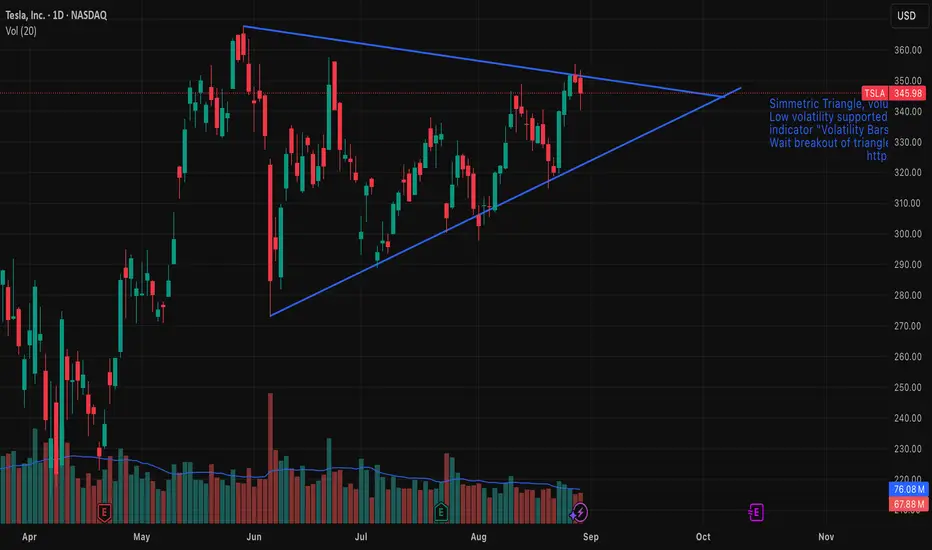
Tesla (TSLA) — Symmetrical Triangle Breakout IdeaSummary
Pattern: Symmetrical triangle on daily chart.
Expected timeframe for breakout: Within 1–2 weeks.
Targets: $367 on an upside breakout; $273 on a downside breakout.
Risk management: Use a stop-loss just outside the triangle after breakout confirmation; position size per your risk rules.
Setup & Rationale
A well-defined symmetrical triangle has formed on TSLA’s price action, characterized by converging trendlines connecting lower highs and higher lows. Volume has contracted inside the pattern, consistent with consolidation. Symmetrical triangles are neutral continuation/reversal patterns; the breakout direction provides the trading signal.
Key technical points:
Price is approaching the apex, increasing the likelihood of a decisive breakout in the next 1–2 weeks.
Volume decline during the consolidation and a volume spike on breakout would confirm conviction.
The breakout should be taken after a daily close beyond the upper or lower trendline (or after a retest), not merely intraday probes.
Entry Criteria
Upside trade: Enter long on a daily close above the upper trendline (or on a confirmed retest).
Downside trade: Enter short on a daily close below the lower trendline (or on a confirmed retest).
Targets & Measurement
Measure the pattern height (vertical distance between the initial high and low of the triangle) and project it from the breakout point.
Upside target (projected): $367.
Downside target (projected): $273.
Adjust targets proportionally if you use a measured move from the actual breakout point rather than the pattern’s maximum height.
Stops & Risk Management
Place stop-loss slightly outside the opposite trendline or beyond a recent swing point to avoid false breakouts.
Preferred approach: fixed-risk percent per trade (e.g., 1–2% of portfolio) and scale position size accordingly.
Consider tightening stops to breakeven after price clears ~50% of the distance to the target.
Confirmation: daily close beyond trendline plus above-average volume (up or down depending on direction).
Symmetrical triangles are neutral; false breakouts occur. Wait for confirmation.
News, earnings, or market-wide events can invalidate technical setups quickly—monitor catalysts.
Adjust targets/stops if volatility expands or if the breakout lacks volume confirmation.
TSLA LongTesla was going through symmetrical pattern triangle and price all above EMAs. This setup gives push price towards upside. Long upside for now.
