TESLA 28 AUG 2025 PRICE ACTIONPrice action for Tesla is here. I have clearly explained my plan on how to trade tesla considering every factor in market.
NOTE: OPTION WILL BURN YOUR CAPITAL
TL0 trade ideas

What Is Symmetrical Distribution, and How Do Traders Use It?What Is Symmetrical Distribution, and How Do Traders Use It?
Symmetrical distribution is a key concept in market analysis, helping traders assess price behaviour and volatility. When price movements are evenly distributed around a central point, it can provide insights into potential market trends. This article explores what symmetrical distribution is, how it compares to other price patterns, and how traders use it in strategies like mean reversion to refine their market approach.
What Is a Symmetric Distribution?
The symmetric distribution definition states that data points are evenly spread around a mean, meaning price movements exhibit balance over time. In simple terms, if price movements form a symmetrical shape when plotted on a chart, it suggests that past price behaviour has been balanced, with roughly equal deviations on either side of the average. This balance is supposed to help traders analyse price trends and volatility.
One of the most well-known symmetrical distribution examples is the normal distribution, often visualised as a bell curve. In markets, this means prices are more likely to cluster around the average and become less frequent as you move further away. For example, if a stock has a mean daily return of 0.5%, most days are believed to see returns close to that figure, while extreme price moves—both positive and negative—will be much rarer.
Symmetrical distribution plays a key role in statistical analysis and quantitative trading. It helps traders assess the probability of certain price movements occurring, particularly when using models that rely on historical data.
How Traders Use Symmetrical Distribution in Market Analysis
Traders use symmetrical distribution to analyse price behaviour, identify potential trading opportunities, and refine their strategies. When price movements are evenly distributed around a central point, it provides a structured way to assess market conditions. This concept is particularly useful in mean reversion strategies.
Mean Reversion Strategies
Symmetrical distribution suggests that prices tend to fluctuate around an average, making mean reversion a widely used approach. Traders applying this strategy assume that when an asset moves significantly away from its mean, it is likely to return over time. Bollinger Bands and moving averages are commonly used to measure price deviations and identify potential turning points. This is particularly relevant in markets with balanced volatility, where extreme price moves are less frequent.
Identifying Market Conditions
Analysing whether a market follows a symmetrical distribution can help traders determine which strategies might be effective. In markets where price movements are balanced, traders may focus on range-bound approaches. In contrast, when distributions become skewed, momentum and trend-following strategies might be more suitable. Recognising these shifts allows traders to adapt their methods to changing market conditions.
How to Identify a Symmetrical Distribution
Identifying a symmetrical distribution in market data involves analysing price behaviour to determine whether movements are evenly spread around a central value. While markets don’t always follow perfect symmetry, traders use statistical tools and visual techniques to assess whether a price distribution aligns with this pattern.
Histogram Analysis
A histogram is one of the simplest ways to check for symmetry in price movements. By plotting historical returns or price changes on a frequency chart, traders can see whether data points cluster evenly around the mean. If the left and right sides of the distribution mirror each other, the market may be exhibiting a symmetrical pattern.
Histograms can also reveal uniform distributions, where all values occur with equal probability, forming a flat graph rather than a bell curve. A symmetric and uniform graph can help distinguish between these two patterns—while a uniform distribution shows no central clustering, a symmetric distribution forms a peak around the mean. Recognising whether a market follows a symmetric or uniform structure helps traders determine which statistical tools are most relevant for analysis.
Statistical Measures: Mean and Standard Deviation
Symmetrical distributions tend to have a mean (average) return that sits at the centre of price movements, with standard deviations determining how far prices typically move from that mean. If price fluctuations are evenly distributed around the mean, it suggests a balanced market where extreme moves are less common.
Skewness and Kurtosis
Two key statistical measures help traders confirm symmetry:
- Skewness quantifies how unevenly data points are distributed around the mean. A value close to zero suggests a symmetrical distribution, while a positive or negative skew indicates an imbalance.
- Kurtosis measures how frequently extreme price movements occur. A symmetrical, normally distributed market typically has a kurtosis value near three.
Visualising with Moving Averages
When plotted on a chart, symmetrical price behaviour often aligns with a stable moving average, where price deviations are relatively even on both sides. In contrast, a market with consistent upward or downward bias may show clear asymmetry.
Symmetrical Distribution vs. Other Market Distributions
However, markets don’t always move in a balanced way. While symmetrical distribution means price movements are evenly spread around a central point, real-world trading often shows skewed distributions, where prices are more likely to move in one direction than the other. Understanding the difference is key to assessing market behaviour.
A positively skewed distribution means there are more small downward price moves, but the occasional sharp rally pushes the average return higher. This often happens in growth stocks or high-volatility assets, where losses are frequent but gains can be explosive. On the other hand, a negatively skewed distribution occurs when prices drift upwards gradually but occasionally experience sudden drops. This is common in carry trades, where traders potentially earn small returns over time but risk significant losses during market shocks.
Skewed distributions challenge the assumption that markets follow normal distribution patterns. For example, many risk models assume a symmetrical spread of price moves, but in reality, market crashes and parabolic rallies occur far more often than a normal distribution would assume. This is why relying solely on symmetrical models can lead to underestimating risk in extreme conditions.
Traders who recognise whether a market is symmetrical or skewed can adjust their strategies accordingly. In a symmetrical market, mean reversion strategies could be more effective, while in a skewed market, trend-following approaches could perform better.
Symmetrical Distribution in Risk Management
Risk management relies heavily on statistical analysis, and symmetrical distribution plays a key role in estimating potential market movements. When price changes are symmetrically distributed, traders can use probability models to assess how far an asset is likely to move within a given timeframe.
Value at Risk (VaR) and Probability Modelling
One common application is Value at Risk (VaR), which estimates the maximum expected loss over a period based on historical price data. If potential returns follow a symmetrical distribution, traders can calculate the probability of losses exceeding a certain threshold. For example, in a normal distribution, around 95% of price movements fall within two standard deviations of the mean, allowing traders to set potential risk limits accordingly.
Risk-Reward Calculations
A symmetrical distribution also helps traders refine their risk-reward ratios. If price movements are evenly distributed, traders can estimate potential returns relative to potential losses with greater confidence. In markets where symmetry holds, a trader aiming for a 3:1 risk-reward ratio can assume that price fluctuations are balanced enough for this structure to be viable.
Position Sizing and Stop Placement
By understanding the distribution of price movements, traders can potentially improve position sizing. If historical data suggests symmetrical price behaviour, traders may adjust their position sizes based on expected volatility. Similarly, stop-loss levels might be set relative to the standard deviation of past price movements, ensuring that exits are placed within a statistically reasonable range.
Limitations and Challenges
While symmetrical distribution provides a structured way to analyse price movements, real-world markets rarely follow a perfect balance. External factors, market psychology, and liquidity shifts often distort price behaviour, making it important for traders to recognise the limitations of relying solely on symmetrical models.
Market Skew and Imbalances
Many assets, especially stocks and commodities, exhibit skewed distributions due to long-term trends, supply-demand imbalances, or macroeconomic factors. Price movements often lean in one direction rather than forming a perfect bell curve.
Impact of News and Events
Unexpected events—such as central bank decisions, earnings reports, or geopolitical developments—can cause sudden price moves that disrupt symmetrical patterns. These events create fat tails, where extreme moves occur more frequently than a normal distribution would suggest.
Volatility Clustering
Markets tend to experience periods of high and low volatility in clusters, rather than maintaining a steady distribution. Symmetrical models often underestimate the likelihood of extreme price swings, leading to miscalculations in risk assessment.
Liquidity and Order Flow Distortions
Large institutional orders and algorithmic trading can cause short-term price imbalances, breaking the assumption of symmetrical price behaviour. These distortions can lead to misleading statistical signals.
The Bottom Line
Symmetrical distribution provides traders with a structured way to analyse price movements, assess volatility, and refine strategies. While markets don’t always follow perfect symmetry, understanding when and how these patterns appear may support your trading analysis.
FAQ
What Is Symmetrical Distribution?
Symmetrical distribution refers to a data distribution where values are evenly spread around the mean. In financial markets, this means price movements are balanced, with equal-sized fluctuations on both sides of an average value.
What Is an Example of Symmetric Data?
A common symmetrical data example is the normal distribution, where most data points cluster around the mean, and extreme values occur less frequently. In trading, an asset with daily potential returns that are equally distributed above and below the mean exhibits symmetry.
What Is the Difference Between Uniform and Symmetric Distribution?
When comparing uniform vs symmetric distribution, the key difference is that a uniform distribution gives each value an equal probability with no central clustering. A symmetrical distribution can have values clustered around the mean.
What Is the Difference Between Symmetrical Distribution and Normal Distribution?
A normal distribution is a common symmetric distribution example, creating a bell-shaped curve. While all normal distributions are symmetrical, not all symmetrical distributions follow the strict characteristics of a normal distribution.
This article represents the opinion of the Companies operating under the FXOpen brand only. It is not to be construed as an offer, solicitation, or recommendation with respect to products and services provided by the Companies operating under the FXOpen brand, nor is it to be considered financial advice.
ES1, VIX, Nvidia & Tesla Daily Trade SetupsIn this update we review the recent price action in the E-mini SP500, VIX, Nvidia & Tesla and identify the next high-probability trading setups and price objectives to target. To review today's video analysis click below!


TESLA WILL KEEP GROWING|LONG|
✅TESLA is going up
Now and the stock made a bullish
Breakout of the key horizontal
Level of 346.00$ and the breakout
Is confirmed so we are bullish
Biased and we will be expecting
A further bullish move up
LONG🚀
✅Like and subscribe to never miss a new idea!✅

Global Government Bond Trading1. Fundamentals of Government Bonds
1.1 What Are Government Bonds?
A government bond is a debt security issued by a country’s treasury or finance ministry to raise money. When an investor buys a government bond, they are lending money to the government in exchange for periodic coupon payments (interest) and repayment of the principal at maturity.
Coupon Bonds: Pay regular interest plus principal at maturity.
Zero-Coupon Bonds: Sold at a discount, repay face value at maturity.
Inflation-Linked Bonds: Adjust coupon/principal with inflation rates.
Savings Bonds / Retail Bonds: Targeted at individual investors.
1.2 Key Features of Government Bonds
Issuer: Sovereign state.
Maturity: Short-term (T-bills), medium-term (notes), long-term (bonds).
Yield: Return investors expect, inversely related to bond price.
Credit Risk: Higher in emerging economies; lower in developed ones.
Liquidity: Developed market bonds (like U.S. Treasuries) are highly liquid, emerging markets less so.
1.3 Importance in Global Finance
Provide a risk-free benchmark rate (e.g., U.S. Treasury yields influence global lending rates).
Used as collateral in repo markets.
Serve as safe-haven assets during crises.
Act as tools for monetary policy (quantitative easing, open market operations).
2. Structure of the Global Government Bond Market
2.1 Primary Market
This is where governments issue new bonds via auctions or syndications. Investors bid for these securities, and the government raises capital.
Auction System: Used by the U.S., UK, Japan. Competitive and non-competitive bidding.
Syndicated Issuance: Banks underwrite and distribute bonds, common in Europe.
2.2 Secondary Market
Bonds are traded between investors after issuance. This provides liquidity and continuous price discovery.
Over-the-Counter (OTC): Majority of global bond trading occurs OTC via dealers.
Electronic Trading Platforms: Growing importance (e.g., Tradeweb, MarketAxess).
2.3 Major Bond Markets
U.S. Treasuries: World’s largest, deepest, and most liquid government bond market.
Eurozone Bonds: German Bunds are benchmark safe assets, Italian and Spanish bonds carry higher yields.
Japanese Government Bonds (JGBs): Very large market but often low yields.
UK Gilts: Highly liquid, influenced by Bank of England policy.
Emerging Market Bonds: Offer higher yields but with currency and default risks (Brazil, India, South Africa).
3. Key Participants in Global Government Bond Trading
3.1 Central Banks
Major holders and buyers of government debt.
Conduct monetary policy through bond purchases (QE) or sales.
Hold government bonds as foreign reserves.
3.2 Institutional Investors
Pension funds, insurance companies, and mutual funds allocate heavily to sovereign debt for predictable returns.
3.3 Hedge Funds & Proprietary Traders
Trade bonds to profit from interest rate changes, arbitrage opportunities, or global macro strategies.
3.4 Foreign Governments & Sovereign Wealth Funds
Invest in foreign government bonds for diversification and reserve management.
3.5 Retail Investors
Participate via government savings bonds, ETFs, and mutual funds.
4. Trading Mechanisms
4.1 Cash Market Trading
Direct purchase/sale of government bonds in the secondary market.
Prices fluctuate with interest rates, inflation expectations, and credit risk.
4.2 Derivatives Market
Futures, options, and swaps based on government bonds or yields.
Example: U.S. Treasury futures (CME), Bund futures (Eurex).
4.3 Repo Market
Repurchase agreements use government bonds as collateral.
Essential for liquidity in the global financial system.
4.4 Electronic Platforms & Algorithmic Trading
Rapid growth in e-trading platforms.
Algorithmic and high-frequency trading now account for a significant share.
5. Factors Affecting Government Bond Prices and Yields
5.1 Interest Rates
Bond prices move inversely with interest rates. Central bank policy shifts directly impact yields.
5.2 Inflation
High inflation reduces real returns, pushing yields higher. Inflation-indexed bonds mitigate this risk.
5.3 Economic Growth
Stronger growth can lead to higher yields due to expectations of rate hikes.
5.4 Fiscal Deficits & Debt Levels
Higher government borrowing can push yields upward due to increased supply and perceived risk.
5.5 Currency Movements
Foreign investors consider exchange rate risks; weaker local currency may deter bond purchases.
5.6 Geopolitical Risk
Wars, sanctions, and political instability drive safe-haven flows into bonds of stable nations.
6. Global Government Bond Trading Strategies
6.1 Buy and Hold
Conservative investors, like pension funds, hold bonds to maturity for stable income.
6.2 Yield Curve Strategies
Steepener: Betting long-term rates rise faster than short-term.
Flattener: Opposite bet.
Butterfly Trades: Exploiting mid-term vs short/long-term curve differences.
6.3 Relative Value / Arbitrage
Traders exploit mispricing between different government bonds.
Example: Spread between U.S. Treasuries and German Bunds.
6.4 Global Macro Plays
Hedge funds trade bonds based on global interest rate cycles, inflation, and geopolitical events.
6.5 Carry Trade in Bonds
Borrowing in low-yield currencies and investing in higher-yield government bonds elsewhere.
7. Risks in Government Bond Trading
7.1 Interest Rate Risk
Sharp changes in central bank policy can cause bond price volatility.
7.2 Inflation Risk
Unexpected inflation erodes real returns.
7.3 Credit Risk
Even sovereigns can default (examples: Argentina, Greece).
7.4 Liquidity Risk
Smaller bond markets may not provide adequate trading liquidity.
7.5 Currency Risk
Foreign bond investors face exchange rate fluctuations.
7.6 Geopolitical Risk
Trade wars, sanctions, and political instability can disrupt markets.
8. Role of Government Bond Markets in Global Economy
Benchmark Rates: Government bond yields influence corporate borrowing costs.
Safe-Haven Assets: During crises, investors flock to bonds like U.S. Treasuries.
Monetary Transmission: Central bank policies work through bond markets.
Fiscal Policy Financing: Governments rely on bonds for infrastructure and welfare spending.
Global Capital Flows: Sovereign bonds drive cross-border capital allocation.
9. Case Studies in Global Bond Markets
9.1 U.S. Treasury Market
Largest and most liquid in the world (~$25 trillion outstanding).
Yields serve as a global reference for risk pricing.
Highly responsive to Federal Reserve policies.
9.2 European Sovereign Debt Crisis (2010–2012)
Greek, Portuguese, Spanish, and Italian bonds saw yield spikes.
Investors demanded higher compensation for perceived default risk.
ECB intervention (OMT, QE) stabilized the markets.
9.3 Japanese Government Bonds (JGBs)
Extremely low or negative yields for decades due to deflationary pressures.
Bank of Japan’s Yield Curve Control (YCC) dominates the market.
9.4 Emerging Market Bonds
Offer higher yields but riskier (Argentina default, Turkey’s currency crisis).
Depend heavily on foreign investor confidence.
10. Future of Global Government Bond Trading
10.1 Digital Transformation
Rise of electronic trading platforms.
Algorithmic and AI-based trading strategies.
10.2 Green & ESG-Linked Sovereign Bonds
Growing issuance of “green bonds” by governments to fund climate projects.
10.3 Impact of Global Debt Levels
Post-pandemic debt burdens remain high.
Long-term sustainability of government borrowing under scrutiny.
10.4 Geopolitical Realignment
U.S.–China rivalry may reshape global bond investment patterns.
“De-dollarization” efforts could impact U.S. Treasury dominance.
10.5 Central Bank Balance Sheets
Unwinding QE will affect bond market liquidity.
“Higher for longer” interest rate regimes may redefine yield structures.
Conclusion
Global government bond trading is the foundation of modern financial markets. It balances risk and safety, yield and liquidity, domestic policy and international capital flows. From U.S. Treasuries as the world’s risk-free benchmark to the volatile sovereign bonds of emerging markets, this market reflects the health of economies, the credibility of fiscal policy, and the confidence of investors.
In times of crisis, investors flock to safe government bonds. In times of growth, they may chase higher yields elsewhere. But regardless of market cycles, government bond trading remains central to how money moves across borders, how interest rates are set, and how nations finance themselves.
As the world transitions into an era of high debt, climate financing, digital trading, and shifting geopolitics, global government bond markets will only grow in importance. Understanding their mechanics is crucial for traders, investors, policymakers, and anyone seeking to grasp the pulse of global finance.

BMW Puts on the Techie Suit to Challenge Elon🚘️ BMW Puts on the Techie Suit to Challenge Elon
By Ion Jauregui – Analyst at ActivTrades
BMW (Ticker AT:BMW) has fired up its engines in the technology race against Tesla. The Bavarian brand is launching the Neue Klasse, a platform that promises to revolutionize the electric car and will debut with the new iX3, unveiled ahead of the Munich Motor Show.
This is not just another electric SUV: the company has invested more than €10 billion to turn the car into a “superbrain on wheels.” Four central chips manage everything from infotainment to autonomous driving, with 20 times more computing power than current systems. Added to this are headline-grabbing features: 800 kilometers of range and 350 km of charge in just 10 minutes.
BMW, however, does not manufacture its own batteries. Instead, it relies on Chinese giant CATL (SSE:300750), with whom it has developed new cylindrical cells that halve costs and increase energy density. Six gigafactories spread across China, Europe, and North America will guarantee supply.
Shift to E-Mobility
The shift toward electrification does not come without sacrifices. In 2024, the group saw its net profit fall 37%, to €7.68 billion, due to heavy spending on R&D. However, pure EV sales grew 13.5%, supporting the transition.
BMW benefits from structural reductions in battery production costs, a diversified portfolio supported by solid alliances that integrate electric, hybrid, and combustion models under the same digital platform, and a premium positioning that continues to attract loyal customers. The risk lies in massive spending eroding margins at a time when Tesla (Ticker AT:TSLA) and Chinese manufacturers like Xpeng (NYSE:XPEV) are advancing aggressively.
Technical Analysis
BMW shares on the Frankfurt Stock Exchange show a consolidation trend after a volatile 2024 marked by profit cuts. The current key support at €88.18 seems to be holding, while resistance lies between €88.85 and the unbroken highs of €91.72. This resistance has repeatedly pushed the stock back to support levels after each upward attempt. Breaking through current highs would open a path toward €110, and possibly new yearly highs, while a drop below support could shake investor confidence and push the stock toward the Point of Control (POC) around €86.60.
The 50, 100, and 200-day moving averages have contracted sharply over the past month, which could indicate declining confidence if confirmed. On the other hand, the RSI at 42.05% signals oversold conditions, while the MACD is negative but with a histogram turning positive—another possible signal of recovery. Lastly, the ActivTrades Europe Market Pulse indicator shows a contraction back to neutral territory, suggesting investors may be returning to support the market.
BMW (Ticker AT:BMW)
Trend: Bullish in the medium and long term, with potential lateralization or short-term reversal.
Resistance: Strong zone at the highs of €91.72.
Supports: Key levels between €88 and €88.50, with critical supports at €88.22, €88.18, POC €86.60, €85.18, €83.18, €81.60, and €79.70.
Point of Control (POC): €86.60.
Technical Conclusion: Recent sideways consolidation, with upside potential if the €91.50–91.72 zone is broken.
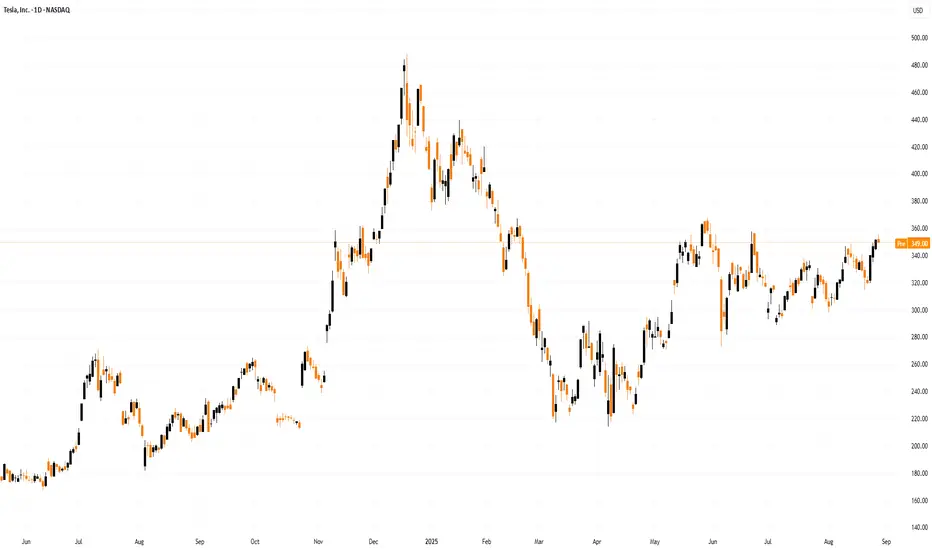
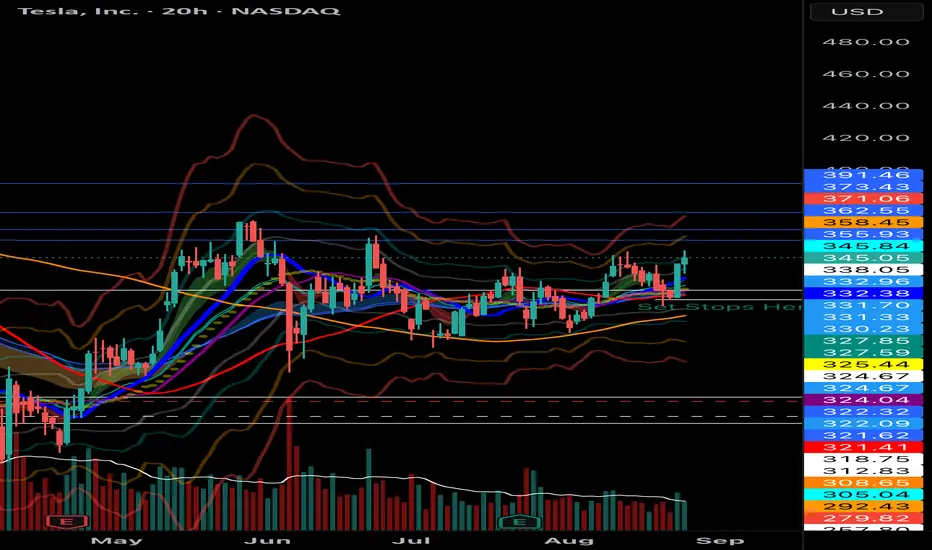
Tesla
Following political frictions between Elon Musk and Trump, Tesla’s stock has been recovering, moving sideways between May and August, with a slightly upward bias within the range of $361.93 to $291.37. A mid-range area has formed around the POC of $311.43, acting as support for the latest rally.
The RSI stands at 53.96%, a relatively neutral level, while the MACD remains neutral with a histogram gradually entering negative territory, pointing to a strong consolidation move. Meanwhile, the ActivTrades US Market Pulse indicates the American market is in extreme RISK-ON, suggesting potential adjustments due to excessive greed.
Tesla (Ticker AT:TSLA)
Current Trend: Short-term bullish recovery after weeks of lateral consolidation, with positive signs from regaining key moving averages.
Resistances: Strong resistance around $361.93, which could open the way toward $420, the next major level lost in February’s death cross.
Supports: Key support at the POC of $311.43, followed by $291.37, $274.75, and $225.58.
Technical Conclusion: Tesla is at a decisive range. A break above recent highs could trigger an upward move toward $420 or beyond. Conversely, a drop below $320 would increase bearish pressure, potentially driving the stock down to test $291.
Conclusion
The Neue Klasse is not just a product launch—it is BMW’s boldest and riskiest bet in decades. The German manufacturer wants to stop being solely a premium icon and transform into a fully-fledged tech player. Elon Musk no longer runs alone: the racetrack is filling up with rivals hungry for disruption.
*******************************************************************************************
The information provided does not constitute investment research. The material has not been prepared in accordance with the legal requirements designed to promote the independence of investment research and such should be considered a marketing communication.
All information has been prepared by ActivTrades ("AT"). The information does not contain a record of AT's prices, or an offer of or solicitation for a transaction in any financial instrument. No representation or warranty is given as to the accuracy or completeness of this information.
Any material provided does not have regard to the specific investment objective and financial situation of any person who may receive it. Past performance and forecasting are not a synonym of a reliable indicator of future performance. AT provides an execution-only service. Consequently, any person acting on the information provided does so at their own risk. Political risk is unpredictable. Central bank actions can vary. Platform tools do not guarantee success.

TSLA: 350 retestThe market is confused. Clarity is needed.
In the very short term $350 is clear. However, with plenty of resistance. Will likely chop, then rise of fall from there.
Long term the vision and execution remains supreme. Revenues will sky rocket, it's only a matter of time. From an investors perspective, I look to buy in times of extreme fear and oversold scenarios. I do nothing at these levels, but I like to stay alert with the price trends.

TSLA (daytrading) small tradeI already entered but didn’t post earlier because I was too busy. You guys can wait for a small pullback tomorrow. Take profit whenever you feel comfortable.
1. Bullish doji candle on the daily (D1).
2. Uptrend still intact on D1 and higher timeframes.
3. Retest of the 50 SMA on D1.
4. Price touched the trendline.
Plan: Buy call options at the closest strike price with expiry this week. Don’t forget to set a stop loss.

Investing in Tech Stocks: What Daxprime Investors Profited From The tech sector is once again in the spotlight. Despite fierce competition, rapidly shifting trends, and increasing regulation, technology stocks remained among the most profitable assets on the market in 2025.
The Daxprime team conducted an in-depth analysis of client portfolios, top-performing tech giants, and fast-growing startups. In this article, we reveal which stocks brought the biggest profits to Daxprime investors in 2025 — and the strategies that helped them grow their capital with minimal risk.
Tech Sector Overview in 2025
After strong growth in 2023–2024, tech stocks began 2025 with cautious recovery. Investor attention focused on:
Companies in artificial intelligence (AI)
Leaders in cloud computing and cybersecurity
Firms investing in microelectronics and neurotech
Startups rapidly capturing niches in automation and robotics
From January to the end of August 2025:
Nasdaq-100 grew +17.6%
XLK (Tech Select Sector SPDR) rose +14.8%
Individual stocks gained up to 70–90%
Top 5 Stocks That Generated the Most Profit for Daxprime Investors
1. NVIDIA (NVDA)
Growth (Jan–Aug 2025): +62%
Drivers: Soaring demand for AI chips, data centers, and autonomous driving
Clients profited from both price appreciation and short-term trades on earnings reports
2. Microsoft (MSFT)
Growth: +34%
Highlights: Expanding proprietary AI platforms, Azure cloud growth, strategic partnerships with OpenAI
MSFT served as a core holding in many Daxprime portfolios
3. Palantir Technologies (PLTR)
Growth: +85%
Strengths: Securing government contracts, SaaS expansion, aggressive growth in Europe
Considered medium-risk, high-potential
4. Supermicro (SMCI)
Growth: +91%
Role: Key AI infrastructure server provider
One of 2025’s “hidden champions”
5. Tesla (TSLA)
Growth: +29%
Catalysts: Launch of new EV models, global factory expansion
Still volatile, but favored for tactical/speculative strategies
Real Daxprime Investor Cases
Case 1: Aggressive Growth Strategy
Portfolio: 40% NVDA, 25% SMCI, 20% TSLA, 15% PLTR
Invested in January: $25,000
Value in August: $47,300
Return: +89.2%
Case 2: Moderate Approach
Portfolio: 50% MSFT, 30% NVDA, 20% AAPL
Invested: $50,000
Current value: $65,500
Return: +31%
Conclusion: Daxprime investors profit using both aggressive and balanced strategies — both work when built on quality analysis.
What Helped Investors Earn in 2025?
Timely portfolio rebalancing — shifting into AI leaders and out of underperforming sectors
Using earnings reports as entry points
AI-based analysis from Daxprime — trade signals, entry/exit timing
Investing in trends, not just “famous brands”
Risks and How They Were Managed
The tech sector remains volatile:
Supply chain disruptions can cause 10–20% drawdowns
Strong correlation with macro factors
Constant innovation leads to high competitive pressure
How Daxprime clients managed risk:
Diversifying between large caps and mid-caps
Holding defensive assets (e.g., ETFs, bonds)
Ongoing support from Daxprime analysts
Why Investors Choose Daxprime for Tech Stock Strategies
Access to real-time analytics on 500+ stocks
AI-powered entry/exit signals
Portfolio rebalancing tools
Personalized investment strategies
Access to IPOs and Pre-IPOs in the tech sector
Daxprime helps clients not just buy stocks, but build structured strategies that deliver profits — both in uptrends and sideways markets.
Conclusion
The year 2025 proved once again: technology companies are the engine of the stock market. Investors who bet on AI and cloud industry leaders — and adapted in time — earned substantial profits.
With Daxprime, you’re not just investing — you’re building a strategy where every step is based on data, experience, and smart decisions. That’s how you earn consistently while managing risk.

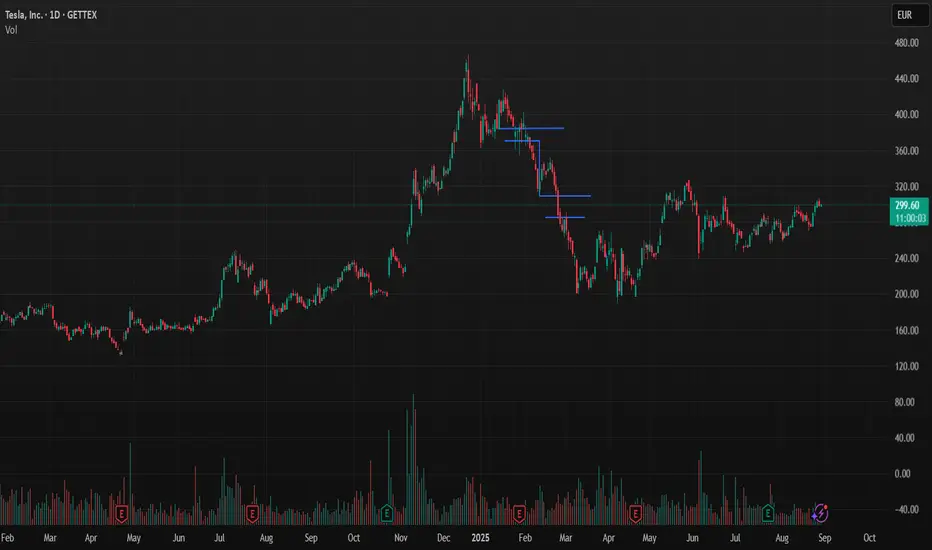
TESLA, pay attention to these numbers!!Despite the electric vehicle sector experiencing strong demand growth, with EV sales up 33.6% in July across the European market (source: Investing.com), Tesla appears to be struggling to keep up with the trend, posting a 40% drop in sales. In contrast, BYD continues to gain market share steadily.
Yet, Tesla is currently trading at a price that reflects an EPS multiple of 203.83x (with revenue growth expected to be -5.4% in 2025 and EPS falling by 12.1%) , an aggressive valuation that is difficult to justify given the company’s revenue has seen only modest growth over the past two years. This stagnation is largely due to weakening gross profit margins and broader macroeconomic headwinds that are weighing on performance. The current stock price still seems inflated by the momentum and hype generated by Tesla's strong performance up to 2022.
It is also worth noting that Elon Musk, during a key period, appeared to shift focus away from Tesla, impacting investor confidence and leadership credibility.
From a technical and statistical perspective, Tesla appears significantly overbought, with an estimated fair value that is 27.04% lower than the current price. On the chart, there’s a clear resistance zone between $346.04 and $351.22, and a support zone between $366.53 and $368.80.
(DISCLAIMER: The following is a personal opinion, not financial advice!!)
A potential short position in the coming days cannot be ruled out, with market reaction likely hinging on the earnings report due October 21. A stop-loss could be set around $368.80 (if the upward trend fails to confirm), with a take-profit range between $329.70 (200-day MA) and $302.00. An initial take-profit could be considered around $322.97, aligned with the 50-day moving average (MA50).
Let me know if you like the content and if you want give me a feedback!!
TSLAPossible trade setup opportunity in TSLA based on:
1-Price action
2-Volumen action
3-Moving averages and momentum
4-General market conditions

TSLA (swingtrade) Bull flag1. Pattern : Bull flag breakout
2. retest: done
3. sma 50 on hold in D1,W
* could fake break out alway stoploss

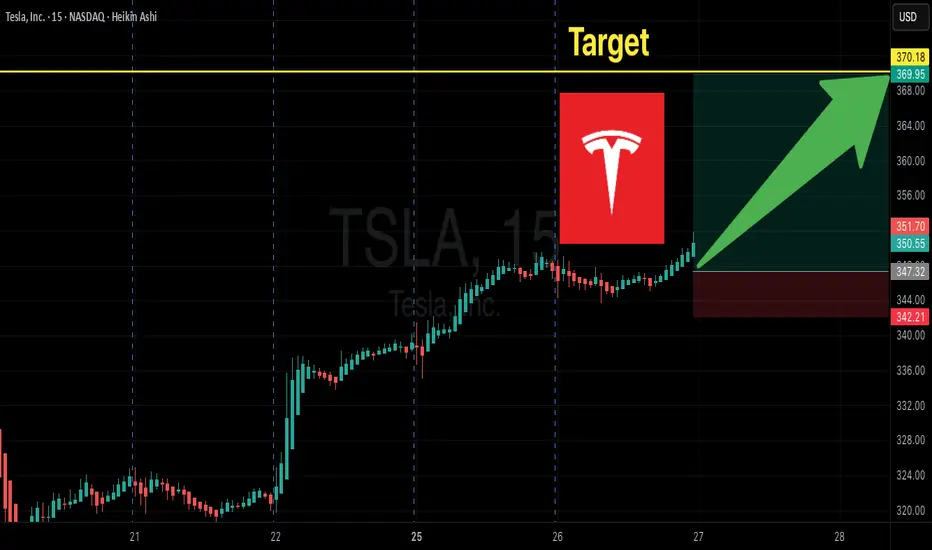
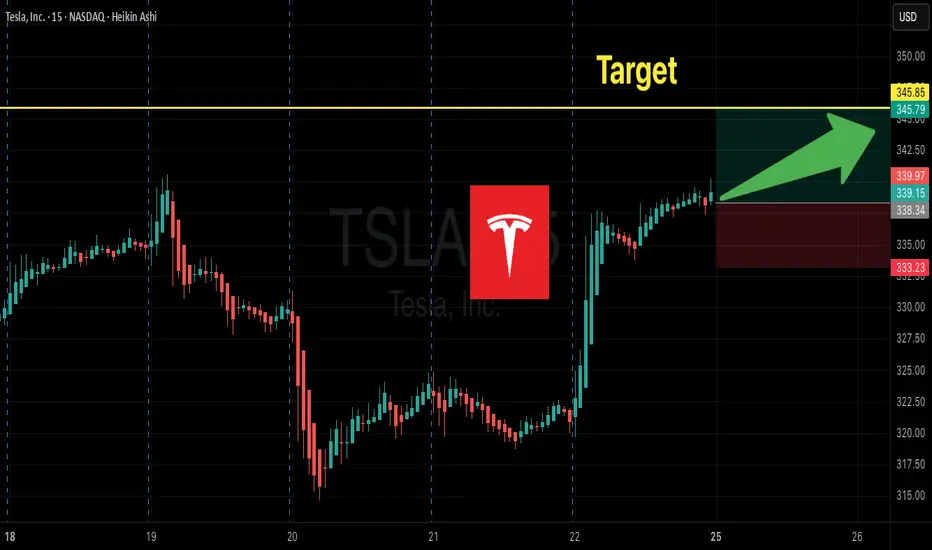
Tesla Options Flow Signals BIG Upside! $370C Momentum Trade
# 🚀 TSLA Weekly Options Setup | 370C Targeting 100%+ 📈
### 🔑 Key Highlights
* **Momentum:** RSI rising on both Daily (63.5) & Weekly (68.4) ✅
* **Options Flow:** Strong bullish skew (C/P = 1.79) 🟢
* **Volume:** Weak overall (0.9x), but institutional spike into close ⚡
* **Volatility:** VIX low → favorable for directional calls 😎
---
### 📊 Trade Setup (Consensus Pick)
* 🎯 **Instrument:** TSLA Weekly Call
* 💵 **Strike:** \$370C
* 📅 **Expiry:** 2025-08-29
* 💰 **Entry:** \$0.98 (ask) — open
* 🛑 **Stop:** \$0.49 (-50%)
* 🎯 **Target:** \$1.96 (+100%)
* ⏳ **Max Hold:** Close by **Thursday EOD** to avoid Friday theta/gamma crush
---
### 📌 Why \$370C?
* Best **liquidity** (OI \~18,450, vol 20k) → tightest fills ✅
* Balanced **delta & leverage** for short-term momentum 🎯
* Aligns with most model recommendations 📊
---
### ⚠️ Risks to Watch
* 🔻 **Theta decay** accelerates mid-week → avoid holding to Friday
* 🔻 **Gap risk** at open — manage entries with limit orders
* 🔻 **Market reversal** can kill momentum fast
---
## ✅ Final Verdict: **Strong Weekly Bullish Bias**
TSLA looks primed for an upside push — \$370C is the sweet spot for this week’s expiry.
---
### 🔥 Hashtags
\#TSLA #OptionsTrading #WeeklyOptions #StocksToWatch #MomentumTrading #TradingSignals #CallOptions #BullishSetup #TeslaStock
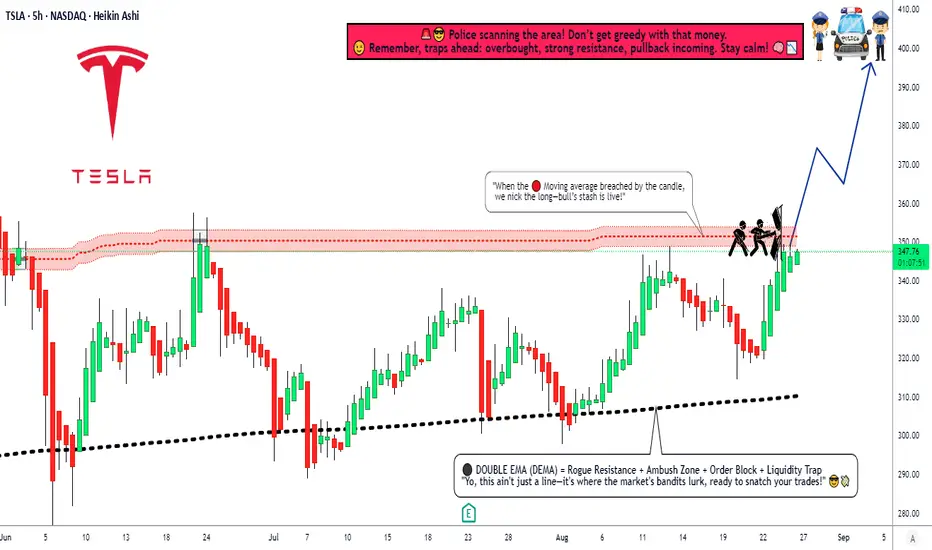
TSLA Breakout Play: Time to Steal Some Profits?🚨 TESLA INC (TSLA) HEIST PLAN - BULLISH SWING/Day LAYUP! 🚨
Yo, Thief OG's! 🐱👤🤑 Time to swarm the TSLA vault. The blueprint is set for a major bullish score. Our intel says the cops (bears) are losing their grip. Let's get this money! 💰💸✨
🎯 THE MASTER PLAN: BULLISH BREAKOUT (PENDING ORDERS)
Based on the Thief Trading Style™ technical analysis, we're plotting a bullish heist on TSLA. We wait for the breakout confirmation, then we strike with precision using our layered entry strategy.
Asset: TESLA INC (TSLA)
Trade Type: Swing / Day Trade
Bias: BULLISH ⬆️⚡
📍 ENTRY: THE HEIST INITIATES (SET YOUR ALARMS! ⏰)
Primary Entry: Breakout and close above $355.00 ⚡
THIEF'S LAYERED ENTRY STRATEGY: 🎯
Don't go all in at one price! We use multiple limit orders to layer into the position after the breakout confirms the move. This is how the pros (and thieves) do it!
Layer 1: Breakout Entry @ $355.00
Layer 2: Pullback Entry @ $350.00
Layer 3: Pullback Entry @ $345.00
Layer 4: Pullback Entry @ $340.00
Layer 5: Pullback Entry @ $335.00
(You can add more layers based on your own capital and risk appetite, you savage!)
📌 IMPORTANT: SET A TRADINGVIEW ALARM at $355.00! This is your signal that the heist is a GO! Don't get caught sleeping. 🛌💤
🛑 STOP LOSS: THE ESCAPE ROUTE
Thief SL for Breakout Entry: $320.00
⚠️ HEAR ME, HEAR ME! Dear Ladies & Gentleman (Thief OG's), adjust your SL based on your own strategy & risk! I am not your financial advisor; I'm just the guy with the blueprint. 🗺️ Place your SL ONLY AFTER the breakout happens. Protect your capital at all costs!
🎯 TARGET: CASH OUT & VANISH
Primary Target: $400.00 🚀
The police barricade is thick up there! 🚓🚧 Once the money is in the bag, don't get greedy! Escape with the stolen profits before they catch you!
Note: Dear Thief OG's, I am not recommending you use only my TP. Take profits at your own risk and based on your own analysis. Secure the bag when YOU feel comfortable! 💼🔥
💎 THIEF'S FINAL WORDS:
This is not a gamble; it's a calculated heist. Follow the plan, manage your risk, and let's eat! 🍽️
Hit the LIKE button if you're riding with us! ✅
BOOST this idea to empower the thief community! 💪❤️
Follow for more daily heist plans! 🎯
Stay sharp, stay profitable, and remember... in the market, be a thief, not a victim! 🐱💻🚀
NASDAQ:TSLA #TradingView #StockMarket #TradingPlan #SwingTrading #DayTrading #Investing #Bullish #TESLA #ThiefTradingStyle
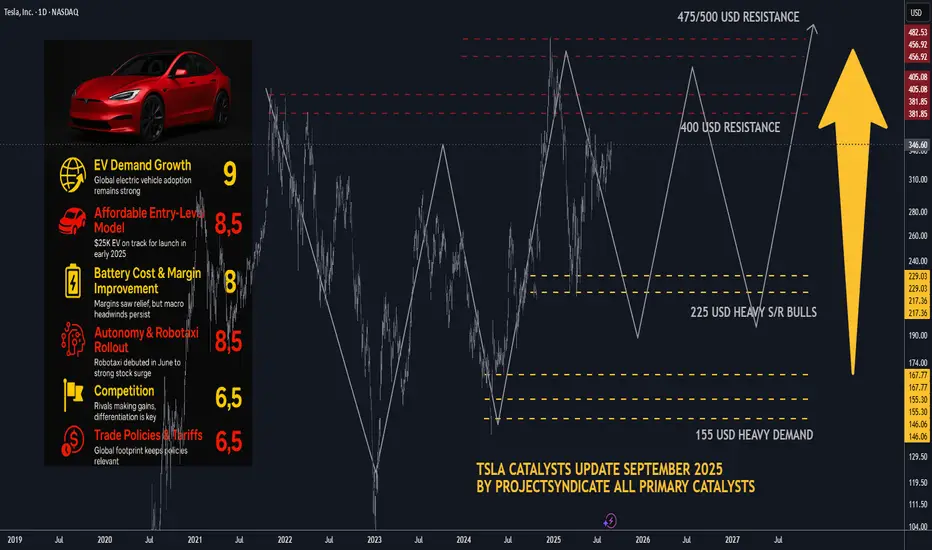
TSLA Catalysts Ranking: September 2025 update and Path ForwardHere's an updated/revised outlook for TSLA including all the primary
catalyst ranking and analyst ratings and overview of latest developments
this was updated for September 2025 with all the viable market data.
🤖1. Autonomous & Robotaxi Execution (↑ from 8.5 to 9/10)
• Why it matters: Tesla officially launched its Robotaxi service in Austin on June 22, 2025, deploying a small fleet of 10–20 invite-only Model Ys operating within a geofence and featuring human safety monitors..
• The stock rallied impressively—up 9%–11% on launch day..
• Regulatory scrutiny intensified as the NHTSA launched probes into delayed crash reporting and other safety concerns..
• Musk also touted FSD v14 as 2–3× safer than humans, with v15 aiming to be 10× safer—but cautioned debugging would take "several months.".
• Why the bump to 9/10? The real-world rollout is finally underway, drawing heavy investor focus—even amidst safety questions.
________________________________________
🌍2. EV Demand Growth & Geographic Recovery (holds at 9/10)
• Despite a 13% year over year global sales drop in H1 2025, future demand hinges on Amazon of lower priced models and tax credit extensions..
• Strong upward investor sentiment: TSLA is up 54% over the past year, despite being down ~16% YTD..
• Why still 9/10? Long-term EV momentum remains solid; a rebound may follow new launches or incentive shifts.
________________________________________
💸3. U.S. EV Tax Credits & Incentives (↑ from 6 to 7.5/10)
• The $7,500 EV tax credit—set to expire September 30—has been extended: now, buyers can qualify with a signed purchase agreement, even before delivery..
• However, expiration still looms and could dampen demand..
• Why bump to 7.5/10? The extension buys breathing room and could stabilize near-term demand.
________________________________________
📉4. Fed & Interest Rates (↑ from 5 to 6.5/10)
• On August 22, Tesla led a mega cap tech rally (up 6%+) after Fed chair hinted at possible rate cuts—lower borrowing costs may aid EV financing..
• Why improved score? Lower rates remain a key catalyst for big-ticket items like EVs.
________________________________________
🎭5. Affordable Entry-Level Model / Next-Gen Platform (holds at 8.5/10)
• Musk revealed the upcoming affordable model may resemble a Model Y and could launch slower than expected post tax credit expiration..
• The “next gen” platform—including the so called “Model 2/Q” or Cybercab—targets mid 2025 production..
• With delays likely, expectations remain high but execution risk persists.
________________________________________
🔋6. Battery Cost & Margin Improvement (holds at 8/10)
• Q2 margins improved modestly, supported by cost cuts and energy business growth..
• Yet, regulatory credits continue to decline (–51%), pressuring margins..
________________________________________
🤖7. Energy & AI Upside (new 8/10)
• Tesla is doubling down on autonomy and energy. Musk highlighted robotaxi, energy storage, and its humanoid Optimus robot, slated for early 2026..
• Wedbush’s Dan Ives sees Tesla as an “embodied AI compounder,” while William Blair estimates self driving could be worth nearly $1 trillion..
• This iterative AI and energy focus is a compelling re-rating vector.
________________________________________
📊 8. Safety, Regulatory & Governance Risk (↑ to 7/10)
• NHTSA’s probe into crash-report delays, plus ongoing FSD safety concerns, elevate tail risk..
• Musk’s political entanglements have had adverse brand impacts; while stepping back from new political initiatives helped marginally, skepticism persists..
• Added governance scrutiny and Musk’s external ventures continue to weigh on sentiment.
________________________________________
🚩9. Competition & Global Sales Slump (holds at 6.5/10)
• EV rivalry heats up, and Tesla’s European and Chinese market share slumped significantly.
• Still a notable headwind.
________________________________________
✅10. Commodities & Raw Material Costs (holds at 5.5/10)
• Volatile raw material prices continue to affect margins; hedges help but don't eliminate the risk.
________________________________________
🚀11. Macro & Trade Policies (new 6/10)
• Tariff risks and global trade instability persist. Musk has warned of “rough quarters” ahead linked to these macro risks..
• Considered separately, worth tracking but less immediate than others.
________________________________________
Updated Catalyst Scorecard
Rank Catalyst Score
1 Autonomous & Robotaxi Execution 9
2 EV Demand Growth 9
3 Affordable Entry-Level Model 8.5
4 Battery Cost & Margin Improvement 8
5 Energy & AI Upside 8
6 U.S. EV Incentives 7.5
7 Safety, Regulatory & Governance Risk 7
8 Fed & Interest Rates 6.5
9 Competition & Global Sales Slump 6.5
10 Macro & Trade Policy Risks 6
11 Commodities & Raw Material Costs 5.5
________________________________________
📊Analyst Ratings & Price Targets (Updated)
• Median 12-month price target: ~$303–$307, implying slight downside from current ~$346..
• High-end bulls: Dan Ives (Wedbush) at $500; Benchmark raised to $475..
• Cautious voices: UBS remains bearish at $215, saying robotaxi upside may be priced-in..
• Wolfe Research: warns near-term earnings estimates are too optimistic, free cash flow may remain under pressure..
________________________________________
🔍Recent Headlines You Should Know
• Robotaxi launch in Austin, promoting optimism but drawing scrutiny..
• FSD & Optimus focus, backed by bullish commentary like “embodied AI compounder.”.
• EV credit tweak buys time for deliveries and demand..
• Fed hinting at rate cuts, offering cyclical lift..
• Q2 earnings miss on EPS and revenue, but autonomy/energy pushed narrative..
________________________________________
• Bull Case: Robotaxi and AI drive restore investor confidence, pushing targets toward $475–$500.
• Base Case: Steady but cautious—watch for execution on autonomous and cost-efficiency.
• Bear Case: Renewed delivery slumps, regulatory blowback, or failed rollout could weigh toward downside support in the $300–$330 range.
TSLA Volatility Contraction Pattern (VCP) LONG When TSLA breaks above 350 and closes, the price will launch to $390 very quickly.
A VCP is a technical pattern, showing lessening declines in a range bound formation. A bull flag showing higher-lows is the best, as seen with TSLA.
Volatility is going to breakout sharply to the upside. If you TSLA above 350 just buy and hold, you’re too late trying to get a better deal.
🚀🚀🚀🌖
#TSLA need some newsCorrect. Elon doesnt allow bears. Four hundred visible now. Some consolidation needed but how.

TESLA IS BULISH ."After all the bad news and struggles with Tesla, we can see a potential move for a bullish trend. However, it depends on a valid breakout this month. I am hopeful about it."
but dont forget i am nab .

TSLA Technical Outlook – Symmetrical Triangle Breakout Watch🚗 TSLA Technical Outlook – Symmetrical Triangle Breakout Watch
Ticker: TSLA (Tesla, Inc.)
Timeframe: 30-minute candles
🔍 Current Setup
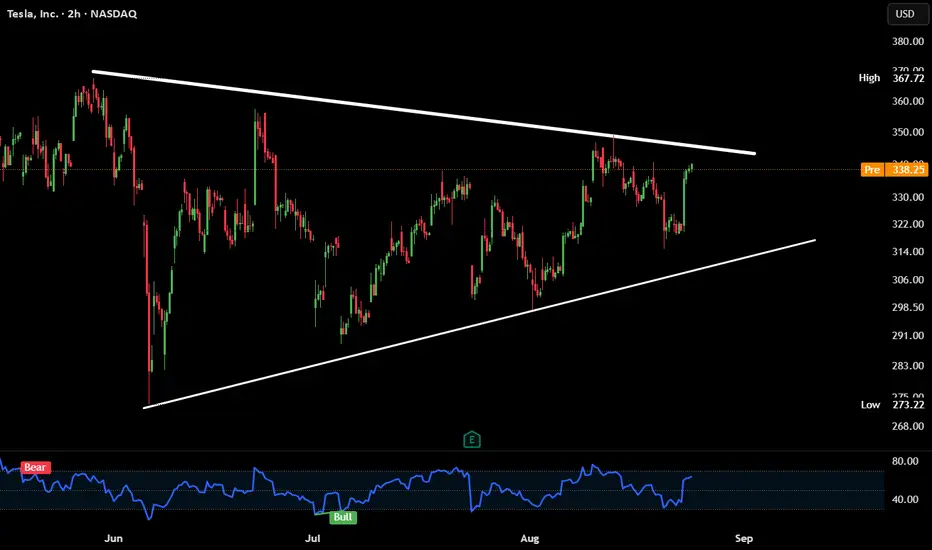
TSLA has been consolidating for months inside a large symmetrical triangle, marked by:
Descending resistance: from ~380 down to ~347.
Ascending support: from April lows near ~240, now rising toward ~320.
Current price: ~348, testing the upper boundary of the triangle.
This structure signals compression after a major downtrend, and the breakout direction will likely define TSLA’s next big move.
📊 Breakout Levels
🚀 Upside (Bullish Scenario)
Trigger: Break and close above 350–355.
Intermediate Targets:
370–380 → First resistance zone.
400–420 → Extension levels.
Measured Move Target: ~450+ (based on the triangle height projection).
🔻 Downside (Bearish Scenario)
Trigger: Failure at resistance and break below 320, confirmation under 310.
Intermediate Supports:
300 → Psychological level.
280–260 → Stronger support zone.
Measured Move Target: ~250 (triangle projection downward).
📈 Volume Analysis
Volume has been contracting steadily during the triangle’s formation.
A major volume spike will be key to confirming whichever direction TSLA chooses.
⚖️ Probability Bias
TSLA is at the make-or-break resistance zone (~350).
A breakout above 355 would strongly favor bulls, targeting 380 → 400+.
But a rejection here and break below 320 would shift momentum bearish, sending TSLA back toward 280–260.
✅ Takeaway
TSLA is at a critical inflection point inside a long-term triangle:
Bullish Break > 355: Targets 370 → 400 → 450+
Bearish Break < 320: Targets 300 → 280 → 250
Watch for volume-backed confirmation, as this move could define Tesla’s next multi-week trend.
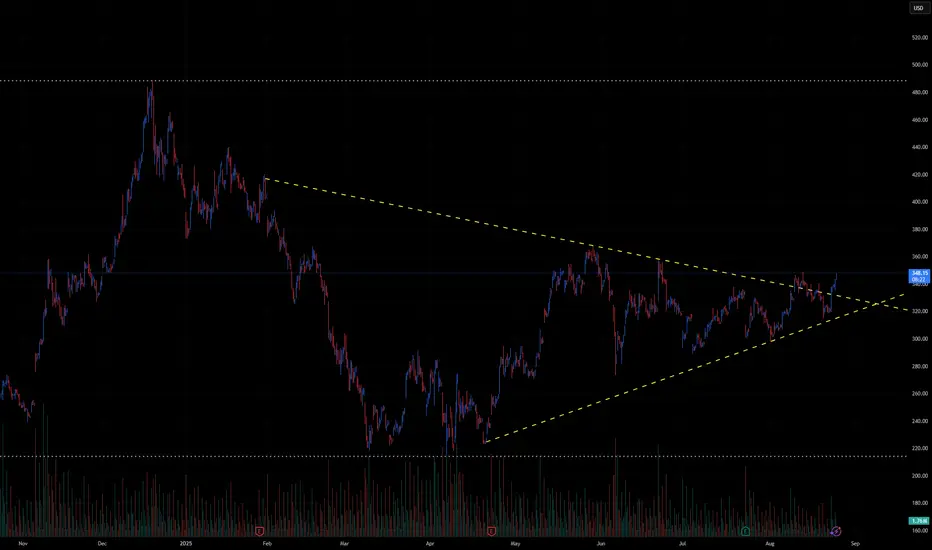
TESLA - Tight range = explosive breakout loading?Breakdown (what the chart shows):
Tesla is forming a symmetrical triangle on the 2H chart. Price is squeezing between higher lows and lower highs.
Currently testing resistance near $338–340. Breakout or rejection incoming.
Confluence:
1. RSI bouncing back from near oversold → bullish momentum returning.
CTA :
Which way do you think it breaks — up or down?
Would you trade the breakout or fade the first move?
TSLA Weekly Options Setup:345C--Don’t Miss Out
# 🚀 TSLA Weekly Options Setup: Bullish Momentum Play w/ \$345C 🎯 (Aug 29 Expiry)
### 🔑 Multi-Model Summary
✅ RSI (Daily 60.1 → Weekly 65) = Bullish momentum
✅ VIX \~14.2 = Favorable volatility regime
⚠️ Weak weekly volume (0.9x) + neutral options flow (C/P \~1.10)
⚖️ Mixed models → Some lean bullish (\$345–355C), others prefer **no trade** due to weak institutional flow
---
### 📊 Recommended Trade (If You Take It)
* 🎯 **Instrument**: \ NASDAQ:TSLA
* 📈 **Direction**: Call (Long)
* 🎯 **Strike**: \$345C
* 💵 **Entry**: \~\$6.00 (limit at open)
* 🛑 **Stop**: \$3.60 (40% risk control)
* 🎯 **Target**: \$9.00 (+50%)
* 📅 **Expiry**: 2025-08-29
* 📏 **Size**: 1 contract (scalable)
* ⚡ **Exit**: By **Thursday close** (avoid Friday gamma decay)
* 🔒 **Confidence**: 65% (moderate conviction)
---
### ⚠️ Key Risks
* Weak volume = no big-money confirmation
* Event risk (SpaceX headlines)
* 5 DTE = aggressive theta decay
* Gamma swings → fast intraday moves
---
### 📌 Conclusion
Momentum favors upside, but lack of strong institutional confirmation = **medium conviction**.
👉 Conservative traders: wait.
👉 Active traders: \$345C is the best balance of **delta, liquidity, and leverage** this week.
---
### 🔥 Hashtags
\#TSLA #OptionsTrading #WeeklyOptions #CallOptions #SwingTrade #DayTrading #MomentumTrading #OptionsFlow #BreakoutTrading #StockMarket 🚀📈💎🔥
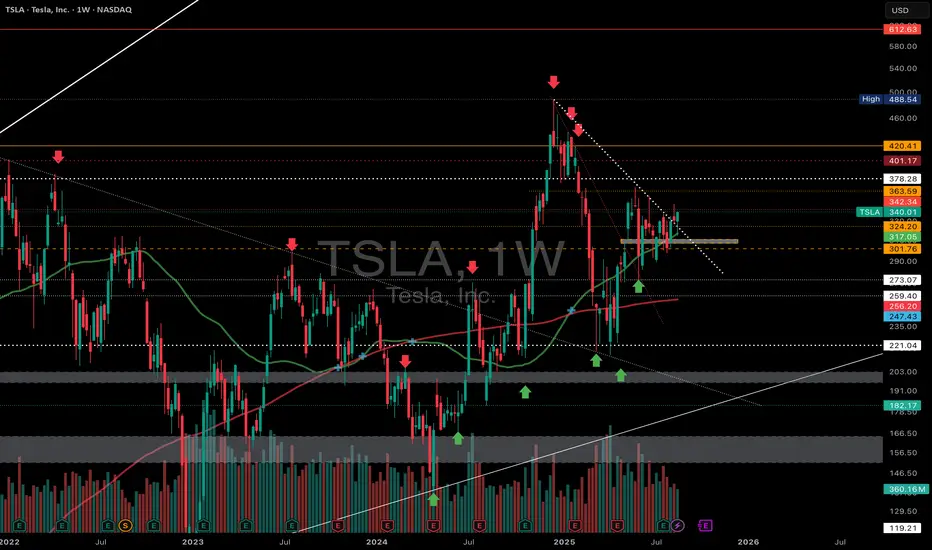
TSLA – Tesla Inc. | Daily Chart AnalysisNASDAQ:TSLA – Tesla Inc. | Daily Chart Analysis
Tesla ( NASDAQ:TSLA ) is currently navigating a critical technical region after a sharp +6.22% move, closing at $340.01.
🔍 Key Technical Developments:
• Break of Downtrend: Price broke above the descending trendline (dotted white) that had been rejecting rallies since the $488 peak. This breakout was followed by consolidation just above support.
• Support Zone: The $320–$325 region (highlighted box) has been tested multiple times and is now acting as a solid demand area.
• Moving Averages: TSLA is holding above both the 50 day (green) and 200-day (red) MAs bullish posture.
• Trend Reversal Structure: Higher lows forming since April 2025, supported by increasing volume on up moves a constructive bullish base.
📌 Key Levels to Watch:
• Resistance:
◦ $342.34 (current test)
◦ $363.59 (next major level)
◦ $378.28 and $401.17 as higher resistance zones
• Support:
◦ $324.20 / $321.84
◦ $301.76
◦ Below that: $273.07
📈 Current Price: $340.01 (+6.22%)
Tesla is attempting to break out of a long-term downtrend structure. A sustained move above $342–$344 could ignite momentum toward $360+.
📊 Watch for volume confirmation and reaction at major resistance zones.
#Tesla #TSLA #Stocks #TechnicalAnalysis #Breakout #ElonMusk #Trading #NASDAQ