TSLA: AI + Technicals Meets Macro TailwindsAI Forecast (VolanX Protocol)
Current Price: $340.01
30-Day Target: $387.70 → +14.0% upside
Institutional Trade Plan:
Entry: $340.01
Stop Loss: $314.45
Targets: $346.81 / $387.70
Risk/Reward: 1.87:1
Model Agreement: 8/9 bullish
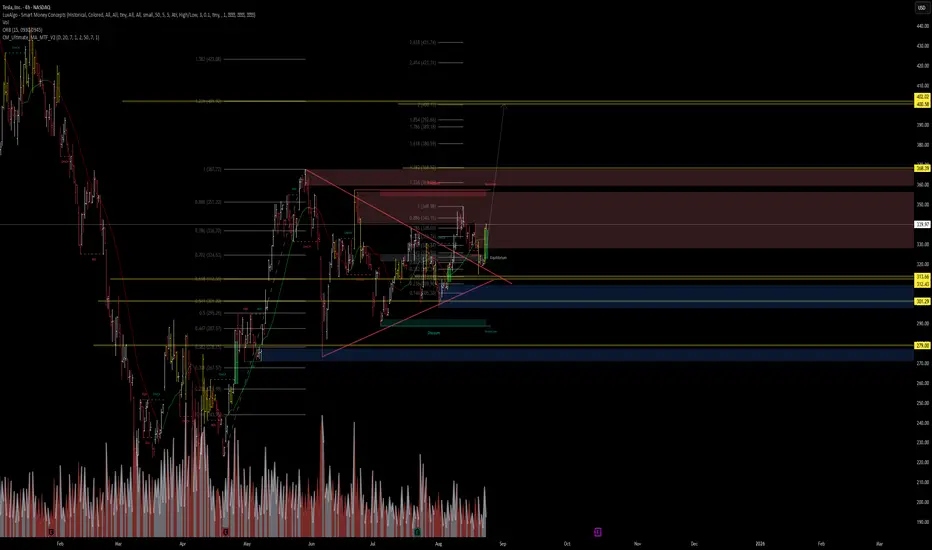
Technical Structure (4H Chart):
Broke above a triangular consolidation, now testing equilibrium from below.
Key support levels: $313.60 / $301.30 (discount zone).
Resistance / extension zones lined up at:
First: $368–$369
Extended: $400–$402 (1.618–2.618 fib levels).
Macro Catalysts & Market Context:
Fed Rate Sentiment Improving: Powell hinted at possible September rate cuts; markets rallied with Tesla leading, rising 6%.
Value Sense Blog
+6
Barron's
+6
Investors
+6
Investopedia
+1
EV Tax Credit Flexibility: New IRS guidance allows buyers to secure the $7,500 credit via contracts before Sept 30, potentially boosting demand.
Investors
+1
Mixed Q2 Fundamentals: Q2 saw declining deliveries & regulatory credits; Musk warned of “rough quarters” ahead, but emphasized AI & robotaxi growth.
Investors
+6
Investors
+6
New York Post
+6
Geopolitical Risks & Tariffs: Tariff pressure, fading EV credits, and sales underperformance in key regions keep long-term risks present. Analyst targets range widely.
Investopedia
MarketWatch
Value Sense Blog
Investors
Probabilistic Outcome Mix:
Base Case (50%) → $346–$368 (near-term resistance test aligned with AI target)
Bull Extension (25%) → $387–$402 if macro tailwinds persist and structure sustains breakout
Bear Risk (25%) → Breakdown below $340 could retest $313–$301
Trade Setup Breakdown:
Long Entry: $340
Stop: $315
Take Profit #1: $368
Take Profit #2: $388
Option: scale into $400s if breakout momentum holds
Why It Matters:
This setup represents AI-driven momentum meeting technical trend alignment and favorable macro catalysts. If Fed signals, EV policy flexibility, and optimism around Tesla’s AI/autonomy can power continued upside, $387–$400 becomes very plausible. However, macro risks and execution hurdles need monitoring.
TL0 trade ideas
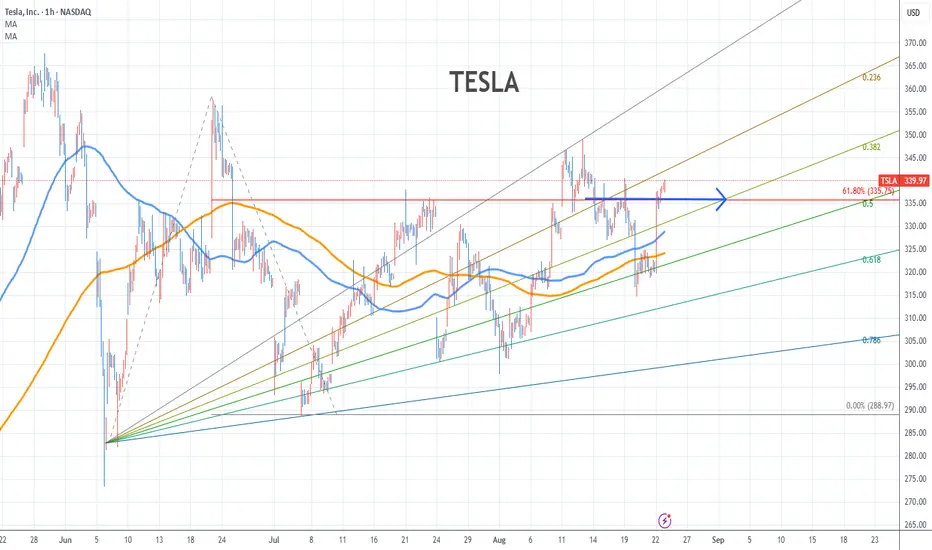
Tesla Stock Chart Fibonacci Analysis 082225Trading Idea
1) Find a FIBO slingshot
2) Check FIBO 61.80% level
3) Entry Point > 335/61.80%
Chart time frame:B
A) 15 min(1W-3M)
B) 1 hr(3M-6M)
C) 4 hr(6M-1year)
D) 1 day(1-3years)
Stock progress:C
A) Keep rising over 61.80% resistance
B) 61.80% resistance
C) 61.80% support
D) Hit the bottom
E) Hit the top
Stocks rise as they rise from support and fall from resistance. Our goal is to find a low support point and enter. It can be referred to as buying at the pullback point. The pullback point can be found with a Fibonacci extension of 61.80%. This is a step to find entry level. 1) Find a triangle (Fibonacci Speed Fan Line) that connects the high (resistance) and low (support) points of the stock in progress, where it is continuously expressed as a Slingshot, 2) and create a Fibonacci extension level for the first rising wave from the start point of slingshot pattern.
When the current price goes over 61.80% level , that can be a good entry point, especially if the SMA 100 and 200 curves are gathered together at 61.80%, it is a very good entry point.
As a great help, tradingview provides these Fibonacci speed fan lines and extension levels with ease. So if you use the Fibonacci fan line, the extension level, and the SMA 100/200 curve well, you can find an entry point for the stock market. At least you have to enter at this low point to avoid trading failure, and if you are skilled at entering this low point, with fibonacci6180 technique, your reading skill to chart will be greatly improved.
If you want to do day trading, please set the time frame to 5 minutes or 15 minutes, and you will see many of the low point of rising stocks.
If you want to prefer long term range trading, you can set the time frame to 1 hr or 1 day
Bullish wedge, again..?If TSLA breaks through this wedge an Elliot Wave and Fib Extension suggest wave 5 would be reached $426.70. I made this chart Thursday and did not publish. Fridays move I don't count because the entire market went up with J Powell said NOTHING. So on a pullback I'd look to enter a position, this move should come in 4-6 weeks or less as wave 5 on TSLA usually lasts a month

#TESLA - $40 Swing?Date: 14-08-2025
#Tesla - Current Price: 339
#Tesla Pivot Point: 339 Support: 331 Resistance: 347
#Tesla Upside Targets:
| 🎯 Target 1 | 356 |
| 🎯 Target 2 | 365 |
| 🎯 Target 3 | 374 |
| 🎯 Target 4 | 384 |
#Tesla Downside Targets:
| 🎯 Target 1 | 323 |
| 🎯 Target 2 | 314 |
| 🎯 Target 3 | 304 |
| 🎯 Target 4 | 295 |
#TradingView #Nifty #BankNifty #DJI #NDQ #SENSEX #DAX #USOIL #GOLD #SILVER

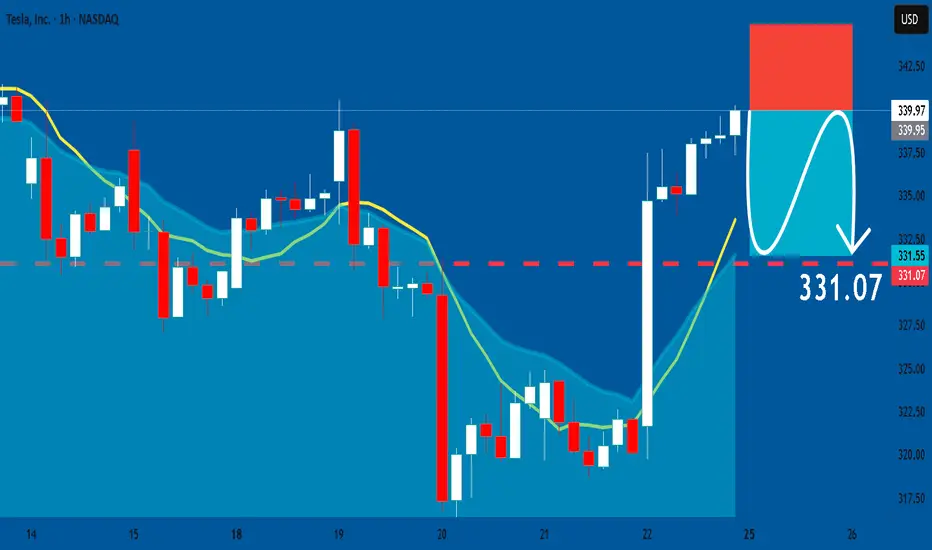
TESLA: Short Trading Opportunity
TESLA
- Classic bearish formation
- Our team expects fall
SUGGESTED TRADE:
Swing Trade
Sell TESLA
Entry Level - 339.97
Sl - 344.91
Tp - 331.07
Our Risk - 1%
Start protection of your profits from lower levels
Disclosure: I am part of Trade Nation's Influencer program and receive a monthly fee for using their TradingView charts in my analysis.
❤️ Please, support our work with like & comment! ❤️
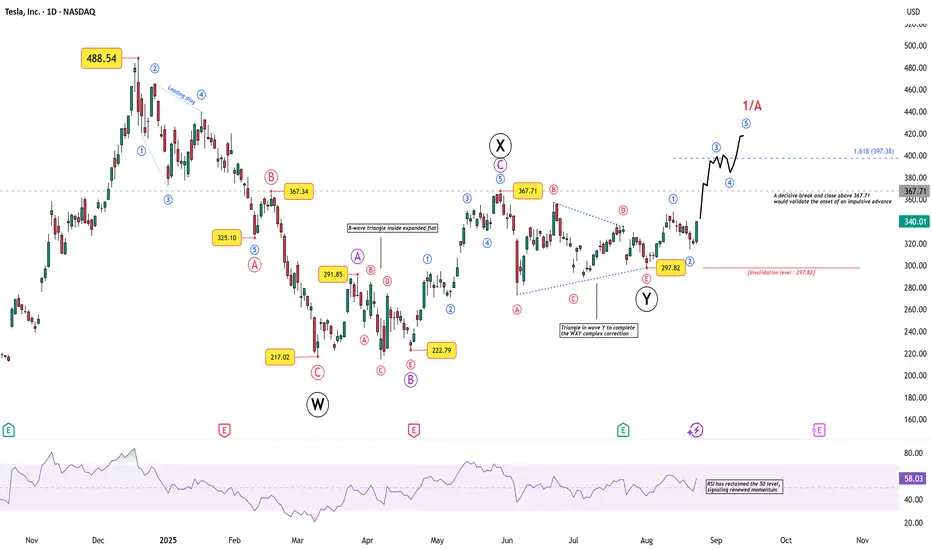
Tesla’s Breakout Test: Impulse or Fakeout?Tesla’s recent price action is stirring interest again, not just for retail traders but also for chart technicians who track Elliott Wave structures across global equities.
After a deep corrective phase that carried price down from 488.54 to 217.02 , Tesla has been carving out a multi-layered corrective structure. Here’s the breakdown:
Wave W completed into 217.02 , marking a sharp low.
This was followed by a complex X wave , which included an expanded flat where the B-wave unfolded as a triangle — a rare but valid corrective formation.
Wave Y then ended with a contracting triangle, neatly completing the W–X–Y correction near 297.82 .
From that point, Tesla appears to have begun an impulsive sequence:
Wave 1 and 2 are already visible, with the 297.82 low as the key invalidation level.
A decisive break and close above 367.71 would confirm the onset of Wave 3, targeting 397.38 (1.618× Wave 1).
Momentum is supporting the structure: RSI has reclaimed the 50 level, hinting at renewed strength.
What Next?
If the count holds, Tesla could be in the early stages of a larger impulsive rally, with Wave 1/A projecting toward the 400–420 zone . However, traders should remember that breaking below 297.82 invalidates the impulsive outlook and revives the broader corrective scenario.
Disclaimer: This analysis is for educational purposes only and does not constitute investment advice. Please do your own research (DYOR) before making any trading decisions.
TSLA on verge of major breakout on weekly?I have been waiting for this one... I averaged down. I bought call options. I bought TSLA 2x leverage in the form on TSLL. About f' ing time.
We had a false break out, a retest and now breaking out again. Momentum swinging to the upside and institutions are already in. Get ready for retail fomo.
A few good reasons why a person would want to buy. (Not financial advice)
Some current bullish catalysts for TSLA (Tesla) as of August 2025 include:
Full Self-Driving (FSD) Upgrades: Elon Musk announced Tesla is training a new FSD model with nearly ten times more parameters. A major software and video compression upgrade is scheduled, with an enhanced FSD vehicle targeted for release by the end of September. Progress toward regulatory approval in Europe and Australia is also in focus.
Robotaxi Expansion: Tesla is expanding its robotaxi launch into new U.S. regions (such as Northern California, Nevada, Arizona, Florida) with hands-free/eyes-off autonomy for FSD owners expected by year-end. The robotaxi rollout is a major narrative driver for growth.
Optimus Project: Tesla's humanoid robot initiative, Optimus, is expected to enter scale production in 2026. Optimus could open new growth sectors for Tesla beyond autos.
Technical Strength: TSLA recently bounced off key moving averages (the 50-day and 100-day SMA), with options activity (especially call volume at $340 strike) suggesting bullish sentiment. A breakout above $350 is viewed as confirming a renewed uptrend.
Macroeconomic Tailwinds: Dovish signals from the Federal Reserve have bolstered risk assets, supporting growth stocks like Tesla and improving sentiment in the sector.
Uptrend Indicators: The 10-day moving average crossed above the 50-day moving average (bullish), and the Aroon Indicator signaled an uptrend, historically associated with continued gains for TSLA.
TSLA: The thesis is coming to lightTesla is executing on Robotaxi's.
Poking holes through the FUD, and misleading articles.
Investors are beginning to see the thesis on the inevitable S curve that's incoming.
Speaking of incoming... $400 looks like a possibility in the coming month

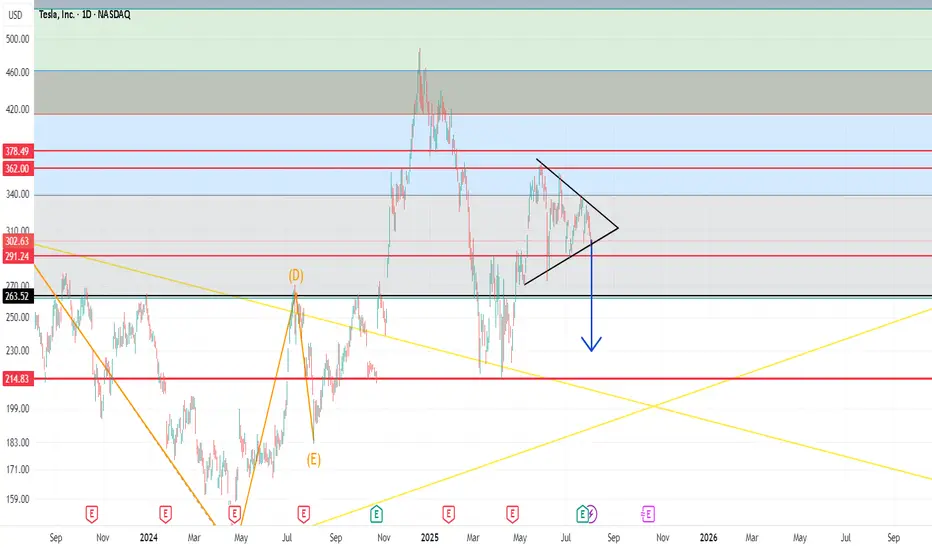
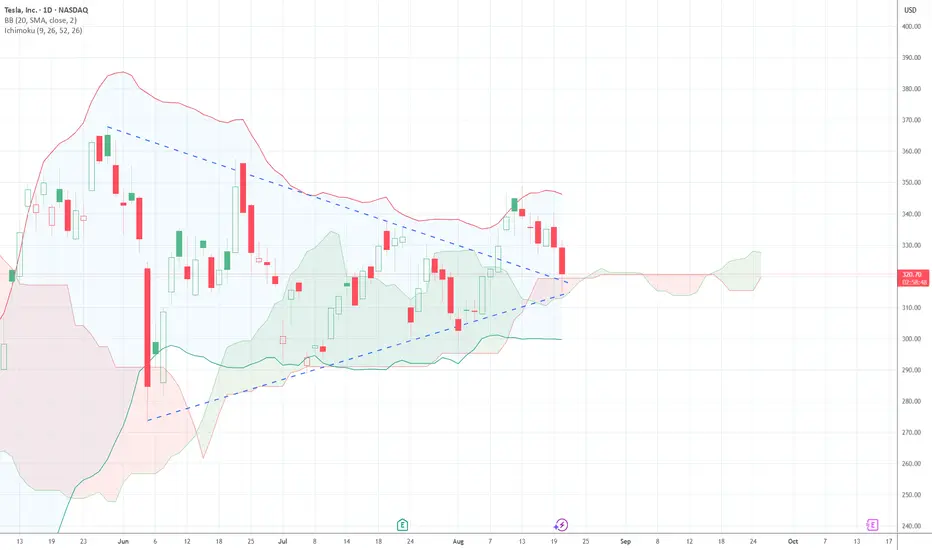
$TSLA looks "Cheap" but it can always get cheaperTSLA has been consolidating in a flag here. While price could break up out of it, I actually lean towards price breaking to the downside. The reason is because there have been more tests on the downside, and I think if price falls and tests it again, it'll break.
That and, if you turn on Heikin Ashi candles, it looks like bearish momentum is starting on higher timeframes (1D-4D) and Ichimoku giving bearish warning signals in the cloud formation.
I think the most likely outcome is that we break lower and go test the box below for a new low. Everyone would get bearish down there, but that will be a great level to buy for the long term.

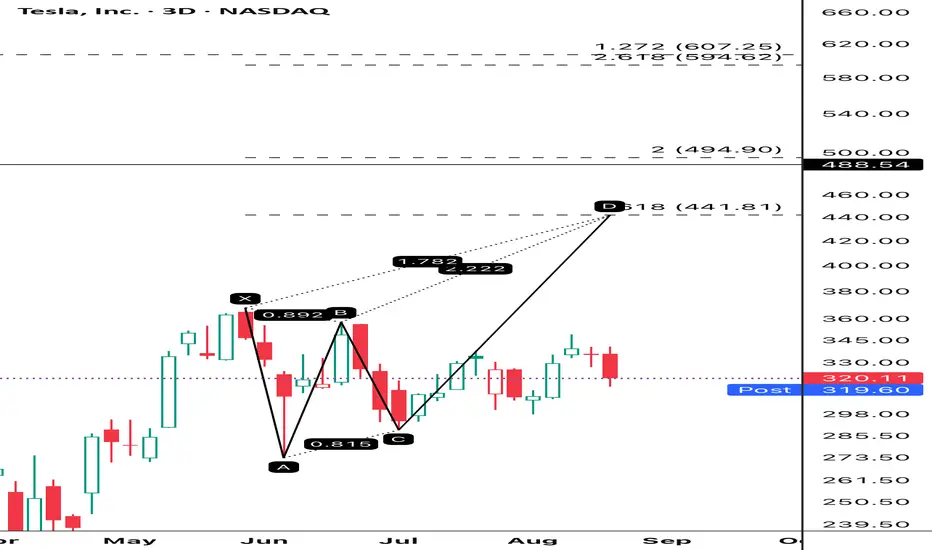
TSLA Is A BuyHello,
TSLA is showing a Deep Crab harmonic pattern.
Targets:
1) $450
2) $500
3) $550
4) $600
a flag breakout can be a bullish trade ideahere as per technical analysis , we can see several factor which can
aide a bullish take on TESLA stock on a very short term time frame .
1) pole and flag
2) prices above 20 Day sma ( h)
3) monthly pivot ( traditional ) crossover upside
Pole and flag : a pole and flag which has a decreasing volume during the flag formation , and not having much of retracement , aides the bullish view here
20 DSMA :till the time prices are above the 20 day sma (high) , we can keep our bullish trade intact ,
Pivot level monthly : recently the stock has crossed over monthly pivot level ( traditional ) , in an assuring manner
prices forming a floor above floor structure , where the prices are showing their initial motive towards upside , and then correcting in a slow manner in a retracement manner . a good time has been spent in the shadow of the impulsive motive ( upside ) , which creates a stronger base for the prices and shows no major selling has been happening here , and the profit booked at the higher levels are being bought out again ( re-entry into the market )
break of structure , the lesser candles demand zone which actually created a break of strcuture was respected recently ,
action plan , as soon as the flag pattern is breached on the upside , with a good volume candle , one can have a bullish entry here .
stoploss level at 330 , target price : 15% after the breakout of the flag.

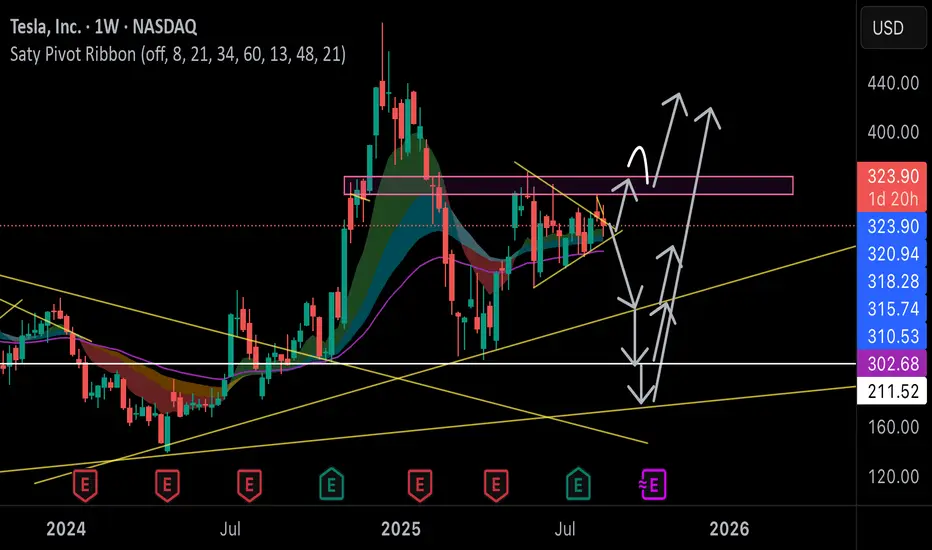
TSLA: WAVE CTSLA has been consolidating within a range since early June and is expected to breakout over the next few weeks. As the markets are due to end a minor wave 4, the final wave 5 should allow TSLA to breakout out to the upside to a potential target of $422.

Heads Will Roll (Tesla Bankruptcy)Imminent bankruptcy in Tesla.
Deep fraud under investigation, shortly to be published.

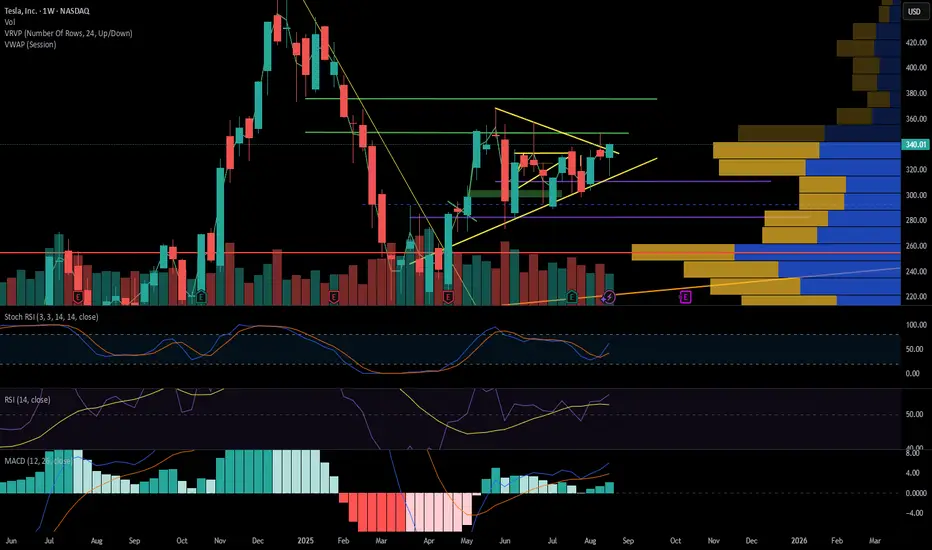
Tesla - NEED MORE TIME! We are a critical ranging market🔎 Weekly View
Tesla has been consolidating between $278 major support and the $337 resistance zone.
Support: Buyers continue to defend the $278–$300 demand region, which aligns with the 50-week EMA.
Resistance: The $337 level has repeatedly rejected price, acting as strong buy-side liquidity.
MACD: Showing weak bullish momentum — histogram fading, suggesting limited buying pressure unless a breakout confirms.
Bias: Neutral → Accumulation Phase until a decisive break occurs.
📉 Daily View
Price action shows a tightening range inside a contracting wedge.
Current Structure: Price tapped the $337 resistance and pulled back toward support ($316–$320).
Key Zone: $316 is acting as local support, but if broken, Tesla could revisit the major demand zone near $278.
Upside Projection: A breakout above $337 could fuel a run toward $380–$420 liquidity.
Bias: Range-Bound short term — watch $316 as immediate pivot.
⏱ 4H Intraday View
Tesla is trading choppy within liquidity sweeps.
Weak Buying Pressure after testing the top of the wedge.
Potential move: Price may dip back into support ($300–$316) before attempting a bullish push.
Breakout Path: A successful hold at support followed by a break of $337 unlocks buy-side liquidity toward $400.
Bias: Patience needed — Wait for either:
Bullish trigger above $337 → target $380/$420.
Breakdown under $300 → target $278 support.

Bearish Triangle: TSLAWaiting for TSLA to breakout 292 to form a bearish triangle pattern.
Target price: 22X
TESLA 20TH AUGUST 2025price action for Tesla is here. I have clearly explained my plan on how to trade tesla considering every factor in market.
NOTE: OPTION WILL BURN YOUR CAPITAL

TeslaLooking at the current price action from today, we have a couple of options as to what is going on. The first one I want to discuss aligns with the orange count. This recent move lower could be the b wave of C of (B). If that is the case, then we should be headed higher very soon towards the orange box to finish out the intermediate (B) wave.
If that is not the case, then that would imply that we have started the c of (c) of A of (C). If the white count is correct, I would anticipate it to be strong move as it would be a c wave of multiple different degrees.
Either way, both moves that this could be, IMO, are each c waves of some degree. This implies that the next move should have some strength to it. I continue to favor the orange count, but as mentioned prior, they're both easily possible.

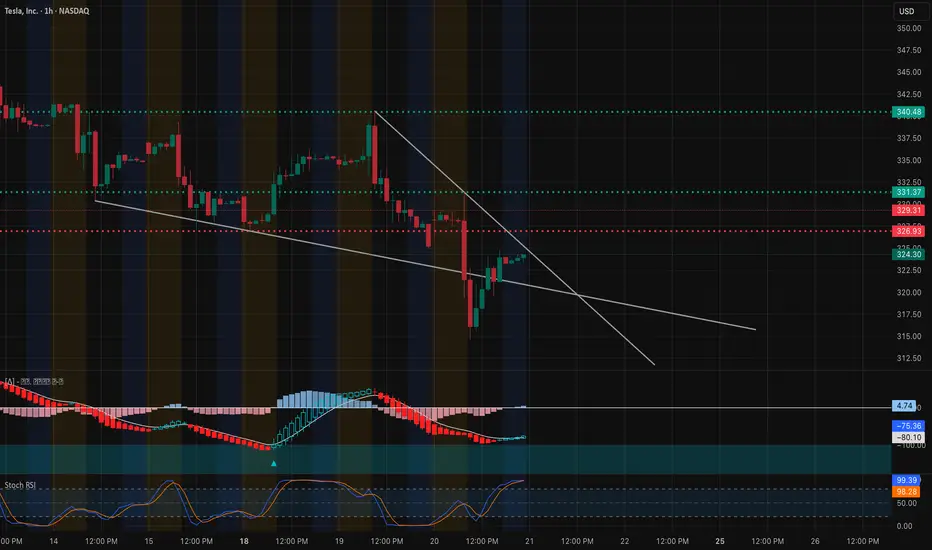
Tesla (TSLA) – Testing Critical Support Zones! Aug 21Technical Analysis (1H Chart)
TSLA is currently trading near $324–325, bouncing after a sharp drop from the $340+ region.
* Trendline & Structure:
Price is still under a descending trendline, which acts as immediate resistance. To shift bullish, TSLA must reclaim $331–332 (prior support turned resistance).
* Support Zone:
Buyers stepped in around $317–320, which is now the short-term demand zone. Losing this could open downside into $312–315.
* Resistance Levels:
First key resistance: $331–332, followed by $340–344 if momentum extends.
* Indicators:
* MACD: Bearish but showing signs of flattening out, suggesting momentum slowdown.
* Stoch RSI: Deeply oversold earlier, now pushing higher → potential for short-term bounce.
Scenarios:
* Bullish: If TSLA breaks above $331–332, momentum could push toward $340–344.
* Bearish: Rejection under $331 likely leads to retests of $320–317, with risk extending to $312–315.
Options Sentiment / GEX (1H)
From the GEX chart:
* Call Walls / Resistance:
* 340–345: Heavy call resistance zone (64%+ concentration) → strong cap unless major momentum shift.
* 348–350: Extreme resistance (GEX9 level).
* Put Walls / Support:
* 325: Highest negative NET GEX (dealer hedging zone), acting as strong support magnet.
* 320 / 317.5: Stacked put walls, critical defense area.
* 315: 2nd major put wall — losing this level could accelerate downside.
GEX Bias:
* Market makers pinned TSLA between 325 support and 340 resistance.
* Upside capped unless 332 is broken; downside risk grows sharply if 317 fails.
Trade Thoughts & Suggestions
* Bullish Setup: Calls only make sense above 332 (target 340–344).
* Bearish Setup: Favor puts if price rejects under 331 or breaks below 320 (target 317, then 315).
* Neutral chop likely if TSLA stalls between 325–331.
Disclaimer: This analysis is for educational purposes only and not financial advice. Trade at your own risk.
Possibilities NASDAQ:TSLA Long tern scenarios, anything is possible.$$350 is key to maintain for push up to $420++
TESLA is going to rise to 420$Based on my analysis, TSLA is going to reach to 420$ from almost 330$.
This is based on the trend that TSLA broke. It broke it upwards, then, retested the price again, and it will soon go up to 360$ after that it will reach 380$ then nothing will stop it until 420$.

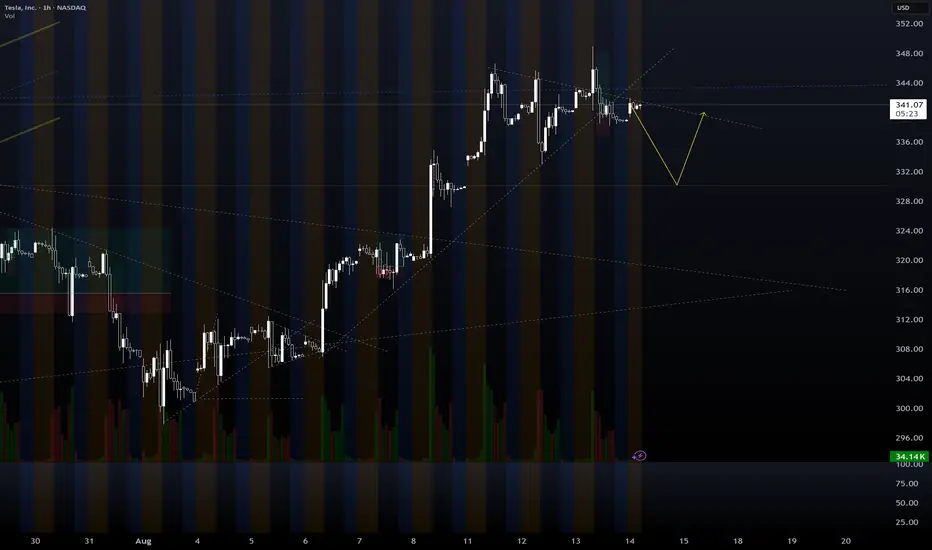
TSLA daytrading (fill gap)1. tsla still have a gapp need to fill
2. tsla break down the trend line could pull back a little bit
* in the past tsla is not often fill fill the gap so just watch. dont put down
TSLA 4th Time's a CharmBouncing off the daily cloud, and backtesting the trendline. Looks good for a bounce...
TSLA shortsThis is a very overzealous profit target but the technical aspects are there and over the long term based on the technicals the trade idea is supported. I will look for signatures in price at various levels and determine if I'll hold the trade along the way.
