Volatility Declines Amid Flat Trading
HBAR’s Average True Range (ATR) has been steadily declining since August 3. The ATR gauges price movement; a falling ATR indicates shrinking fluctuations and low market momentum.
Without fresh catalysts, HBAR may remain range-bound for the near term, as volatility continues to compress.
HBAR is in a state of balance, showing indecision from both buyers and sellers. Traders should watch for potential catalysts to trigger the next directional move.
Trade ideas

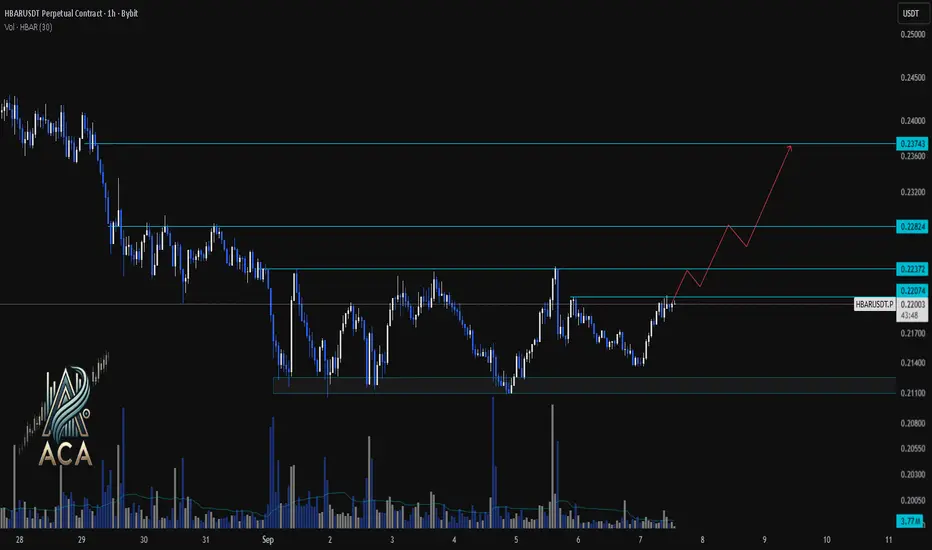
HBARUSDT 1H Chart Analysis | Bullish Structure in PlayHBARUSDT 1H Chart Analysis | Bullish Structure in Play
🔍 Let’s break down the recent price action for the HBAR/USDT perpetual contract and outline the roadmap for potential bullish continuation.
⏳ 1-Hour Overview
The 1-hour chart shows HBAR recovering from a strong demand zone near $0.21100, pushing upward with notable momentum. Price action is now challenging immediate resistance at $0.22372, with higher levels at $0.22824 and $0.23743 presenting the next bullish targets.
🔺 Long Setup:
A decisive close and hold above $0.22372 could fuel further upside, targeting the $0.22824 resistance next. Sustained bullish volume and higher lows may pave the way for an extension up to $0.23743, aligning with the drawn projection path.
📊 Key Highlights:
- Strong defense of the $0.21100 support region led to a sharp rebound.
- Immediate resistance stands at $0.22372, with the bullish path mapped toward $0.22824 and $0.23743.
- Volume spikes on upward candles indicate increasing buyer interest and potential for trend follow-through.
🚨 Conclusion:
HBARUSDT is building a bullish structure above local support, with momentum favoring continued upside if $0.22372 flips into support. Watching volume and reaction at key resistance areas remains crucial for confirming the next leg higher.
HBAR/USDT ideasI have indicated upon the chart, my two probabilities for a 1.short or 2.long, trade setup. Depending on variables, we will watch and see what option presents itself. All the best.

Hedera (HBAR): Expecting Good Bounce From Here | BullishHBAR is about to form a BOS, which, combined with daily time frame retests of zones, might result in an explosive breakout!
More in-depth info is in the video—enjoy!
Swallow Academy

HBAR Price Ready for $0.23 Breakout? Hedera 4H Chart Targets ExpHedera HBAR is approaching a key decision point on the 4-hour chart. In this update, I outline the critical support and resistance levels that will determine whether bulls can push toward $0.23 and beyond. My bias mid-term remains for upside, but price must reclaim levels step by step before momentum can fully shift.
We also look at how Bitcoin’s resistance battle at $112,190 connects to HBAR’s outlook. If BTC sustains recovery, HBAR has room to extend toward $0.24–$0.25. If not, downside levels at $0.20 and $0.19 become the key defense lines. Watch this analysis to see what to expect next.

HBAR - bullish structure daily & Monthly!🟢 #HBAR - Price Analysis
🔼 Possible Ascending Triangle on monthly (see last chart!)
🟣 Weekly structure looks healthy, clean 50% fib retest at $0.2100
⚡️ Technically:
Bull flag in play if support holds here!
Possible next leg up loading 📈
Watching for a retest of the monthly resistance (triangle zone)
Short Term:
→ Neutral zone: $0.2250 – $0.2100
→ Big upward move possible on resistance break.
→ Risk: Daily close under $0.2100 would flip momentum bearish!
💡 Keep an eye on the upper daily trendline!
HTF Resistances: $0.2680 | $0.2700 - $0.2900 - $0.400
Key zones all mapped out on my charts 👀

HBAR Price Rebound on the Cards as Bears Lose GripThe BINANCE:HBARUSDT price was trading near $0.219 after rising 2.6% in the past 24 hours. Despite a 7% drop on the monthly chart, HBAR has gained more than 330% over the past year, showing that the broader trend is still positive.
On the daily chart, the BINANCE:HBARUSDT price remains inside a descending triangle. Key support sits at $0.210, while the next resistance zone is between $0.235 and $0.249. Losing $0.210 could open the way to $0.187, but reclaiming $0.235–$0.249 would be the first signal of strength.
A hidden bullish divergence has also formed, as price made a higher low while the Relative Strength Index (RSI), which measures momentum, made a lower low. This often points to continuation of the broader uptrend, adding weight to the bullish case.
On the 4-hour chart, early dip-buying signs are also visible. The Money Flow Index (MFI) has been trending higher, and the Bull–Bear Power indicator shows that sellers are weakening. Together, these shorter-timeframe signals support the idea that the bearish grip may be loosening.

What To Expect From HBAR Price In September 2025?At the time of writing, BINANCE:HBARUSDT trades at $0.218, down 9% over the past month. The persistent outflows suggest continued weakness, leaving the altcoin vulnerable to further decline. Should selling continue, HBAR could slip to $0.205, extending its drawdown and reinforcing bearish momentum in the short term.
Historically, September has been a poor month for BINANCE:HBARUSDT . On average, the token has declined 10% during this period, with a median drop of 5%. Based on this pattern, the probability of another drawdown remains elevated, aligning with current technical signals that highlight weakening support levels.
If inflow returns and investor sentiment improves, BINANCE:HBARUSDT could bounce back to reclaim the $0.230 support. Holding this level would be crucial for triggering recovery. A complete reversal would require the token to climb toward $0.271 or higher, signaling renewed strength after months of bearish market activity.

HBARUSDTHBARUSDT – Bears in control.
🔵 CCI below –100, 🔴 RVI bearish cross, 🟠 AO red under zero.
Ichimoku Lagging Span sits below Kijun and price → confirming bearish structure.
👉 Looking for continuation lower.
⚠️ Not financial advice.

Buy HBARHBAR is the native cryptocurrency of the Hedera network, a high-performance, enterprise-grade public blockchain alternative that uses a unique consensus algorithm called Hashgraph.
Governed by a 39-member global Governing Council, including:Google, IBM, Boeing, Dell, Ubisoft, Deutsche Telekom. These members run nodes and vote on governance, making the network decentralized, but enterprise-friendly.
HBAR still in the box formed since January 2021 but it has potential to break-out. Actually, the first leg-up has started and curently price is consolidating before the second legup. with potential to break out the box.
Trade setup is as in chart Target is estimated based on market cap of 11B.


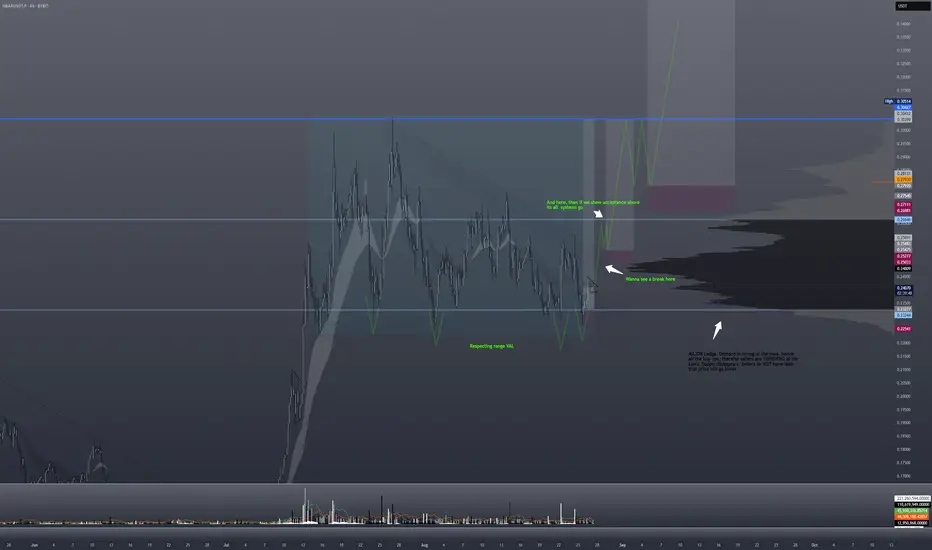
HBAR respecting range VAL. Long and looking to addHBAR has been coiling in this triangle, since July. Every time we gotten to the bottom of the range, supply evaporates, as evidenced by the steep and sharp ledge on the range VP. Buyers are stepping in aggressively at the lows so no shortage of demand. Sellers seem to have very little belief that selling below the range VAL is a good idea.
I am long from the VAL, looking to add after a breakout of the upper trend channel, once price is above the volume shelf and showing strength.
Good luck all
-Trend_Chaser
HBAR about to make new ATHsHBAR is currently c. 0.27% of the total crypto market. I expect this to go up higher as HBAR.D could potentially hit 0.65% and 1%. HBAR should now be considered an OG crypto especially when it made an ATH in the previous cycle, and also likely to make another new ATH in the 24/25 cycle. Not all alt coins have this 'crypto heritage' - with many forming a broader ABC correction in the 20/21 cycle unable to break out to make new ATHs - eg. XRP, XLM, BCH.
With its market cap coin ranking already being higher than the previous cycle (lingering around top 30-50 and now around top 15-20), I am expecting HBAR to find a new ATH. Keep an eye out on the resistance line formed from the previous cycle. If it can break that resistance line, then we can see HBAR hit the next level at $2. HBAR/BTC should also be used to navigate when the top is in.
Key Targets:
1. $0.90~$1.30 (highly probable)
2. ~$2 (moonshot)
3. ~$3.30 (unlikely)
HBAR to the MOON

Hedera (HBAR): Looking For Breakdown + Fill of Bearish CMEHBAR has recently broken the branch of EMAs, which have been holding the bullish trend for a while.
Now that we have broken the branch of EMAs, we are expecting to see the sellers keep control over that zone, which would lead the price towards the bearish CME gap; filling it would be a good bullish sign, so that's what we are aiming for right now!
Swallow Academy

HEDERAHBAR/USDT Chart Analysis
HBAR/USDt Timeframe Daily
1. Trend and Pattern Identification
The chart shows a strong uptrend from early July to mid-August. After reaching a peak around the $0.30 price level, the price entered a sideways movement (consolidation). The current price action indicates that HBAR is retesting an important support area after its significant rise.
2. Key Support and Resistance Levels
* Main Resistance Level: Located around $0.26012. This is an area where the price struggled to break higher and often faced rejection.
* Key Support Levels: There are two important support areas to note:
* The Nearest Support: Around $0.23638. The current price is slightly below this level.
* Historical Support Area: A strong support zone is highlighted by the blue box, where the price consolidated in May and June. This is a highly relevant area to monitor.
3. Volume Analysis
The chart also shows trading volume. A significant volume spike (indicated by "1.114B D B8") occurred as the price moved up. This high volume suggests strong buying interest at that time. Subsequently, the volume appears to have decreased, which is common during consolidation or price correction phases.
Rationale for Entry Decision
Based on the analysis above, here are a few reasons to consider a long position on HBAR/USDT, while keeping risk management in mind:
Why Is Now a Good Time for Entry?
* Retesting the Support Area: The current HBAR price is near a strong historical support level (the blue box). This is often referred to as a "retest." If this area successfully holds the price from falling further, it could signal a continuation of the uptrend.
* Potential for a Rebound: The price drop from its peak to the support area can be seen as a healthy correction within an uptrend. If there is a price reversal signal (e.g., a bullish candlestick like a hammer or an engulfing pattern) in this area, the chance for a rebound increases.
Things to Watch Out For and Risks
* Confirmation Is Key: Do not enter a position solely because the price is near support. Wait for confirmation of a price reversal signal. This confirmation could be a bullish candlestick pattern or a significant increase in buying volume in the support area.
* Risk of a Support Breakdown: If the HBAR price breaks below the key support level, it could invalidate the bullish scenario and trigger a further decline. Therefore, it is crucial to set a tight stop-loss point, for example, below the historical support area, to limit potential losses.
Summary of Key Events
In summary, the HBAR/USDT chart shows a strong uptrend from July to mid-August, followed by a correction or consolidation phase. The price is currently testing a key support area. The decision to enter a long position should be based on confirmation that this support area will hold and not be breached.

Hbar is forming a tradable structureBAR is printing many tradable structures on major timeframes. The current one is the possible bull flag with a great RR. Keeping in mind that the daily momentum and trend are still showing negative pressure. Keep your POI hand as the PA unfolds.

HBAR/USDT – Gearing Up for a Major Bullish Wave!🚀 Trade Setup Details:
🕯 #HBAR/USDT 🔼 Buy | Long 🔼
⌛️ TimeFrame: 1D
--------------------
🛡 Risk Management (Example):
🛡 Based on $10,000 Balance
🛡 Loss-Limit: 1% (Conservative)
🛡 The Signal Margin: $374.39
--------------------
☄️ En1: 0.19607 (Amount: $37.44)
☄️ En2: 0.17665 (Amount: $131.04)
☄️ En3: 0.16401 (Amount: $168.48)
☄️ En4: 0.15228 (Amount: $37.44)
--------------------
☄️ If All Entries Are Activated, Then:
☄️ Average.En: 0.17047 ($374.39)
--------------------
☑️ TP1: 0.25245 (+48.09%) (RR:1.8)
☑️ TP2: 0.305 (+78.92%) (RR:2.95)
☑️ TP3: 0.38787 (+127.53%) (RR:4.77)
☑️ TP4: 0.5266 (+208.91%) (RR:7.82)
☑️ TP5: 0.73806 (+332.96%) (RR:12.47)
☑️ TP6: Open 🔝
--------------------
❌ SL: 0.12493 (-26.71%) (-$100)
--------------------
💯 Maximum.Lev: 2X
⌛️ Trading Type: Swing Trading
‼️ Signal Risk: 🙂 Low-Risk! 🙂
🔎 Technical Analysis Breakdown:
This technical analysis is based on Price Action, Elliott waves, SMC (Smart Money Concepts), and ICT (Inner Circle Trader) concepts. All entry points, Target Points, and Stop Losses are calculated using professional mathematical formulas. As a result, you can have an optimal trade setup based on great risk management.
📊 Sentiment & Market Context:
Hedera Hashgraph (HBAR) is showing strong bullish potential on the daily timeframe, supported by increasing volume and a solid base formation around key demand zones. With broader altcoin sentiment improving and BTC showing stability, HBAR could be poised for a breakout rally in the coming weeks.
🔍 Fundamental Highlights:
HBAR powers the Hedera network, a next-gen public ledger built on a unique Hashgraph consensus mechanism—faster, more secure, and more scalable than traditional blockchains. With real-world enterprise partnerships (like Google, IBM, and Boeing), Hedera’s ecosystem continues to gain momentum as Web3 adoption expands.
⚠️ Disclaimer:
Trading involves significant risk, and past performance does not guarantee future results. This analysis is for informational purposes only and should not be considered financial advice. Always conduct your research and trade responsibly.
💡 Stay Updated:
Like this technical analysis? Follow me for more in-depth insights, technical setups, and market updates. Let's trade smarter together!

Habar short to $0.22912Just now opened another position on hbar. Close a while ago but seems liked a fakeout.
Sl: 0.23678
tp: 0.22912
Roughly 2 rr

HBAR-SYMMETRICAL TRIANGLE BREAKOUTHedera has been consolidating inside a massive symmetrical triangle since late 2023. The structure is clear, with higher lows from November 2023 and lower highs from April 2024. Price is now trading near the apex, suggesting a decisive move is imminent.
🔹 Support Zone: $0.20 – $0.21
🔹 Resistance Zone: $0.25 – $0.27
Bullish Scenario:
A confirmed breakout above $0.27 with strong volume could trigger a major rally. The measured move from the triangle projects targets towards $0.55 – $0.60. Key resistance levels to watch on the way up:
$0.30
$0.35
$0.45
Final target: $0.55+
Bearish Scenario:
If price breaks below $0.20, the triangle setup would fail, with possible pullbacks towards $0.18 → $0.15 → $0.12.

HBARUSDT — Retest of Demand Zone After Breakout?HBAR/USDT is currently in a crucial retest phase after a strong breakout from its key accumulation zone around 0.199–0.217 (yellow box, Fib 0.5–0.618 area). The recent rally toward 0.29–0.30 highlighted strong buying momentum, but price is now consolidating near 0.243, suggesting a healthy pullback before the next potential move.
This structure often signals a bullish retest after breakout — but if key support levels are lost, it could trigger a deeper correction.
---
🔍 Structure & Pattern
Previous phase: HBAR traded sideways for months within a large range.
Recent move: Clean breakout above the accumulation zone.
Current phase: Retesting the demand zone.
Pattern in play: Bullish Retest / Flag Consolidation on the daily timeframe.
Bullish continuation trigger: Daily close above 0.29197 with volume confirmation.
Bearish invalidation: Daily close below 0.19928 (Fib 0.618).
---
📌 Key Technical Levels (1D)
Support (Demand Zone):
0.21707 (Fib 0.5) → first line of defense.
0.19928 (Fib 0.618) → strongest support; bullish invalidation if broken.
Resistance Levels:
0.26511 → minor resistance.
0.29197 → major resistance / breakout trigger.
0.33037 → TP1.
0.37526 → TP2.
0.40139 → local high & ultimate mid-term target.
Downside targets (if breakdown):
0.160–0.140 → prior consolidation zone.
0.093–0.087 → historical low.
---
🚀 Bullish Scenarios
1. Conservative (Breakout Buyer):
Entry: Daily close above 0.29197
Stop: Below 0.26511
Targets: 0.33037 / 0.37526
Potential reward: +35% to +54% from current levels
2. Aggressive (Buy the Dip):
Entry: 0.217–0.199 demand zone
Stop: Below 0.199 (bullish invalidation)
Targets: 0.265 / 0.292 / 0.330
Attractive R:R potential (>1:3) if demand holds
---
⚠️ Bearish Scenarios
1. Breakdown of 0.199:
Daily close below 0.199 → structure invalidated.
Downside targets: 0.16 → 0.14, and possibly 0.087 (historical low).
2. Rejection at Resistance:
Failure to break 0.292 + formation of a lower-high = possible range or distribution phase.
Price could revisit 0.217 demand zone again.
---
📈 Strategy & Risk Management
Aggressive traders: Buy dips at 0.217–0.199 with tight stops.
Conservative traders: Wait for confirmation above 0.292 before entering.
Risk management: Limit exposure to 1–2% per trade.
Extra confirmation: Watch for volume spikes or bullish candlestick reversals (hammer, engulfing) in demand zones.
---
✅ Conclusion
HBAR is in a critical demand retest. As long as 0.217–0.199 holds, the bias remains bullish, with mid-term targets at 0.33–0.37. A daily close below 0.199, however, would shift momentum bearish and open the door to a much deeper correction.
HBAR offers a high R:R opportunity for both aggressive dip buyers and conservative breakout traders — making it one of the setups to watch closely in the coming weeks.
#HBAR #HBARUSDT #Hedera #Crypto #TechnicalAnalysis #PriceAction #SwingTrade #Fibonacci

HBAR Eyes Bitcoin for Price Recovery Amid Market UncertaintyBINANCE:HBARUSDT is currently consolidating, trading at $0.255 while oscillating between $0.271 and $0.244 . The narrow range reflects investor caution, with traders awaiting external market cues. Without a decisive breakout, the altcoin may continue drifting sideways in the immediate term.
If Bitcoin strengthens and resumes its rally, BINANCE:HBARUSDT could break resistance at $0.271. Such a move may open the door for gains toward $0.291, with potential upside extending further if bullish conditions persist.
Alternatively, a Bitcoin downturn could drag BINANCE:HBARUSDT lower, pushing it beneath $0.244 support. In such a scenario, the altcoin risks falling to $0.230, undermining the bullish thesis and reinforcing caution among investors.

HBAR Bull Flag Is Ready to Explode, But Only If One Level FallsYello, Paradisers! Is #HBAR quietly setting up for its biggest breakout of the year? The chart is heating up fast, and the next move will be decisive.
💎Since forming a double bottom around $0.128, HBAR has bounced sharply, showing clear strength. The price action is now shaping into a potential bullish flag pattern, but the bulls are stuck at a critical barrier.
💎The $0.285–$0.30 zone is proving to be a major challenge, as it combines both horizontal resistance and the 61.8% Fibonacci retracement. Since mid-July, not a single daily candle has been able to close convincingly above this level, a clear sign of just how important this wall is.
💎For #HBARUSDT, a strong breakout and close above $0.30 with real volume would open the doors to a major bullish move, targeting the $0.380–$0.410 zone. This range not only marks the next strong resistance but also aligns with HBAR’s 52-week high.
💎On the downside, solid support lies between $0.235–$0.22, a zone that has held firm since mid-July within a converging triangle formation. As long as HBAR stays above this range, the bullish setup remains valid, and the breakout pressure continues to build.
Paradisers, strive for consistency, not quick profits. Treat the market as a businessman, not as a gambler.
MyCryptoParadise
iFeel the success🌴

HBAR’s ABC Setup — Short-Term Pain, Long-Term Gain?HBAR has been consolidating sideways for the past 30 days, with $0.27 acting as a clear resistance — aligning with the golden pocket (GP). Price failed to sustain above the yearly open (yOpen) at $0.26901, despite multiple attempts. Each breakout attempt lacked follow-through → weakness.
Structurally, HBAR appears to be in a corrective phase after completing five Elliott waves, and is now potentially forming an ABC corrective pattern. Price has also lost the monthly open (mOpen) at $0.25099, which should now act as resistance.
🔴 Short Opportunity
Previous ideal entry: $0.27463 (Golden Pocket) — offered an R:R of ~1:7
Next short zone: Between mOpen ($0.25099) and yOpen ($0.26901)
Target: Around $0.21/$0.2 as take-profit (TP)
🟢 Long Opportunity Zone
➡️ Primary zone: $0.21 – $0.19675
🧩 Confluence factors:
FVG (Fair Value Gap) / imbalance fill
SSL (Support/Stop-Loss liquidity) positioned in the zone
Weekly level: $0.20685
0.55 Fib retracement: $0.20657 (aligned with the weekly level)
0.75 Fib speed resistance fan: Supports this zone if price reaches it between 19 – 25 Aug
1.0 trend-based Fib extension: $0.19675 (projected Wave C target of ABC)
Pitchfork lower support line intersecting with the zone
nPOC & key level: $0.2
With all these aligning, this is the most favourable long setup.
Long Trade Setup Example
Entry: $0.21– $0.19675
Stop Loss: Below $0.19
TP1: ~$0.223
Final target: $0.3+ (swing trade potential)
R:R: 1:6+
🔍 Indicators used:
DriftLine — Pivot Open Zones → For identifying key yearly/monthly/weekly/daily opens that act as major S/R reference points
➡️ Available for free. You can find them on my profile under “Scripts” and apply them directly to your charts for extra confluence when planning your trades.
_________________________________
💬 If you found this helpful, drop a like and comment!
