Daily support holds, HBAR may surge 20% to $0.273Hello✌️
Let’s analyze Hedera’s price action both technically and fundamentally 📈.
🔍Fundamental analysis:
SEC is reviewing Grayscale’s HBAR ETF, with a final decision due by Nov 2025.
If approved, it could boost liquidity and make HBAR look more “institutional grade.”
📊Technical analysis:
BINANCE:HBARUSDT trades inside a descending channel, supported by a daily level and trendline; if this zone holds, a potential 20% upside toward $0.273 may develop. 📈🚀
📈Using My Analysis to Open Your Position:
You can use my fundamental and technical insights along with the chart. The red and green arrows on the left help you set entry, take-profit, and stop-loss levels, serving as clear signals for your trades.⚡️ Also, please review the TradingView disclaimer carefully.🛡
✨We put love into every post!
Your support inspires us 💛 Drop a comment we’d love to hear from you! Thanks, Mad Whale
HBARUSDT.3S trade ideas

Its a good buy opportunity 📈 A strong impulsive move has formed from the 0.127$ level up to the 0.3$ area, and the market is currently in a corrective phase. This correction has taken the shape of a bull flag, with the price now consolidating near the bottom of the flag. From this zone, I expect the beginning of a new bullish trend toward a 0.263$ And 0.325$

HBAR 4H Analysis – Key Triggers Ahead💀 Hey , how's it going ? Come over here — Satoshi got something for you !
⏰ We’re analyzing HBAR on the 4-hour timeframe timeframe .
👀 On the 4H timeframe for HBAR , we can observe that this coin is ranging inside a box with very strong support and resistance levels. The last time, it reacted to the midline of this box (50% zone) and has built a trading structure for a potential breakout.
⚙️ The key RSI levels are at 57 and 35. Once the oscillation surpasses these levels, the price of this coin can shift and bring momentum into the market. Keep in mind that these zones often indicate increased volatility in the direction of price movement.
🕯 The volume of this coin has been decreasing over the past few days, and the number of trades has significantly dropped. Many buy and sell orders have been filled, and the coin is currently ranging in this box, deciding its next direction. Notice that with declining volume, we can often identify a new trend forming, since the current trend may be coming to an end.
📊 On the OTHERS.D index 4H timeframe , we can see that it is also moving inside a box, with the top of the box at the 7.9% zone . Breaking this level along with the RSI surpassing 63 could bring strong volume into the market. At the same time,
📊 a breakout on the TOTAL3 index would also inject solid volume into the market. This index is likewise inside a box, and the last time it reacted to its midline, it rebounded upward and is now moving toward the 1.08 resistance.
💰 Looking at the HBAR/BTC pair , we can observe that it has formed a box-like structure, similar to its USDT pair. With a breakout above the midline, more Bitcoin could be liquidated and converted into this coin. HBAR is considered one of the whales’ favorite coins.
🔔 The alert zones for HBAR carry some risk, and the possibility of failure should also be considered. The long alert zone is around 0.25846, which is the midline of this 4H box. The short alert zone is around 0.22784. Breaking this zone could provide a short position, coinciding with a deeper correction for this coin.
❤️ Disclaimer : This analysis is purely based on my personal opinion and I only trade if the stated triggers are activated .

HBAR/USD – Critical $0.20 Support Retest: Breakdown or Rebound?Hedera’s native token HBAR is under renewed bearish pressure, trading near $0.2127, down ~2% in 24h and 5% on the week. The decline has brought the price back into the critical $0.21–$0.20 support zone, which traders often view as a key battleground.
Market cap dropped to $9.01B (–1.5% daily), while trading volume surged to $257.8M, highlighting intensified activity. Liquidations reached $137K, with long traders losing nearly 3x more than shorts — a sign of ongoing downside pressure.
Despite the bearish tilt, on-chain developments added bullish undertones: contract addresses linked to BlackRock, State Street, Aberdeen, and Libre were spotted on RWA_xyz, suggesting Hedera could become a major hub for tokenized real-world assets (RWAs).
Key Levels
• Resistance: $0.22, $0.24–$0.25, $0.28, $0.30
• Support: $0.21–$0.20, $0.19, $0.17
Technical View
• RSI: 40, bearish but rebounding from 34 → weakening selling pressure.
• MACD: still negative, but narrowing gap and fading red histogram → possible shift in momentum.
• Open Interest: flat at $365M, reflecting consolidation and trader caution.
Trading Scenarios
📈 Bullish case: Holding $0.21–$0.20 could trigger a rebound → first target $0.22, then $0.24–$0.25. A breakout opens the way to $0.28–$0.30.
📉 Bearish case: Failure to hold above $0.20 risks renewed downside → targets at $0.19 and $0.17.
Conclusion
HBAR sits at a make-or-break zone. The next sessions will determine whether $0.20 holds as a launchpad for recovery or gives way to deeper losses. Traders should closely watch volume dynamics and RSI momentum for confirmation.

HBAR 2-Month Golden Cross Nears Its End, Price Awaits DeclineHBAR’s price currently trades at $0.215 within a descending wedge pattern. It sits just above support at $0.213 while struggling to break $0.219 resistance. Although wedges often resolve positively, a decisive breakout remains distant, with the key barrier standing near $0.230.
Given current sentiment and technical indicators, HBAR is likely to stay range-bound below $0.230. Even if the price surpasses $0.219, broader resistance and limited momentum could keep the altcoin consolidated.
Should bearish signals strengthen, HBAR risks slipping through support at $0.205. Breaking this level would invalidate the bullish setup entirely, opening the path to $0.198. Such a move could reinforce investor caution and intensify short-term volatility for Hedera.

HBAR Long Spot Setup – Retesting Major SupportHBAR is pulling back into a key support zone between $0.19–$0.21, a historically significant area where buyers have previously stepped in with strength. With the broader market showing signs of stabilization, this zone may offer a solid opportunity for laddered spot accumulation.
Price action shows confluence with previous demand levels, and volume is beginning to stabilize, which could signal waning selling pressure. If this level holds, a bounce toward higher resistance zones becomes likely in the coming sessions or weeks.
🔁 Trade Setup:
• Entry Zone: $0.19–$0.21 (laddered entries)
• Target 1: $0.28–$0.31
• Target 2: $0.36–$0.40
• Stop Loss: Below $0.18

HBARUSDT – Support Retest Could Spark a BounceHBAR is currently retesting a key support zone between $0.22 and $0.23, an area that has acted as a strong demand level over the past few sessions. Despite some recent pullbacks, the broader structure remains bullish, and price action suggests buyers are still defending this zone.
A successful hold here could lead to a short-term rally, with targets aligned to previous resistance levels. Risk is clearly defined, offering an attractive risk-to-reward setup for spot traders.
🔹 Trade Setup:
• Entry Zone: $0.22 – $0.23 (Support zone)
• Take Profit Targets:
🥇 $0.28 – $0.31
🥈 $0.36 – $0.40
• Stop Loss: Daily candle close below $0.21

Is #HBAR About to Break Down Hard? Don’t Get Trapped by BearsYello Paradisers! Are you prepared for what might be the next major shakeout on #HBARUSDT? Let’s break down the current setup of #Hedera:
💎#HBAR has been moving within a descending channel since mid-July, consistently being rejected by the descending resistance trendline. Each bounce has been weaker than the last, and we're now approaching the lower edge of this structure with selling pressure intensifying.
💎As of now, HBAR is trading around $0.224, and the next few daily candles will be critical. If you're not managing your risk carefully here, the upcoming volatility could eat your capital alive. The 50 EMA is currently acting as a dynamic resistance, pushing the #HBARUSD lower each time it attempts a bounce. As long as the price remains below this level, the bearish pressure will likely continue.
💎A clean breakdown below the descending support of this channel would be a high-probability bearish confirmation. If we get a breakdown + retest rejection, #HBAR could accelerate toward the Moderate Support zone at $0.166. Then eventually, reach the Strong Demand Zone near $0.127, where we expect more serious buy interest to step in.
💎The bearish setup is invalidated on a confirmed breakout above the resistance zone at $0.255–$0.278. Only if price reclaims and holds above this range will we consider shifting back to a bullish bias. Until then, every bounce is likely to be sold into.
Trade smart, Paradisers. This setup will reward only the disciplined.
MyCryptoParadise
iFeel the success🌴

HBAR Market Report — Decision at the EdgeHBAR trades at $0.212, clinging to its demand shelf. The token has spent the week bleeding, yet still defends the 0.205–0.210 box. Above lies the critical supply wall at 0.245–0.250. Break it, and structural strength returns. Lose 0.205, and the market exposes liquidity voids at 0.195, then 0.175.
On the relative side, HBARBTC continues to underperform, signaling no rotation flow from majors — USD buyers alone must carry any rebound.
Orderflow reveals the pressure:
• Continuous CVD decline → sellers dictating tempo.
• Liquidity pools stack under 0.205 — a stop-hunt magnet.
• Volume spiked into 0.212 on the last drop, hinting real bids exist, but deltas remain red.
Derivatives paint a cautious picture:
Open interest is flat, shorts rest comfortably with neutral funding, and cumulative delta across major exchanges trends lower. The path of least resistance remains down — unless liquidity games flip the script.
What’s next?
The market has written its own trap. A sweep below 0.205 followed by swift reclaim of 0.207–0.210 could ignite bids toward 0.225 and 0.235, with 0.245 as stretch. Fail to reclaim, or see rejection at 0.220–0.225, and shorts regain control — first into 0.205, then the 0.195 liquidity shelf.
Scalp Playbook:
🟢 Long trigger: post-sweep reclaim 0.207–0.210 → 0.225/0.235.
🔴 Short trigger: rejection 0.220–0.225 → 0.205/0.195.
Bottom line:
HBAR is no longer drifting quietly — it stands at a decision point where the next 2–3 candles decide direction. Traders should expect volatility born not of trend, but of liquidity hunts. The trap will come first. The real move comes after.
⚔️ Candle Craft | Signal. Structure. Execution.

Market overview for HBARThe price has been in a complex correction for about 60 days . On the 4H timeframe, divergences are already visible on many oscillators, but the higher timeframe indicators are not yet signaling a possible reversal.
A close below the current fractal at 0.21 could bring the price to the 200-day moving average. For now, I’m watching the price action — the structure will only turn bullish after a breakout above 0.226 .

HBAR/USDT – 4H | SMC + Volume Profile ViewHBAR/USDT – 4H | SMC + Volume Profile View
Price ran a swing failure at the high → liquidity taken. From there, we got a displacement down that broke structure. That sets the bias bearish until proven otherwise.
Breaker + FVG overlap = current reaction zone. If it fails, continuation is likely.
Volume profile shows a virgin POC below → high-probability draw for price.
The weekly inverse level under price adds confluence with the FVG for possible bounce/retracement before continuation.
As long as price stays below the BOS level, I expect downside targets to get filled (POC, untested weekly zones).
📉 Bias: Bearish continuation.
📍 Invalidation: Reclaim BOS and hold above displaced structure → would flip bias neutral.

HBAR\USDT MARKUPHere Is my roadmap for HBAR/USDT.
I find marking up charts helps the brain to understand the language of the markets.
I hope this may aid in your next move?

Hedera (HBAR): Getting Ready For Big Bullish Setup | 50% MoveHedera is getting ready for a bullish breakout here, where we are just a few confirmations away from that 50% movement!
More in-depth info is in the video—enjoy!
Swallow Academy

HBARUSDT: Ready for the Next Bull Run to 0.27430!The HBARUSDT market is looking incredibly bullish! We've just seen a strong shift from a downtrend to an uptrend, creating a perfect opportunity to go long.
The price has broken through a key resistance level, then pulled back to retest it – a textbook breakout & retest setup. This highlights the strength of the bullish momentum.
Now, with the price rejecting that level and turning it into new support, this is a strong long signal with the next target in sight!
My target is 0.27430. Let’s get ready for the next move!

HBAR - Short-term DownsideHBAR looks to be setting up to make a C wave down to complete it's first impulse/corrective reaction. I'm cautious that we might see one last bullish surge before price breaks down.
Wave-Count Confidence: Weak
While you can take a bet on the downside, more looking for this to be a good setup in a golden long. if this plays out, the long to follow will be perfect.

HBAR | Technical Analysis & Market OutlookDescription:
Hedera Hashgraph (HBAR) is a decentralized public network designed for fast, secure, and scalable transactions. Unlike traditional blockchains, Hedera uses a hashgraph consensus mechanism, enabling low fees, high throughput, and strong enterprise adoption. HBAR powers the network’s services such as smart contracts, file storage, and tokenization.
This chart presents key technical levels, potential market structure, and momentum signals to help identify possible price reactions. The focus remains on risk management and disciplined trading strategies.
📌 Remember: Markets are volatile, and no outcome is guaranteed. Always manage risk and use proper position sizing.
Disclaimer:
This is not financial advice. This content is for educational and informational purposes only. Do your own research before making any investment decisions.
Hashtags & Keywords:
#HBAR #Hedera #Crypto #TechnicalAnalysis #Trading #Blockchain #Altcoins #PriceAction #CryptoTrading #ChartAnalysis

HBAR ANALYSIS📊 #HBAR Analysis
✅There is a formation of Falling Wedge Pattern on 4HR chart with a breakout and currently trading above its major support area🧐
Pattern signals potential bullish movement incoming in few days
👀Current Price: $0.2385
🚀 Target Price: $0.2780
⚡️What to do ?
👀Keep an eye on #HBAR price action and volume. We can trade according to the chart and make some profits⚡️⚡️
#HBAR #Cryptocurrency #TechnicalAnalysis #DYOR

New Bullish Wave Is About To Start 👉 A perfect bullish flag has formed on the chart with a clear ABCDE structure. Wave E completed at the 1.272 PRZ, and a new bullish wave is now about to begin Toward a 0.265$ And 0.323$

Can 2-Month High Inflows End HBAR Price’s Downtrend?
At the time of writing, Hedera is priced at $0.237, facing resistance at $0.241. The cryptocurrency has been weighed down by a two-month-old downtrend that began after it failed to break above $0.248 earlier this summer.
Given current market inflows and bullish technical indicators, HBAR is likely to bounce back from the $0.230 support. If successful, the price could retest $0.241 and possibly $0.248. Surpassing this level would officially end the ongoing downtrend.
However, if bearish sentiment intensifies, Hedera could lose its footing. A breakdown below $0.230 would expose the cryptocurrency to a fall toward $0.219. Such a move would invalidate the bullish outlook and risk extending the downtrend further.

Daily HBAR breakout in motion (trades active)I rarely trade crypto, but I do like this set up.
This aligns with the Weekly chart and the 4 hour chart.
1 day chart confluences:
- trading above Daily EMA
- low resistance liquidity trend line break
- retesting trendline
4 hour chart confluences:
- trading above 200EMA
- trendline break
- retesting EMA
1 Week chart confluences:
-two weeks ago we tapped into the bullish gap and created a doji candle
-following candle inverted the bearish candle from 3 weeks ago creating a "inverted fair value gap".
If this week we close bullish and create what I called a true 3 bar fair value gap then this thing is gone to go test the local highs from the trend line liquidity and maybe even run to test the all time highs.
FOMC is Wednesday. If crypto continues bullish and gets out of this sideways bullshit then this idea will work.
If crypto pulls back and Bitcoin decides to grab buyers back at 105k, then this idea is toast.
I really want to start a nice long position on CRYPTOCAP:BTC around 105k
It sucks because now that smart money is more in control of Bitcoin, it makes trading crypto this year totally different than the previous years in my opinion. Kind of a good thing in my opinion.
Anyways I have no stop loss in place for FOMC but I have a soft stop in mind where if we have a big daily death candle that displaces down and closes bearish then I'll just bail and go look for new long positions on different assets later.
I am hesitant on all crypto right now since we have been trading sideways. But it's sideways in a bullish manner. So I'm trying this out since this chart makes the most sense to me out of the 15 crypto coins that I follow.

HBAR/USDT Options📍 Setup Framework
🔺 Short Play (Sweep Higher → Go Lower):
Liquidity Target for Sweep: 0.237–0.238 (equal highs).
Entry Zone: Inside red FVG (inv D / inv @).
Stop: Above 0.2385 (last external high).
Targets:
TP1 → 0.231 (inv W FVG).
TP2 → 0.227–0.229 (deeper discount array).
🔻 Long Play (Go Lower → Sweep to Go Higher):
Liquidity Target for Sweep: Lows around 0.231 / 0.229.
Entry Zone: Inside green FVG after liquidity grab.
Stop: Below 0.227 (last protected low).
Targets:
TP1 → 0.236 (return to premium).
TP2 → 0.238 (liquidity above highs / bearish FVG).
🚩 Invalidation
Bearish play invalid → close >0.2385 with displacement.
Bullish play invalid → close <0.227 cleanly.

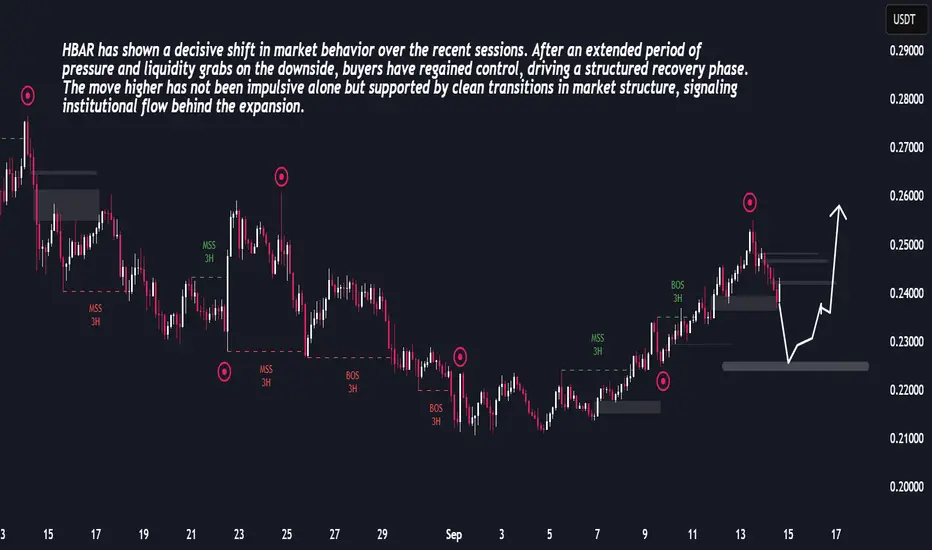
HBAR Market Report: Structural Recovery in ProgressHBAR Market Report
HBAR has recently completed a clear cycle of distribution, decline, and recovery. After experiencing extended downside pressure in late August, the market shifted into accumulation, showing liquidity sweeps and structural shifts that hinted at buyer activity.
As momentum built, HBAR transitioned into expansion, confirming strength with higher highs and consistent breaks in structure. The rally into mid-September reflects healthy order flow, with corrections acting as controlled pauses rather than signals of weakness.
The latest pullback indicates a short-term re-balancing phase. Price action suggests liquidity is being collected, preparing the market for another impulsive leg higher. This rhythm of decline, absorption, and expansion continues to align with a constructive medium-term outlook.
HBARUSDT → Correction before the rally...After strong growth from the 0.14 zone, BINANCE:HBARUSDT HBAR updated its maximum to 0.30 and entered a correction phase, testing the intermediate and strong support level of 0.2300. A false breakdown has formed, and price consolidation above the key zone could trigger another rally.
HBAR currently has two key levels: 0.243 and 0.2337. The bulls are trying to keep the correction at the upper support level. However, there is a huge pool of liquidity hidden behind 0.2337, which could be tested (before growth resumes) if 0.243 fails to hold the price.
Locally, the coin is breaking the structure of the downward correction (consolidation in a bull market) and is trying to consolidate above support (in the zone of interest). The end of the current correction phase may lead to a resumption of distribution.
Support levels: 0.2432, 0.2337
Resistance levels: 0.2547, 0.26, 0.2763
The formation of a bullish structure relative to 0.2432 will confirm the presence of an interested, large buyer. This could trigger strong growth. Otherwise, I will wait for a retest of 0.2337, from where I will look for an opportunity to open long positions with the aim of medium-term growth.
Best regards, R. Linda!
