HDFC Bank | Short-Term Trade SetupHDFC Bank – Short-Term Technical View
On the 1-hour timeframe, HDFC Bank is showing a positive EMA crossover, indicating improving short-term momentum. The crossover has formed near the ₹922 level, which is a crucial price zone.
This level gains further importance as the price is trading above bot
HDFC Bank Limited Sponsored ADR
No trades
Key facts today
Next report date
—
Report period
—
EPS estimate
—
Revenue estimate
—
1.67 USD
8.37 B USD
56.14 B USD
5.12 B
About HDFC Bank Limited
Sector
Industry
CEO
Kapila Deshapriya
Website
Headquarters
Mumbai
Founded
1994
IPO date
Jul 23, 2001
Identifiers
3
ISIN US40415F1012
HDFC Bank Ltd. engages in the provision of banking and financial services including commercial banking and treasury operations. It operates through the following segments: Treasury, Retail Banking, Wholesale Banking, and Other Banking Business. The Treasury segment is involved in net interest earnings from the investment portfolio, money market borrowing, and lending, gains, or losses on investment operations and on account of trading in foreign exchange and derivative contracts. The Retail Banking segment focuses on serving retail customers through the branch network and other channels. The Wholesale Banking segment provides loans, non-fund facilities, and transaction services to large corporates, emerging corporates, public sector units, government bodies, financial institutions, and medium scale enterprises. The Other Banking Business segment includes income from parabanking activities such as credit cards, debit cards, third party product distribution, primary dealership business, and the associated costs. The company was founded by Aditya Tapishwar Puri in August 1994 and is headquartered in Mumbai, India.
Related stocks

HDFC Bank Short Trade Setup📊 Price Action & Trend Analysis
Analyzing market trends using price action, key support/resistance levels, and candlestick patterns to identify high-probability trade setups.
Always follow the trend and manage risk wisely!
Price Action Analysis Interprets Market Movements Using Patterns And Trend

HDFC Bank – Inverse Head & Shoulder (Preemptive Setup)🏦 HDFC Bank – Inverse Head & Shoulder (Preemptive Setup)
HDFC Bank has been extremely low on momentum and stuck in a sideways zone for many weeks.
While Bank Nifty continues to hit new highs, HDFC Bank hasn’t participated — but the structure is now hinting at a potential inverse head & shoulder b

Hdfc bank analysis for intraday today 30-12-2025HDFC Bank Quick Summary
Upper Trigger: 992.20
Lower Trigger: 991.20
Above 992.20: sustain + volume = upside
Below 991.20: sustain + volume = downside
Fast reject: fake move

HDFC BANK | The breakout we all had been waiting for...NSE:HDFCBANK
Risky SL: 1670 levels
Relatively safer SL: 1600 levels
Target: atleast 2000 levels
Note: More risk means more profit but at the same time means more loss if price action hits SL!

HDFC BANKHDFC Bank Ltd., incorporated in the year 1994, is a banking company (having a market cap of Rs 15,41,439.88 Crore).
HDFC Bank Ltd. key Products/Revenue Segments include Interest & Discount on Advances & Bills, Income From Investment, Interest and Interest On Balances with RBI and Other Inter-Bank Fu

HDFC BANK LTD S/Rsanthosh
Support and Resistance Levels:
Support Levels: These are price points (green line/shade) where a downward trend may be halted due to a concentration of buying interest. Imagine them as a safety net where buyers step in, preventing further decline.
Resistance Levels: Conversely, resistance l

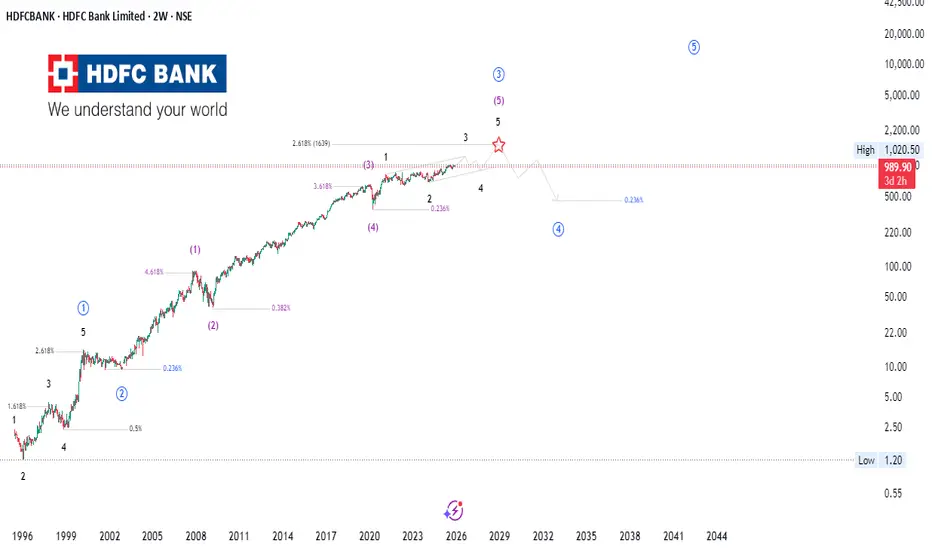
HDFC Bank | Wave-5 Exhaustion or Structural Re-Accumulation?This multi-decade chart of HDFC Bank reflects a compelling confluence of Elliott Wave Theory, Smart Money Concepts (SMC), Price Action, and Fibonacci symmetry —all signaling a maturing macro structure as the market approaches a probable Wave-5 terminal zone.
📈 Institutional Market Structure Out
HDFC Bank: Key Upside Levels Achieved, Now Reacting at a Strong HDFC Bank has completed its major upside move and is now reacting sharply near the ₹1020 resistance zone, a level that has previously acted as a strong supply point.
Price action shows momentum fatigue at this zone, and the recent ₹91 lakh RBI penalty has added additional pressure on sentiment.
The

HDFC Bank Approaching a Major Monthly BreakoutHDFC Bank is testing a long-term resistance zone on the monthly chart, around 1000–1030. This level has rejected the price multiple times in the past, so a clean breakout on the monthly candle carries weight.
The chart shows a rising trendline from 2020 acting as support, and price is currently squ

See all ideas
Summarizing what the indicators are suggesting.
Neutral
SellBuy
Strong sellStrong buy
Strong sellSellNeutralBuyStrong buy
Neutral
SellBuy
Strong sellStrong buy
Strong sellSellNeutralBuyStrong buy
Neutral
SellBuy
Strong sellStrong buy
Strong sellSellNeutralBuyStrong buy
An aggregate view of professional's ratings.
Neutral
SellBuy
Strong sellStrong buy
Strong sellSellNeutralBuyStrong buy
Neutral
SellBuy
Strong sellStrong buy
Strong sellSellNeutralBuyStrong buy
Neutral
SellBuy
Strong sellStrong buy
Strong sellSellNeutralBuyStrong buy
Displays a symbol's price movements over previous years to identify recurring trends.
H
772HEGIC32
HDFC ERGO General Insurance Company Limited 7.72% 19-SEP-2032Yield to maturity
—
Maturity date
Sep 19, 2032
See all HDB bonds