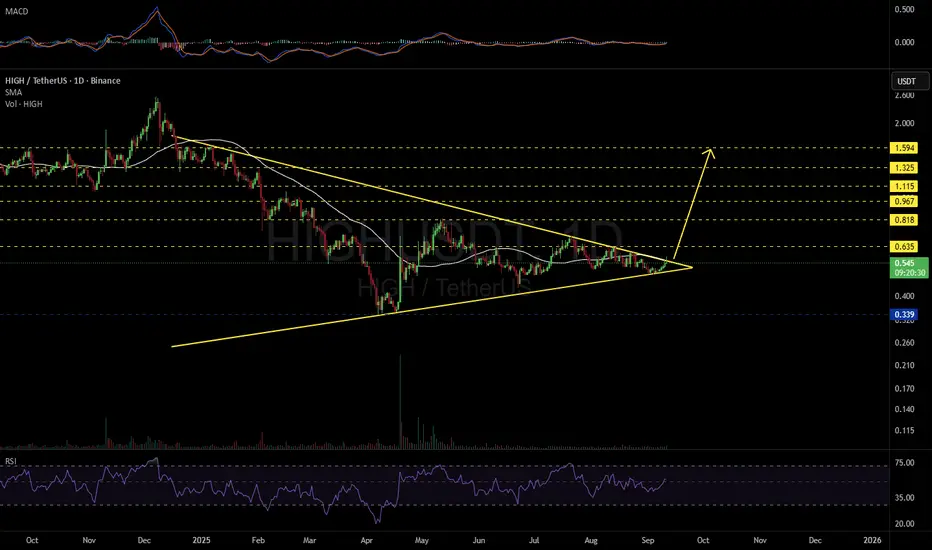
HIGHUSDT 1DKeep an eye on the #HIGH daily chart. It is on the verge of breaking out above the symmetrical triangle resistance and the daily SMA50. If that happens, the potential targets are:
🎯 $0.635
🎯 $0.818
🎯 $0.967
🎯 $1.115
🎯 $1.325
🎯 $1.594
⚠️ Always remember to use a tight stop-loss and follow proper ri
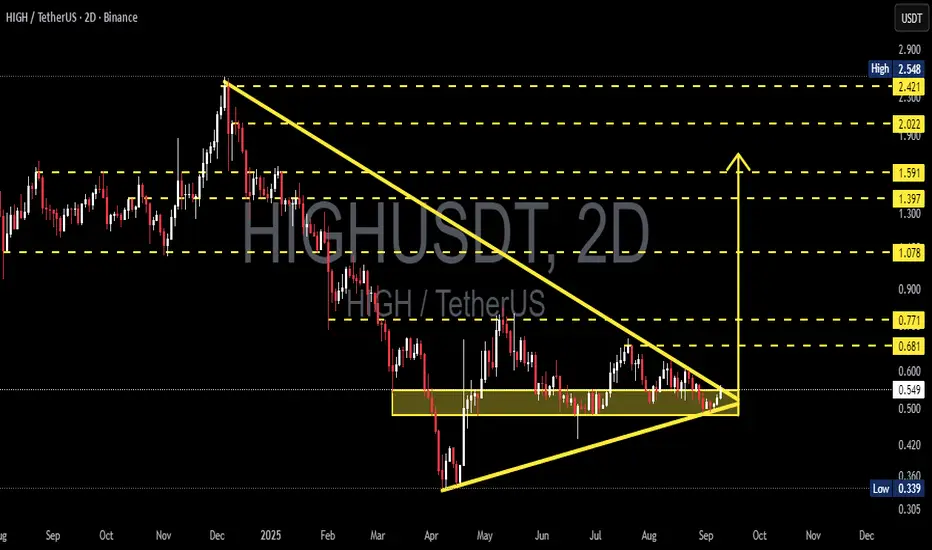
HIGHUSDT — Symmetrical Triangle A Major Breakout Is Approaching?The pair HIGH/USDT is currently at a critical stage after experiencing a prolonged downtrend earlier this year. On the chart, we can clearly see the formation of a Symmetrical Triangle, marked by a descending resistance line from the $2.5 peak and a rising support line that has been holding since Ap
Solid bull momentumrecent test on daily supply line , and if this can consolidate nicely, it may present buy opportunity.

HIGHUSDT Analysis D1HIGHUSDT Already Broken Descending Broadening and started Recovery in D1 Chart
Continuity of momentum can see 80-120% Bullish Rally in Short-term .


HIGHUSDT | +1800% Daily Volume Spike – Major Move Loading?Today, HIGHUSDT is one of the most explosive coins on the market, with an insane 1800% volume spike—this kind of surge never goes unnoticed. When a coin pulls this much liquidity in a single day, it's a clear sign that a major move is coming, and smart traders start watching it like a hawk.
🔍 What
A candle above the channel is neededHigh is about to break the channel, which was stuck in for about 4 and half months. If it closes the candle above the channel, we may see more pump toward ~$0.74, ~$1.05, ~$1.57 in a 5-wave move. But due to the bearish RSI divergence, it may continue to fluctuate downward in the channel and test the

HIGHUSDT is making HH and HL As per DOw analysis HIGH usdt is in bullish phase and can increase in future
TP: :0.9

LongDue to the deep correction and the collision with the downtrend lines, I expect an upward movement. Please trade spot because this altcoin has a lot of volatility.

HIGHUSDT 1DHIGH ~ 1D Analysis
#HIGH This coin is still in the channel decreases, waiting for this resistant line successfully penetrated. Maybe with a minimum target of 10%+.

See all ideas
Summarizing what the indicators are suggesting.
Oscillators
Neutral
SellBuy
Strong sellStrong buy
Strong sellSellNeutralBuyStrong buy
Oscillators
Neutral
SellBuy
Strong sellStrong buy
Strong sellSellNeutralBuyStrong buy
Summary
Neutral
SellBuy
Strong sellStrong buy
Strong sellSellNeutralBuyStrong buy
Summary
Neutral
SellBuy
Strong sellStrong buy
Strong sellSellNeutralBuyStrong buy
Summary
Neutral
SellBuy
Strong sellStrong buy
Strong sellSellNeutralBuyStrong buy
Moving Averages
Neutral
SellBuy
Strong sellStrong buy
Strong sellSellNeutralBuyStrong buy
Moving Averages
Neutral
SellBuy
Strong sellStrong buy
Strong sellSellNeutralBuyStrong buy
Displays a symbol's price movements over previous years to identify recurring trends.