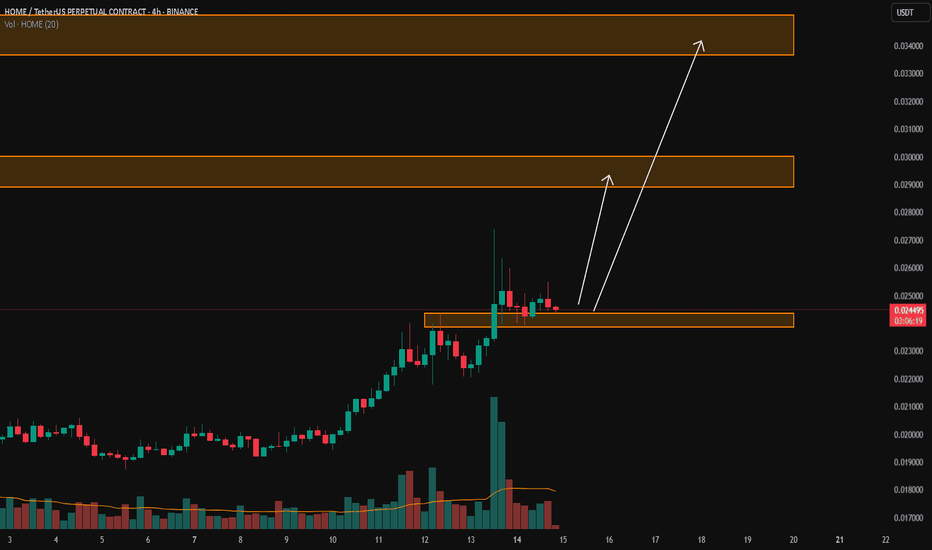
HOMEUSDT Forming Bullish WaveHOMEUSDT is currently displaying a bullish wave pattern, signaling strong momentum and potential for an extended upward move. The wave structure indicates that the market is progressing through impulsive and corrective phases, with the next leg likely to push prices significantly higher. With volume
HOMEUSDT UPDATE#HOME
UPDATE
HOME Technical Setup
Pattern : Bullish Support Bounce
Current Price: $0.03928
Target Price: $0.056
Target % Gain: 45.82%
Technical Analysis: HOME has bounced strongly from the key demand zone on the 1D chart, confirming support with a bullish candle. Breakout momentum suggests conti
HOMEUSDT Forming Bullish BreakoutHOMEUSDT is currently presenting a bullish breakout pattern that has started to attract the attention of traders and investors. With strong technical signals aligning, the pair has broken above key resistance levels, signaling that market sentiment is shifting in favor of the bulls. Breakout structu
HOME Bearish DivergenceBINANCE:HOMEUSDT
Trade Setup:
Target 1: 0.03657(0.786 Fibonnaci Golden Zone).
Target 2: 0.03257 (0.618 Fibonnaci Golden Zone).
Target 3: 0.02957 (0.5 Fibonnaci Golden Zone).
Target 4: 0.01784 (0 Fibonnaci).
DCA : 0.04489 (1.135 Fibonacci)
Stop Loss: 0.04815 (1.272 Fibonacci).
RSI Analysis: The
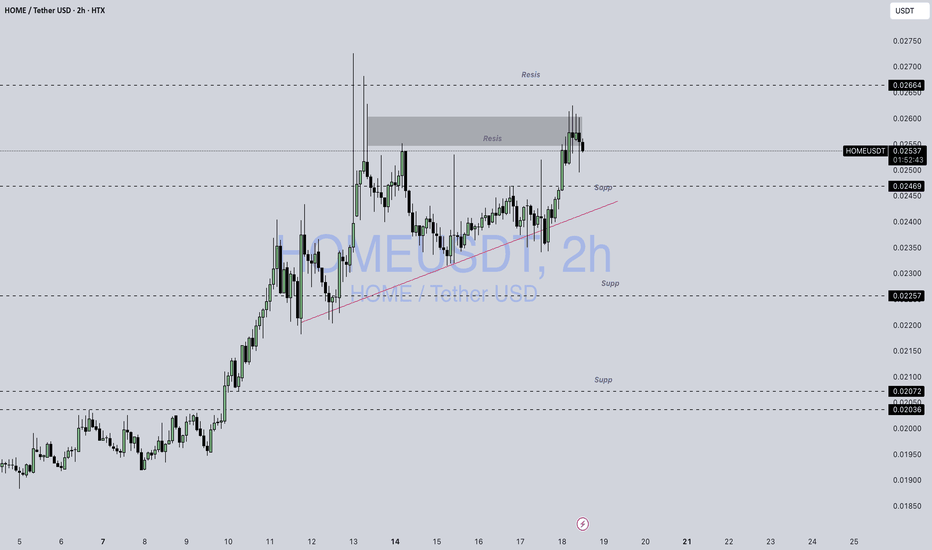
Home / UsdtHTX:HOMEUSDT
### 🧠 **Technical Breakdown of HOME/USDT (2h chart)**
#### 🔲 **Supply Zone (Resistance)**
* **Price Range:** 0.02550 – 0.02633
* This gray zone has previously caused multiple rejections.
* Several upper wicks indicate sellers are active here, absorbing buying pressure.
#### 📍 **Cu
HOME/USDTKey Level Zone: 0.023850 - 0.024350
LMT v2.0 detected.
The setup looks promising—price previously trended upward with rising volume and momentum, then retested this zone cleanly. This presents an excellent reward-to-risk opportunity if momentum continues to align.
Introducing LMT (Levels & Momentu
HOME | Two Possible PathsThe HOME 4-hour chart shows price consolidating near the 0.01974 support level with two distinct scenarios emerging:
Bullish Path (Green Arrow):
Price breaks above resistance zones around 0.02200-0.02800
Target: 0.03632 resistance level
Supported by recent bounce from support
Bearish Path (Red
See all ideas
Summarizing what the indicators are suggesting.
Oscillators
Neutral
SellBuy
Strong sellStrong buy
Strong sellSellNeutralBuyStrong buy
Oscillators
Neutral
SellBuy
Strong sellStrong buy
Strong sellSellNeutralBuyStrong buy
Summary
Neutral
SellBuy
Strong sellStrong buy
Strong sellSellNeutralBuyStrong buy
Summary
Neutral
SellBuy
Strong sellStrong buy
Strong sellSellNeutralBuyStrong buy
Summary
Neutral
SellBuy
Strong sellStrong buy
Strong sellSellNeutralBuyStrong buy
Moving Averages
Neutral
SellBuy
Strong sellStrong buy
Strong sellSellNeutralBuyStrong buy
Moving Averages
Neutral
SellBuy
Strong sellStrong buy
Strong sellSellNeutralBuyStrong buy


