HOT/USDT — Testing Demand Zone: Major Accumulation or Breakdown?📊 Overview
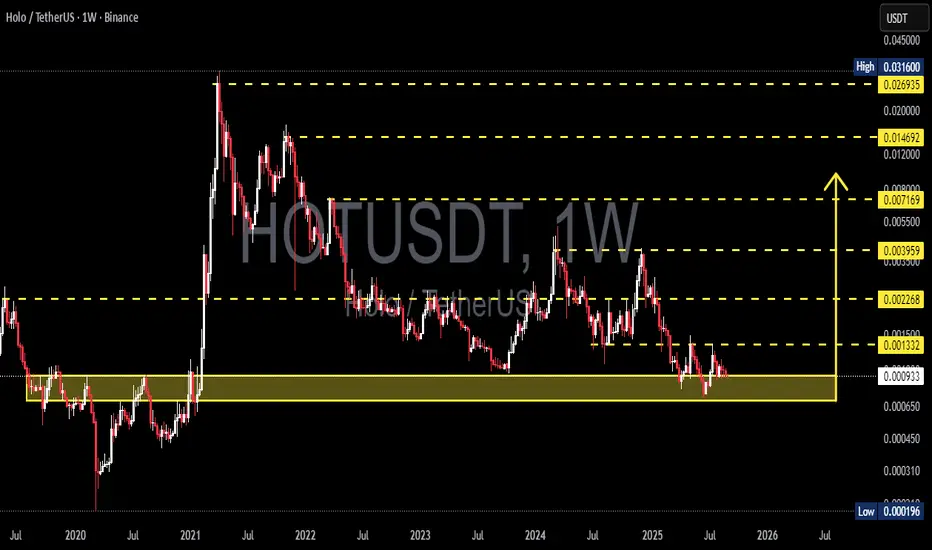
HOT (Holochain) is now trading at a multi-year demand zone that has been significant since 2019–2020. This zone is critical because:
1. It served as the launchpad for the massive 2021 rally.
2. It has been retested multiple times during extreme market downturns.
3. Price has returne
#HOT/USDT#HOT
The price is moving within an ascending channel on the 1-hour frame, adhering well to it, and is poised to break it strongly upwards and retest it.
We have support from the lower boundary of the ascending channel, at 0.00975.
We have a downtrend on the RSI indicator that is about to break an

#HOT/USDT#HOT
The price is moving within a descending channel on the 1-hour frame, adhering well to it, and is heading for a strong breakout and retest.
We are experiencing a rebound from the lower boundary of the descending channel. This support is at 000873.
We are experiencing a downtrend on the RSI ind

HOT/USDT Breakout Confirmation or Bull Trap? Critical Retest!🧠 In-Depth Technical Breakdown (Daily Timeframe):
HOT/USDT (Holo vs Tether) is currently at a crucial inflection point, following a confirmed breakout from a long-standing downtrend. The price is now retesting a major demand zone, and how it reacts here will determine its next big move.
Let’s dive

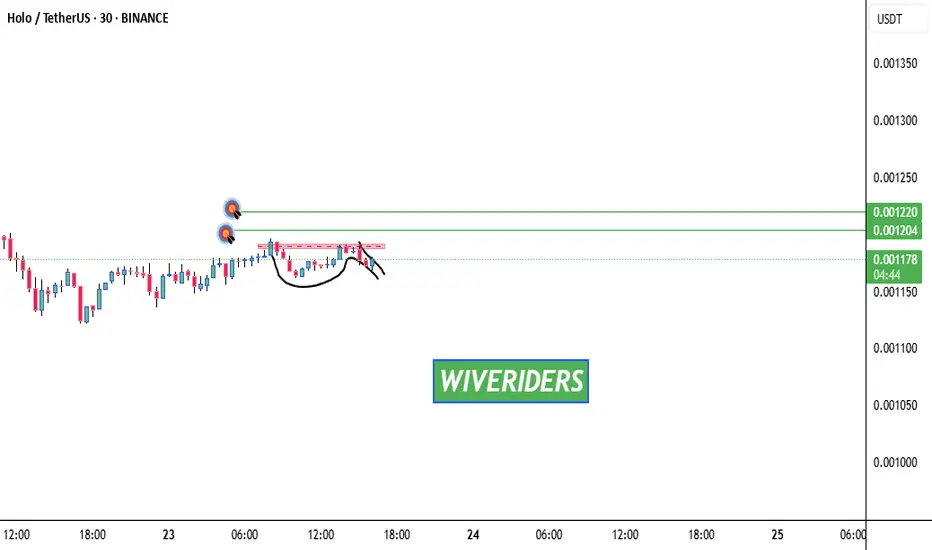
Cup & Handle Formation 🚨 XETR:HOT Testing Red Resistance – Cup & Handle Formation 📈
XETR:HOT is currently testing the red resistance zone and has formed a bullish Cup & Handle pattern on the chart — a classic continuation setup.
If breakout is confirmed, potential upside:
✅ First Target: Green line level
✅ Second T
#HOT/USDT#HOT
The price is moving within a descending channel on the 1-hour frame, adhering well to it, and is heading for a strong breakout and retest.
We are seeing a bounce from the lower boundary of the descending channel, which is support at 0.000840.
We have a downtrend on the RSI indicator that is a

#HOT/USDT#HOT
The price is moving within a descending channel on the 1-hour frame and is expected to break and continue upward.
We have a trend to stabilize above the 100 moving average once again.
We have a downtrend on the RSI indicator that supports the upward move with a breakout.
We have a support a

HOTUSDT 1W AnalysisHOT ~ 1W Analysis
#HOT Buy gradually from here if you still have confidence in this coin with a short term target of at least 20%+ from this support block.

#HOT/USDT#HOT
The price is moving within a descending channel on the 1-hour frame, adhering well to it, and is heading for a strong breakout and retest.
We are seeing a bounce from the lower boundary of the descending channel, which is support at 0.001240.
We have a downtrend on the RSI indicator that is a

#HOT/USDT#HOT
The price is moving within a descending channel on the 1-hour frame, adhering well to it, and is on its way to breaking it strongly upwards and retesting it.
We are seeing a bounce from the lower boundary of the descending channel, this support at 0.01018.
We have a downtrend on the RSI indic

See all ideas
Summarizing what the indicators are suggesting.
Oscillators
Neutral
SellBuy
Strong sellStrong buy
Strong sellSellNeutralBuyStrong buy
Oscillators
Neutral
SellBuy
Strong sellStrong buy
Strong sellSellNeutralBuyStrong buy
Summary
Neutral
SellBuy
Strong sellStrong buy
Strong sellSellNeutralBuyStrong buy
Summary
Neutral
SellBuy
Strong sellStrong buy
Strong sellSellNeutralBuyStrong buy
Summary
Neutral
SellBuy
Strong sellStrong buy
Strong sellSellNeutralBuyStrong buy
Moving Averages
Neutral
SellBuy
Strong sellStrong buy
Strong sellSellNeutralBuyStrong buy
Moving Averages
Neutral
SellBuy
Strong sellStrong buy
Strong sellSellNeutralBuyStrong buy
Displays a symbol's price movements over previous years to identify recurring trends.
Curated watchlists where HOTUSDT.P is featured.

ETH-based crypto: Find your utility
38 No. of Symbols
See all sparks