H/USDTKey Level Zone: 0.06200 - 0.06500
LMT v2.0 detected.
The setup looks promising—price previously trended upward with rising volume and momentum, then retested this zone cleanly. This presents an excellent reward-to-risk opportunity if momentum continues to align.
Introducing LMT (Levels & Momentum Trading)
- Over the past 3 years, I’ve refined my approach to focus more sharply on the single most important element in any trade: the KEY LEVEL.
- While HMT (High Momentum Trading) served me well—combining trend, momentum, volume, and structure across multiple timeframes—I realized that consistently identifying and respecting these critical price zones is what truly separates good trades from great ones.
- That insight led to the evolution of HMT into LMT – Levels & Momentum Trading.
Why the Change? (From HMT to LMT)
Switching from High Momentum Trading (HMT) to Levels & Momentum Trading (LMT) improves precision, risk control, and confidence by:
- Clearer Entries & Stops: Defined key levels make it easier to plan entries, stop-losses, and position sizing—no more guesswork.
- Better Signal Quality: Momentum is now always checked against a support or resistance zone—if it aligns, it's a stronger setup.
- Improved Reward-to-Risk: All trades are anchored to key levels, making it easier to calculate and manage risk effectively.
- Stronger Confidence: With clear invalidation points beyond key levels, it's easier to trust the plan and stay disciplined—even in tough markets.
Whenever I share a signal, it’s because:
- A high‐probability key level has been identified on a higher timeframe.
- Lower‐timeframe momentum, market structure and volume suggest continuation or reversal is imminent.
- The reward‐to‐risk (based on that key level) meets my criteria for a disciplined entry.
***Please note that conducting a comprehensive analysis on a single timeframe chart can be quite challenging and sometimes confusing. I appreciate your understanding of the effort involved.
Important Note: The Role of Key Levels
- Holding a key level zone: If price respects the key level zone, momentum often carries the trend in the expected direction. That’s when we look to enter, with stop-loss placed just beyond the zone with some buffer.
- Breaking a key level zone: A definitive break signals a potential stop‐out for trend traders. For reversal traders, it’s a cue to consider switching direction—price often retests broken zones as new support or resistance.
My Trading Rules (Unchanged)
Risk Management
- Maximum risk per trade: 2.5%
- Leverage: 5x
Exit Strategy / Profit Taking
- Sell at least 70% on the 3rd wave up (LTF Wave 5).
- Typically sell 50% during a high‐volume spike.
- Move stop‐loss to breakeven once the trade achieves a 1.5:1 R:R.
- Exit at breakeven if momentum fades or divergence appears.
The market is highly dynamic and constantly changing. LMT signals and target profit (TP) levels are based on the current price and movement, but market conditions can shift instantly, so it is crucial to remain adaptable and follow the market's movement.
If you find this signal/analysis meaningful, kindly like and share it.
Thank you for your support~
Sharing this with love!
From HMT to LMT: A Brief Version History
HM Signal :
Date: 17/08/2023
- Early concept identifying high momentum pullbacks within strong uptrends
- Triggered after a prior wave up with rising volume and momentum
- Focused on healthy retracements into support for optimal reward-to-risk setups
HMT v1.0:
Date: 18/10/2024
- Initial release of the High Momentum Trading framework
- Combined multi-timeframe trend, volume, and momentum analysis.
- Focused on identifying strong trending moves high momentum
HMT v2.0:
Date: 17/12/2024
- Major update to the Momentum indicator
- Reduced false signals from inaccurate momentum detection
- New screener with improved accuracy and fewer signals
HMT v3.0:
Date: 23/12/2024
- Added liquidity factor to enhance trend continuation
- Improved potential for momentum-based plays
- Increased winning probability by reducing entries during peaks
HMT v3.1:
Date: 31/12/2024
- Enhanced entry confirmation for improved reward-to-risk ratios
HMT v4.0:
Date: 05/01/2025
- Incorporated buying and selling pressure in lower timeframes to enhance the probability of trending moves while optimizing entry timing and scaling
HMT v4.1:
Date: 06/01/2025
- Enhanced take-profit (TP) target by incorporating market structure analysis
HMT v5 :
Date: 23/01/2025
- Refined wave analysis for trending conditions
- Incorporated lower timeframe (LTF) momentum to strengthen trend reliability
- Re-aligned and re-balanced entry conditions for improved accuracy
HMT v6 :
Date : 15/02/2025
- Integrated strong accumulation activity into in-depth wave analysis
HMT v7 :
Date : 20/03/2025
- Refined wave analysis along with accumulation and market sentiment
HMT v8 :
Date : 16/04/2025
- Fully restructured strategy logic
HMT v8.1 :
Date : 18/04/2025
- Refined Take Profit (TP) logic to be more conservative for improved win consistency
LMT v1.0 :
Date : 06/06/2025
- Rebranded to emphasize key levels + momentum as the core framework
LMT v2.0
Date: 11/06/2025
- Fully restructured lower timeframe (LTF) momentum logic
HUSDT.3S trade ideas

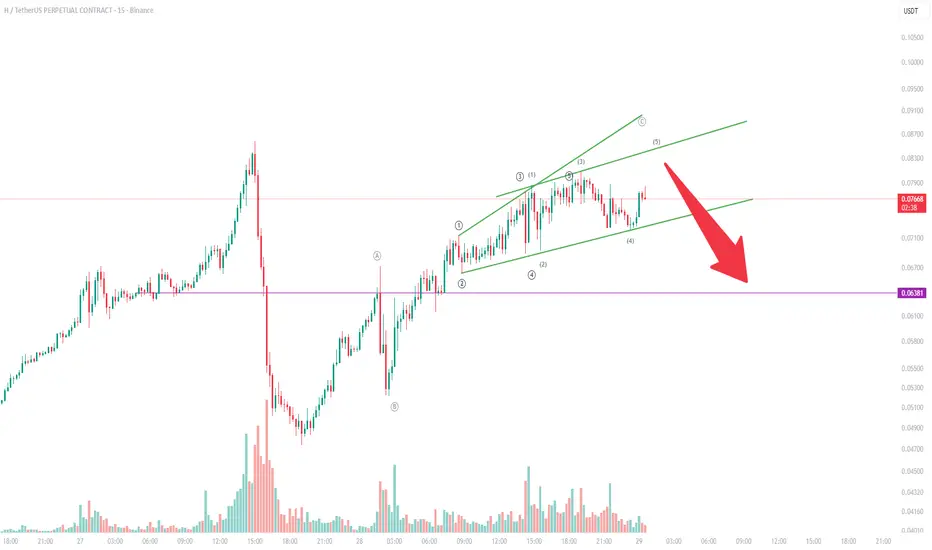
Key Diagonal Scenarios and Short OpportunitiesHUSDT (HUSDT.P) is currently presenting a complex Elliott Wave structure, where two possible diagonal counts are visible. Traders need to pay close attention to both scenarios, as they can define very different short-term strategies and risk-reward setups.
📈 Scenario One: Completed Diagonal and Potential Correction
The first diagonal count appears to be completed. If this scenario plays out, the market could enter a corrective phase, pulling back toward the 0.06380 support area 🔻. This zone marks a significant technical level where previous consolidation took place and could serve as a natural retracement target.
For active traders, this suggests that a downside move is possible, especially if bearish confirmation appears on lower time frames. The correction would provide a tactical short opportunity with a clear target zone.
⚡ Scenario Two: Extended Diagonal Toward 0.086
The second possible wave count points to an extended diagonal that could push the price higher, potentially reaching the 0.086 resistance area. This projection reflects the possibility of additional bullish momentum before the market completes its diagonal structure.
In this case, traders should not rush into premature short positions. Instead, patience is required to allow the price to fully extend before signs of exhaustion appear.
💡 Short Setup Zone
Given both scenarios, the 0.077 – 0.086 range looks like a favorable area to consider short positions 📉. This zone combines structural resistance with the upper boundary of the diagonal pattern, making it a technically strong supply area.
Once price enters this range, traders should closely monitor candlestick signals such as bearish engulfing patterns or rejection wicks. These confirmations can serve as effective triggers for shorts.
✅ Risk Management and Strategy
Short positions should be considered only with clear confirmation.
Stops should be placed above 0.086 in case the market extends further.
Initial targets can be set near 0.06380, aligning with the first scenario’s correction level.
This approach balances both possibilities: capturing profits from a potential pullback while protecting against extended upside.
$HUSDT Breakout Loading.BYBIT:HUSDT is showing strong bullish momentum.
A breakout above the $0.08850 resistance could push the price toward $0.31131, marking a potential 249% surge.
DYOR, NFA


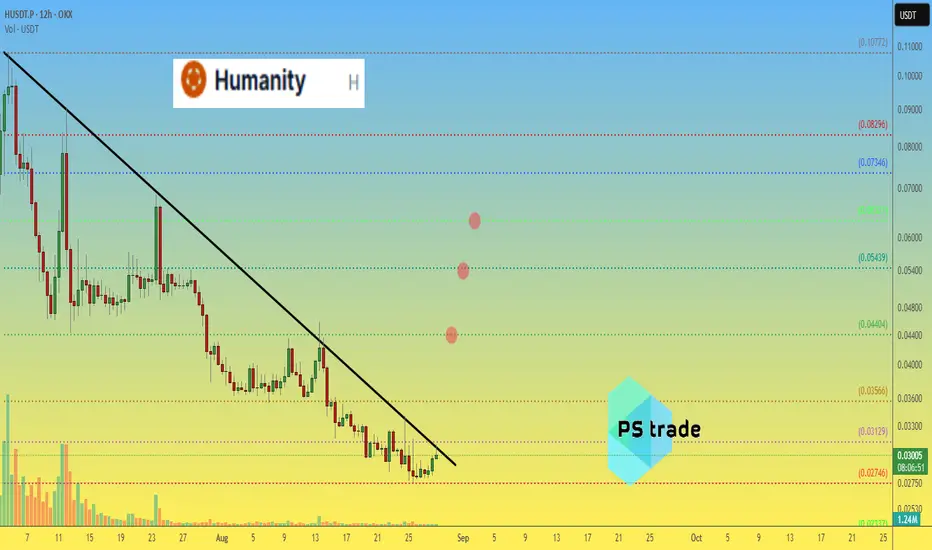
Humanity H price analysis🔥 Have you also noticed the recent "market magic"?
Random coins with ZERO news suddenly 🚀 pumping x2–x3 in just a day!
Here’s the pattern we’ve spotted 👇
▪️ Market Cap: $20–50M
▪️ Base Trading Volume: $2–5M
▪️ And then — a green rocket without any fundamentals 💥
🤔 Could #H be the next one to pump?
Or maybe it’s time for another “chosen one”?
💬 Drop your guesses in the comments — let’s analyze them together!
🧠 DYOR | This is not financial advice, just thinking out loud.
______________
◆ Follow us ❤️ for daily crypto insights & updates!
🚀 Don’t miss out on important market mov
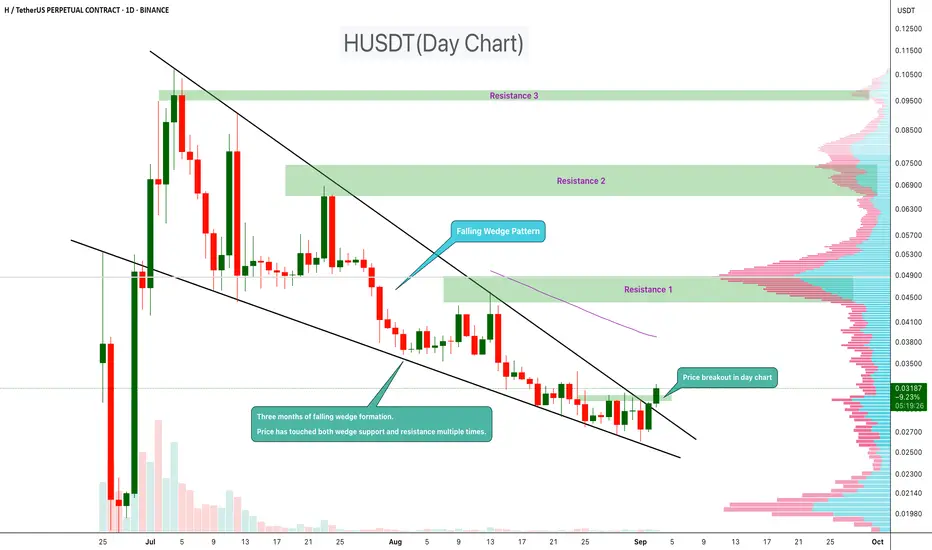
HUSDT Reversal Signal – Wedge Pattern BreaksHUSDT has been forming a falling wedge pattern over the past three months. During this period, the price has tested both the wedge support and resistance multiple times, confirming the structure.
Now, a breakout has appeared on the daily chart, suggesting that bullish momentum may be building. Falling wedges are typically seen as reversal patterns, often leading to upside continuation once the breakout is confirmed.
Resistance 1:$0.045
Resistance 2:$0.066
Resistance 2:$0.095
cheers
Hexa
HUSDT Analysis (4H)This coin, after completing a bullish wave in the form of a WXY, has entered a corrective phase from the point where we placed the red arrow on the chart.
This phase appears to be a Diametric, and we are currently in wave F of this Diametric.
It is expected that wave G will soon be completed, pushing the price toward the green lines, which mark our entry zone for a buy/long position.
In the green zone, we are looking for a buy/long position. If you are considering a sell/short position, the red-marked box is suggested.
Targets are marked on the chart.
A daily candle close below the invalidation level will invalidate this analysis.
For risk management, please don't forget stop loss and capital management
When we reach the first target, save some profit and then change the stop to entry
Comment if you have any questions
Thank You

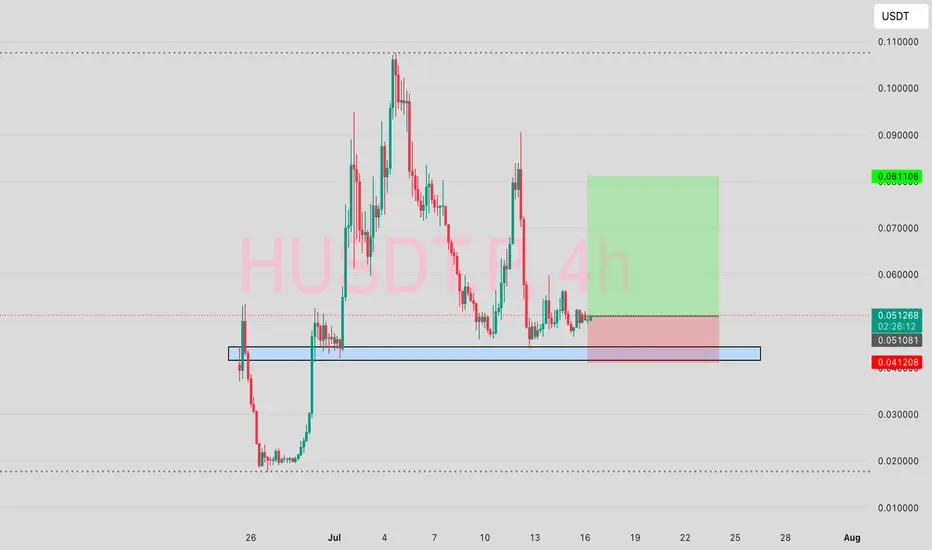
H/USDT H/USDT recently experienced a powerful +400% rally within a week, showcasing strong bullish momentum. After sweeping liquidity below0.047 the previous Support, price has now retraced and is stabilizing just below the key liquidity zone. This area is showing signs of forming a new base support, indicating a potential accumulation phase.
This current zone offers an excellent opportunity for DCA entries, with clear upside potential. As long as price holds this base structure

$HUSDTMy risk trade today is on BYBIT:HUSDT.P .
I trust the move to go as planned based on existing chart patterns but the percentage of risk is as high as 19.33%. The reason is not far-fetched, It's simply a new listing.
If you choose to ride this with me, apply caution ⚠️
#NFA #DYOR
Is a time for HUSDT? 0.15 USD target? The Humanity/USDT token is currently in a clear correction phase following a sharp upward move that peaked around 0.12 USD. The current price (~0.0568 USDT) is trading near the long-term MA60 line, indicating a possible accumulation zone that could serve as a base for the next upward move. Momentum indicators are deeply oversold, and volatility is decreasing, which supports the potential for a rebound. If the price breaks out of the current range and surpasses resistance levels around 0.072 and 0.11 USD, the target of 0.15 USD becomes realistic. However, a strong increase in volume and sustained support above the current range will be crucial for this scenario to play out.
Potential TP: 0.15 USD

H | Pushing for New HighsHumanity Protocol demonstrates exceptional bullish momentum. The bullish trajectory suggests this AI-related token could benefit from renewed sector interest.
Key Technical Signals:
Price trading well above the ascending trendline, indicating sustained bullish momentum
Clean breakout above horizontal resistance with strong volume confirmation
Trading Opportunity:
Entry: Current levels or on a slight pullback
Target: $0.136 (2x trading range extension with 40%+ upside potential)
Stop Loss: Below $0.075 to protect against trendline breakdown
