HYPE price analysisYesterday we looked at the possible prospects of #Aster, and today let’s dive into the chart of #Hype 📉
🔥 5 consecutive red daily candles on OKX:HYPEUSDT.P — something we haven’t seen for a long time.
And there are plenty of reasons for that. We’ll name just a few, and you can add more in the comments 👇
📉 Start of a broader correction on the crypto market
⚡️ #HYPE with 300x leverage on Aster DEX, while on Hyperliquid there’s only 3x leverage for their native token — a massive imbalance attracting big arbitrage volumes that push the price down
📰 A strong media campaign “Why Aster is better than Hype” → a clear example of dirty play by big money
💡 That’s why a bounce of #HYPE from $40 shows there’s still powder in the barrels.
From $36 — also fine, a retest of the first ATH.
But a potential fall to $29–30 would trigger a full stop-loss hunt on longs accumulated over the past six months.
❓Where do you think #HYPE will find support — $40, $36, or will it slip to $30?
______________
◆ Follow us ❤️ for daily crypto insights & updates!
🚀 Don’t miss out on important market moves
🧠 DYOR | This is not financial advice, just thinking out loud.
HYPEUSDT.3S trade ideas

HYPE Market Update📊 GETTEX:HYPE Market Update
GETTEX:HYPE is testing the blue support zone 🔵
If it breaks out to the downside with confirmation, there’s potential for a short setup with the first target at the green line level 🎯📉

HYPE - BULLISH SETUP GETTEX:HYPE - Bullish setup 📈
"🚨Team also announced that: GETTEX:HYPE TOKEN COULD SEE SUPPLY REDUCED BY 45%. "
Daily bottom is probably in! 🔥
Key support: $45.20
Lower: $43.30
Upper huge levels:
$48.90 - $50.00 - $50.70 - 52.50$
#HYPE #trading

$HYPE The HYPE/USDT pair is still moving within a medium-term uptrend, supported by a sustained trendline since May. Currently, the price is holding above the 44 support zone, which acts as a key level for buyers.
If this support holds, there is potential for the price to continue rising, with the first target around 51 (TP1) and an extended target toward 60 as the main TP. This scenario remains valid as long as the price does not break below 44. If support fails, the risk of a deeper correction toward the 38 level will open up.

HYPE SHORT #Update2Hello everyone 😍
💁♂️ Let's have an update for the HYPE-USDT cryptocurrency
👉 In the first analysis, we identified two paths, one is a decline from the same area,
The second is a decline from a higher area after consuming liquidity
From the first area, it fell by 18% and then moved up and consumed the high liquidity and the main decline started and fell again by 33%. 🔥
👉 It seems that the first and second targets, which are the lower orange areas, are within reach.
The first orange area is the $36.5 area.
The second orange area is the $31.5 area.
The third area is the $26 area (low probability) compared to the two areas above.
The blue path is the path I identified in the first analysis.
The red line is also a head and shoulders pattern on the daily and 4-hour time frames (the head and shoulders are inside the red circle)
The upper blue area is also the QM-level.
🤔 Did you use this analysis?
⚠️The analysis may not reach the final target, so at each target, if you make a good profit and see signs of a trend change, you can exit the trade or manage your capital.
⚠️ None of the analysis is a recommendation to buy or sell, but simply my personal opinions on the charts. You can use the charts and choose any that interest you and take a position if you wish.
To support me, I would appreciate it if you boost the analysis and share it with your friends so that I can analyze it with more energy for you, my dears. Thank you all. 💖

HYPE USDT LONG SETUPAs seen on the chart, the price executed a classic Smart Money maneuver by sweeping the liquidity below the Equal Lows (EQL) and immediately reversing to the upside with an explosive move.
This long trade setup is structured based on that price action:
Entry: On the pullback into an area of imbalance (Fair Value Gap - FVG).
Stop Loss: Below the recent structural low.
Targets: The liquidity resting at the previous highs.
This is a prime example of a high Risk/Reward trade (R/R ~ 3.6), which gains even more conviction when aligned with the project's strong fundamentals.
This analysis is for educational purposes only and is not financial advice.
#CryptoAnalysis #Hyperliquid #SmartMoneyConcepts #SMCTrade #TradingEducation #HYPE #HYPEUSDT

$HYPE Market Update📊 GETTEX:HYPE Market Update
GETTEX:HYPE looks like it’s forming a bullish Inverted Head & Shoulders pattern ✅
It’s now testing the red resistance zone 🔴 — if it breaks out with confirmation, the first target will be the blue line level 🎯

$HYPE short $45.5 PRINTING, the breakdown targetting $18GETTEX:HYPE has been crashing since that beautiful McDonald's DOUBLE TOP a week ago. 50% of asset's marketcap gone, like that.
Dipped below $40 for a tiny bit, cleared most of the LIQUIDITY below, now it has got a reason to go up to $47 in order to liquidate the bears.
Can it? Well we do have a very lively RISING WEDGE breakdown active targetting $18, and we established a lower low, so this is definitely BEARISH.
But, these recent crashes were only WAVE A, now we should expect WAVE B to $47-$52, and then WAVE C much lower again.
So, I would now short from here until WAVE B is complete.
I cashed in half of my short position, keeping the rest and moving my STOP LOSS to $45.3 (entry price, zero risk now). 💙👽

HYPE Analysis - September 25, 2025, 06:45 PM EDTHey guys, I am going to chart #HYPEUSDT today...
Price: $35.04
Down 23.08% (7d) after pullback from $45 ATH.
Technical Analysis:
Supports: $33, $30
Resistance: $40, $45
RSI: 42 (daily, sell)
MACD: Bearish, histogram narrowing
EMAs: Below 20-day ($40), above 50-day ($35)
Bollinger: Near lower band ($34)
HYPE/BTC Chart Analysis:
Ratio: 0.0000005
Supports: 0.00000045, 0.0000004
Resistance: 0.00000055, 0.0000006
RSI: 45 (daily, sell)
MACD: Bearish, histogram contracting
Patterns: Retest of channel support (September 18–25)
Bearish Engulfing: September 20
Doji: September 19
On-Chain Analysis:
MVRV: Neutral, slight undervaluation
Exchange Reserves: Stable, moderate selling
Whale Activity: $100M accumulation (weekly)
Coin Days Destroyed: Moderate, profit-taking
Glassnode Funding Rate: Negative on CEXs (SorooshX/OKX perpetual futures -0.005%, favoring shorts; indicates caution)
Fundamental News:
Macro: Fed rate cut signals Q4 2025
Regulatory: CFTC comments on DeFi frameworks
Institutional: $29B daily volume on Hyperliquid (August 2025)
Social Sentiment:
300K+ #HYPE mentions on X
50% bullish (ATH pullback debates, adoption focus)
Trend & Chart Patterns:
Channel Retest: Support at $33 (September 18–25)
Bearish Engulfing: September 20
Doji: September 19
Trend: Bearish short-term, rebound if $33 holds
Long-term: $55–$68 - $88 - $100 (2026)
Buy/Sell Signal: Hold (50% confidence)
Rationale: Bearish RSI/MACD, negative funding rates, and pullback from ATH suggest caution. On-chain accumulation and volume support rebound. Risks: Further dip if $33 breaks.
Hold or buy on dips: $33 or $30
Stop-loss: <$30
Target: $40 short-term, $58 - $68 (Q1 2026)
Disclaimer: Research before investing. #HYPE

$HYPE weak recovery attempt after RISING WEDGE breakdownGETTEX:HYPE is in trouble not just due to the RISING wedge breakdown I posted about last night, targetting $18 (deep bear market prices, will happen at some point) but also its tokenomics and competition from $ASTER so..
This coin stands out as one of my main candidates to SHORT and I will do that below $44.5. Sticking to the major horizontal which i marked 'BIG TROUBLE BELOW $44.6' last weekend when the price was $56.
Below $44.5 for me is where the RISING wedge breakdown is pretty much confirmed.
Watching CRYPTOCAP:BTC dominance first to breakout, then short this DEX coin into oblivion👽💙
Hype betas crowding the market like agent Smith In the world of memecoins, during the previous cycle you had token with "baby" appended in front of a bigger token's name. Their purpose was to use token tax collected from its trading (5% mostly) and use it to buy the main memecoin. These were the origins of beta play memecoins.
In this cycle, we had beta plays that didn't benefit the main coin in any way but they were made as a coping mechanism for people who missed out on the main one. Examples include countless WIF derivatives, blonde and brunette on base, trump and melania on sol earlier this year.
Regardless, in both the cases arrival of beta plays kills the main coin and ofcourse itself too. In previous cycle one would argue it made people think "what is the inherent value of this token if not collecting taxes to buy the main one? Why then shouldn't I buy the main one. Then their minds would ponder " what is the inherent value of the main one even? Why should I buy it?" And everything would nosedive. In this cycle, their is shortage of retail liquidity so arrival of beta plays sucks out monetary liquidity and attention liquidity from the main coin and injects it into the derivative. The derivative coin pumps while the main one dies. And then people realise the derivative doesn't have as much meme power as the main one. So this dies too and people move on to the next one.
But that's about memecoins. Such kinds of things shouldn't happen to serious chains right? Well i don't know if we should consider anything serious really. Call me silly but i see parallels between hype this cycle and luna last cycle. Both attracted people who wanted decentralisation above anything else. Although in case of hype the decentralisation factory is disputed, we can keep that talk for a later date. So cults can take things to the top but can they keep it up there? Maintainance is harder than the rise. I'm not saying it will crash and burn like luna but at some point the bells will be rung, and we'll be too busy partying loudly to hear them.
Binance founder came out of prison and decided to launch his own version of hyperliquid to vamp attack hype. This shouldn't be that concerning because eth and bnb have coexisted forever... Right? Not really. Hype is not eth. If you were there to see eth go from ico to $100 you'd understand what I'm saying. But regardless, this cycle even eth is struggling and bnb is breaking ATH after ATH. I was never a fan of binance ecosystem but i recently learned the chinese crypto community lives in their own world. For them BNB is both BTC and ETH. And anything the binance people make them believe. I'm not the biggest fan of Aster but chinese community+ hyperliquid factory + the fact that most retail normal people outside Anglo countries use binance makes me think....
HYPE is short term bearish desu.

HYPEUSDT.P - September 24, 2025The price action on the chart suggests that the asset is positioning itself for a bullish rally as we head into October. The recent price correction is a healthy retracement, setting the stage for a strong move higher.

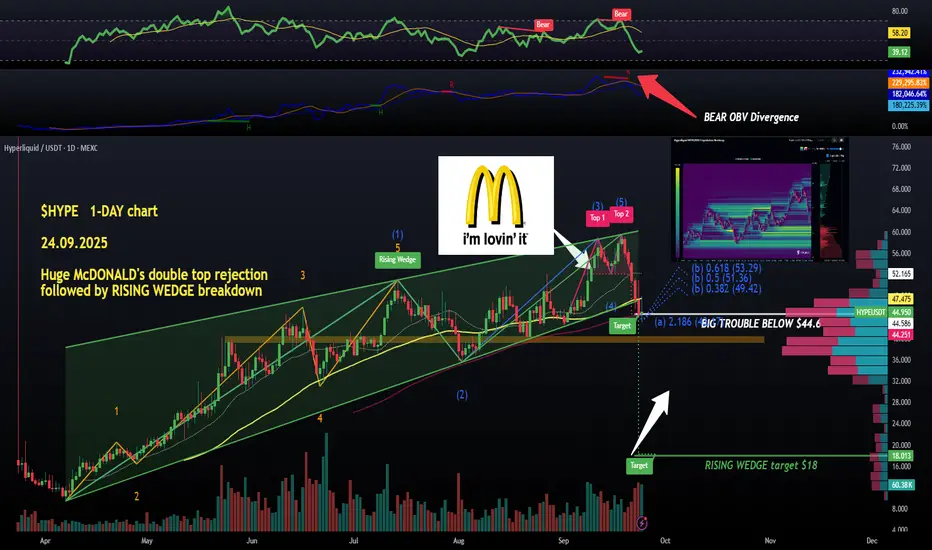
McDONALD's double top rejection & RISING WEDGE breakdown!GETTEX:HYPE was very weak looking last Saturday after that RISING WEDGE upper trendline rejection bit now it's looking like a dying patient in terms of this bullrun.
BREAKDOWN from the rising wedge has started at $47 when it also lost the yellow 50 MA which supported the structure.
And we had that rare MCDONALD'S kind of a double top reversal pattern with BEARISH divergences on both RSI and OBV, so if anybody stayed in the long after seeing that..
Targets are very low if this breakdown doesn't turn out to be a fake-out..
But to me, this bleeding are recent price action is due to $ASTER it's so obvious.
I will run further comparisons between the two DEXes as I expect their marketcaps to get much closer in size and soon, in Q3. CRYPTOCAP:BNB with its ATH helps a lot for confidence in this👽💙

$HYPE: 5-month-old RISING WEDGE being testedAbout GETTEX:HYPE ... I did warn twice since last Friday that the party was coming to an end. It was not because I'm such a genius, but the warning shots were being fired.
My $45 target was roughly reached (no trade for me, though).
Currently we are seeing a BEAR OBV divergence right at the lower trendline of our RISING WEDGE (a 5-month old pattern). The price MUST STAY inside the wedge or the chart becomes death. Simple 💙👽

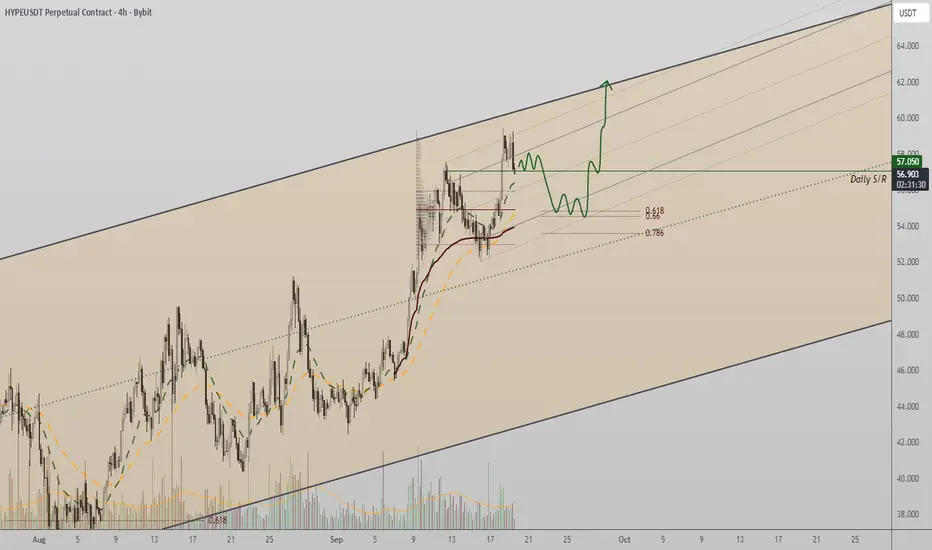
Hype's path to $55BYBIT:HYPEUSDT.P is currently forming a wedge shape pattern, is it indicating that it will break out and follow Path A, the blue path? I'm not so sure, I am sure we'll hit $55 either way.
If we take the red path, Path B, we'll come down to some heaviy support which could give us the fuel needed to get to $55
Out of all of the oscillators I was using, all except the chop zone on the daily mind you, were in bearish mode. So logically one would choose the red Path B right?
I can't wait to see how this plays out, shall we dip some and buy some more BYBIT:HYPEUSDT.P on Path B or experience more of a continuation of the current trendline to $55?
Let me know what you think in the comments, that'ls all for today, let's go HYPE!!! straight to $55!

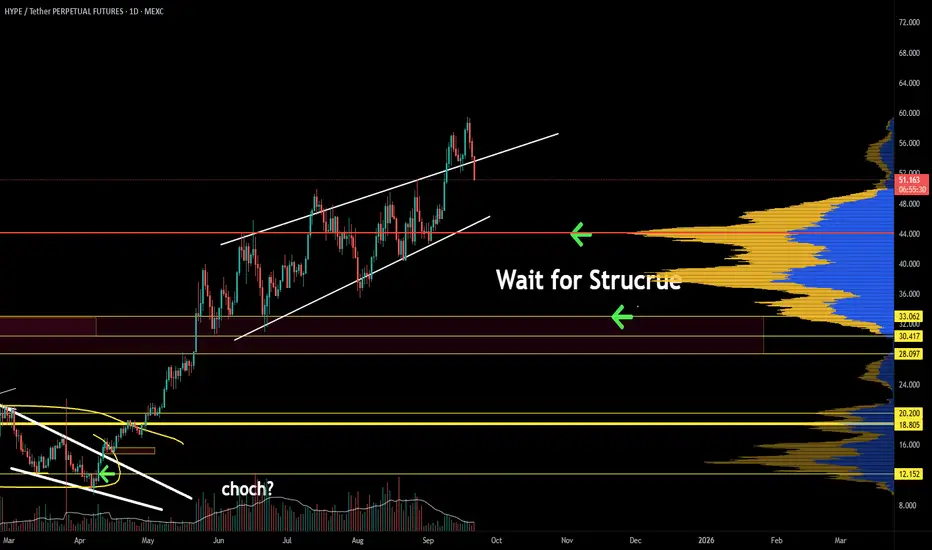
Hyperliquid Eyes 30% Move as Channel HoldsFor weeks, Hyperliquid has traded within a well-defined channel. Price is now approaching the point of control, 0.618 Fibonacci, and VWAP SR, creating a major confluence zone that could trigger a strong reversal.
Key Technical Points
- Channel Structure: Price oscillating between support and resistance.
- Confluence Support: POC + 0.618 Fibonacci + VWAP SR.
- Upside Potential: Swing trade setup offers 30%+ move.
Analysis
The channel remains highly respected, with every test of its boundaries leading to a decisive reaction. The current support cluster presents a high-probability reversal zone. If defended, price could rotate back to channel highs, creating a swing-trade opportunity.
However, sustained volume is required to confirm a bounce. Without inflows, price risks grinding lower within the channel before attempting another breakout.
What to Expect
Hyperliquid remains bullish while the channel structure holds. A reversal from support could yield a 30%+ upside move toward the highs.

HYPer long Perpawaiting current pullback , timing these lows important looking how price behaves 49.31 region

HYPE Swing Long IdeaHYPE Swing Long Idea
📊 Market Sentiment
FED has resumed its rate-cutting cycle, starting with a 0.25% cut in September, with two more 0.25% cuts expected in the coming months. Additionally, institutional liquidity inflows have accelerated as the U.S. officially adopts crypto as part of its reserves. While inflation remains elevated, the weakening labor market is forcing the FED to ease, driving more capital into risk-on assets.
📈 Technical Analysis
Price broke the HTF Key Level and closed above, leading to price discovery.
It is also supported by the HTF Bullish Trendline.
Currently, price is retracing from its discovery highs.
📌 Game Plan
1-Retest of HTF Key Level at $50
2-Retest of HTF Bullish Trendline
3-Possible retrace into Fibonacci EQ (discount zone) at $47.55
🎯 Setup Trigger
• 4H break of structure after retest
• Alternative: Daily close back above HTF Bullish Trendline in case of deviation (deviation entry method)
📋 Trade Management
Stoploss: Below the 4H swing low that breaks structure
Target: $59.5 (ATH)
Carrying 25% runner with stop at breakeven for extended gains
💬 Like, follow, and comment if you find this setup valuable!
⚠️ Disclaimer: This content is for informational and educational purposes only and does not constitute financial, investment, or trading advice. Always DYOR before making any financial decisions.

Hyperliquid showing weakness as competition moves in.HPYE momentum is slowing down at the end of a rising wedge. Divergence is a sign that bullish momentum is slowing down, and follow-through should be expected. As trend line liquidity is hunted, be prepared for the base of the wedge to be a solid POI.
Crypto Analysis – HYPE Market Report and Price OutlookMarket Report – HYPE/USDT
The market has been moving in a wide range with alternating phases of expansion and correction. Earlier momentum was dominated by aggressive buyers, driving price toward higher valuation zones. However, this upward flow slowed down, allowing sellers to step in and create a corrective phase.
During the last sessions, activity shifted into redistribution, where both buyers and sellers tested liquidity. The strong rejection from the upper levels indicates exhaustion of short-term bullish momentum, opening the way for deeper corrective moves. At the same time, the dotted projection reflects market expectation that after sweeping lower liquidity pockets, buyers could return strongly to retest higher valuation areas.
The overall structure reveals engineered volatility designed to capture both sides of the market before a decisive directional move. Short-term pressure remains on the downside, but the broader behavior suggests preparation for another expansion cycle.

Lingrid | HYPEUSDT Pullback Pattern Long OpportunityThe price perfectly fulfilled my previous idea . KUCOIN:HYPEUSDT is holding above 55 after rebounding from the 53.5 support zone and respecting the upward trendline. The chart shows strong bullish momentum, with buyers eyeing the 60 resistance level, which also aligns with the upper boundary of the resistance zone. A breakout above 60 would open the path toward the 64–66 target area inside the broader channel. As long as 53.5 holds as support, the bias remains to the upside.
⚠️ Risks:
A breakdown below 53.5 could trigger a correction toward 47.8.
Crypto market volatility driven by Bitcoin dominance shifts may impact momentum.
Failure to sustain volume near 60 could cause rejection and consolidation back inside the channel.
If this idea resonates with you or you have your own opinion, traders, hit the comments. I’m excited to read your thoughts!

Hype Coin Holds Bullish Momentum with Key Support at $54Hype’s price action remains firmly bullish, consolidating above daily support while continuing to press toward untested resistance levels. The broader channel suggests higher prices may still be ahead, with technical confluence offering a clear zone for potential continuation.
- Trend Intact: Higher highs and higher lows confirm bullish structure.
- $54 Support Zone: Confluence of 0.618 Fibonacci, Pitchfork, VWAP, and point of control.
- Upside Potential: Untested channel highs remain valid targets.
Price has yet to test the channel high resistance, leaving room for further expansion. Should a retracement occur, the $54 region becomes a critical level to watch. This zone combines several powerful supports, including the 0.618 Fibonacci retracement, the Pitchfork level, VWAP support, and the point of control of the current range.
Such a confluence typically attracts buyers, creating a strong foundation for the next rally. A successful retest would likely result in another leg higher, reinforcing the ongoing bullish market structure.
What to Expect
Hype remains bullish at current levels, but a retracement to $54 could provide an even stronger entry point for continuation. As long as higher lows remain intact, the bullish case dominates.
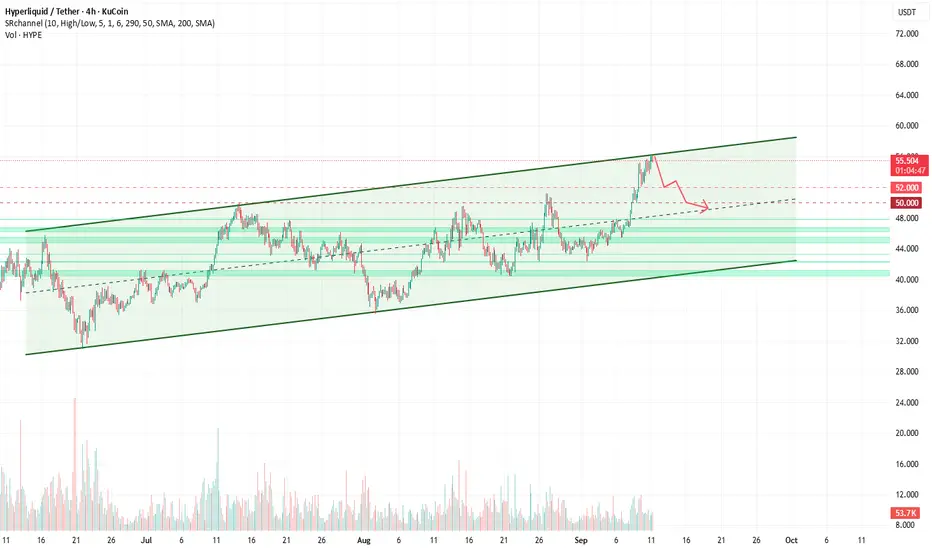
HYPE! change scenario & start correction🔹 On the 4H timeframe, Hyperliquid/USDT is moving within a mid-term ascending channel. The price is currently testing the channel’s upper boundary around 55.5–56 USDT, where early signs of weakening buying momentum can be observed.
🔹 Considering the confluence of the dynamic channel resistance and the static resistance at 55–56, there is a strong probability of a corrective or bearish move starting from this zone. Key supports are located at 52.5 – 50 – 47.5 USDT. A breakdown below 47.5 could open the way for a deeper correction towards 44–42 USDT.
🔹 On the contrary, if the price manages to break above the channel top with strong volume and confirm the breakout, the next targets could be 58–60 USDT. However, unless a valid breakout occurs, the primary scenario remains a bearish correction from the channel top.
*This my idea, always do your analysis in trading ;)