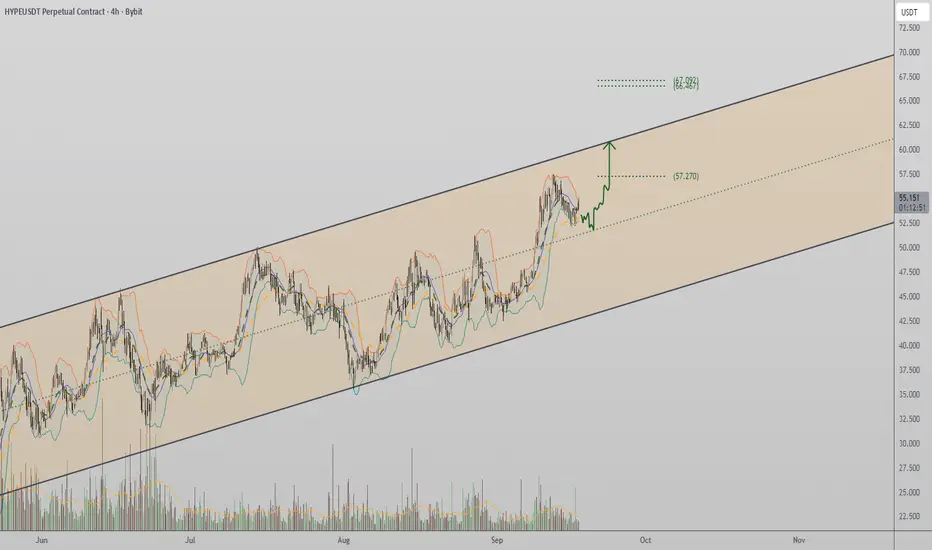
Hyperliquid Positions for $60 Fibonacci ExtensionHyperliquid continues to build on its bullish momentum, with price action forming consecutive higher highs and higher lows. The next technical target sits at $60, aligning with the 0.618 Fibonacci extension.
Hyperliquid has stood out as one of the strongest trending altcoins, maintaining an orderly bullish structure. Price is currently trading near the upper echelons of its range, with clear technical confluence pointing toward a move into the $60 level. The sustainability of this rally depends on whether support zones beneath can hold.
Key Technical Points:
Consistent higher highs and higher lows maintain bullish momentum.
Price trading near the upper band of its range.
$60 target aligns with Fibonacci extension confluence.
The structure of Hyperliquid’s chart remains impressive, with buyers consistently stepping in to defend support. This pattern of higher lows signals persistent demand, while higher highs confirm momentum continuation. Price is now pressing near the top of its range, where many traders expect resolution toward the $60 extension target.
The Fibonacci extensions of the current impulse leg reinforce this target, with the 0.618 level providing a strong technical anchor. Historically, this zone has acted as both resistance and a magnet for continuation moves. Should the trend maintain its rhythm, the probability of a test of $60 in the short term remains high.
Traders should, however, remain aware of potential consolidations or retracements. A failure to hold support could open the door for a pullback into mid-range levels, though such dips would likely be seen as opportunities in a bullish context.
What to Expect in the Coming Price Action:
Hyperliquid is poised for a potential move into $60, provided bullish structure remains intact. Volume confirmation will be key in sustaining this momentum, with support retests likely to define the pace of the move.
HYPEUSDT.3S trade ideas
hypeusdtHype analysis, waiting for a correction to enter a buy.
HypeUSD has risen that high, waiting for a correction.
The whale is looking to dump its goods.
Let's just wait and see if there will be a correction.


HYPE- long plan ,bullish continuation 🚀 GETTEX:HYPE Daily Chart looking 🔥
🔹Price has broken out strong and is now setting up for a healthy retracement. Eyes are on the Daily FVG + Fib Zone around $50 – a perfect area for bulls to reload before the next leg up.
🔹Liquidity has been swept, structure is bullish, and momentum is still on our side. As long as this zone holds, the next move could send us into new highs. 📈
This dip = opportunity. Don’t fade the HYPE. ✨

Elliot Wave📚 Elliott Wave Trading Strategy — Education Framework
1. Origins & Philosophy
Ralph Nelson Elliott (1920s–1930s): Found that markets, while seeming chaotic, often move in repeating wave structures.
Core Belief: Market psychology cycles between optimism and pessimism in a fractal pattern.
Purpose: Provides a roadmap of where the market could be within a cycle (not a certainty).
2. The Two Types of Waves
Impulse (Motive) Waves (1–5):
Move in the direction of the main trend.
Rules:
Wave 2 never retraces >100% of Wave 1.
Wave 3 is never the shortest.
Wave 4 doesn’t overlap Wave 1.
Net result = trend continuation.
Corrective Waves (A–B–C):
Move against the main trend.
Three-wave structure: down (A), up (B), down (C) in a bull market.
Typically retraces a Fibonacci % of the prior impulse.
3. Key Components
Fractals: Small waves make up bigger ones, across timeframes.
Degrees of Waves: From Grand Supercycle (multi-century) to Subminuette (intraday).
Fibonacci Ratios: Common retracement levels (38.2%, 50%, 61.8%) and extensions (161.8%) guide targets.
4. Practical Trading Strategy
Elliott Wave by itself is subjective. The edge comes when combined with confirming indicators.
Example Workflow for Swing Trading
Identify Trend Direction:
Use 50-day/200-day MA, Ichimoku, or ADX.
Wave Counting:
Label impulse waves 1–5.
Wait for a corrective wave A–B–C.
Entry:
Many Enter end of Wave 2 or Wave 4 (buy dips in uptrend). Try entering a wave earlier, so that you lock in better Risk to Reward.
Use momentum oscillators (RSI/Stochastics) to confirm end of correction.
Exit/Profit Target:
Project Wave 3 or 5 using Fibonacci extensions (often 161.8% of Wave 1).
Stop Loss:
Below Wave 1 start (if long).
Above Wave 1 start (if short in a bear sequence).
5. Who Uses Elliott Wave?
Day Traders / Swing Traders: To catch impulse waves.
Long-term Investors: To avoid topping markets (useful in bubbles).
Cross-Market Traders: Applies in stocks, forex, commodities, crypto.
6. Advantages
✅ Provides forward-looking framework (not just lagging).
✅ Works across asset classes and timeframes.
✅ Helps identify where we are in a market cycle.
✅ Blends well with Fibonacci, RSI, and trend filters.
7. Disadvantages
❌ Highly subjective (two traders may count waves differently).
❌ No guarantee — probabilities, not certainties.
❌ Developed in the 1930s, critics argue it hasn’t adapted well to algorithmic/modern markets.
8. Famous Elliott Wave Calls
Dow 2002–03 Crash: Prechter predicted drop from 11,000 → 7,000.
Gold 2011 Peak: Predicted ~$1,900 top.
Bitcoin 2017: Analysts called $20K top → $3K.
9. Common Mistakes
Forcing wave counts (bias confirmation).
Ignoring other indicators.
Trading every wave → instead, focus on the big impulses.
No patience (wave structures can take weeks or months).
✅ Summary Strategy (Simple Version)
Use MAs or trendlines → determine main trend.
Count impulse waves → focus on Wave 3 and Wave 5 (strongest).
Wait for corrective pullback (Wave 2 or 4).
Enter with oscillator confirmation + Fibonacci retracement.
Exit at Fibonacci extension or trend exhaustion.


#HYPEUSDTThe currency is showing potential and
has attacked a strong resistance ceiling.
Watch out for a break of this point.

Shorting $HYPE
Hyperliquid has been sending nonstop and CT is screaming ATH + $100 soon. That’s usually when late longs get trapped.
I’m eyeing a short if we get a blow-off move into the $60–65 zone and it fails. Need that rejection wick before pulling the trigger.
Plan:
Entry: 55 - 60 or a lil below if it rejects
Stop: above $70 (invalidate)
Targets: $52 / $48 / $42
If it blasts through $70 with volume, short idea is cooked and $80–100 opens up next. Simple as that.

HYPEUSDT → Upward consolidation. One step away from a rally BINANCE:HYPEUSDT.P continues to consolidate while maintaining an ascending triangle structure. Any bullish driver, even a weak one, could trigger a breakout of resistance and distribution with an ATH update...
Against the backdrop of weak Bitcoin and falling altcoins, HYPE looks positive. The market is holding an upward support line and a bullish trend, and the update of the local maximum as a manifestation of bullish strength is a positive sign. The price is changing the local market structure to bullish and is ready to continue growing after a correction. Focus on the 46.15 and 45.5 - 45.08 areas. A false breakdown and closing above the level will confirm the readiness to continue growing.
Resistance levels: 47.78, 49.54
Support levels: 46.15, 45.08, 44.45
As part of the correction, the price may test the specified areas of liquidity and interest, which may provoke a change in the market imbalance in favor of buyers. If, after a false breakdown of key areas, the bulls keep the price above, then in the short and medium term, we can expect continued growth.
Sincerely, R. Linda!

Hyper Liquid Eyes Breakout as $48 Resistance WeakensHyper Liquid price action remains decisively bullish, with consecutive higher highs and higher lows confirming strong momentum. The $48 level has capped upside moves so far, but constant retests have eroded its strength, setting the stage for expansion toward new all-time highs.
Hyper Liquid Key Technical Points
- Resistance at $48: A critical level repeatedly tested, showing signs of weakening.
- Market Structure: Higher highs and higher lows confirm a bullish framework.
- Upside Potential: A reclaim of $48 could accelerate price into fresh all-time highs.
Analysis
The $48 mark has acted as a stubborn resistance zone, rejecting price multiple times. However, in technical analysis, repeated retests of resistance weaken the level over time, increasing the probability of a breakout. The persistence of buyers at this zone demonstrates underlying strength, and once this level is reclaimed, it is likely to serve as support for continuation higher.
From a structural perspective, Hyper Liquid remains extremely bullish. The consistent pattern of higher highs and higher lows signals a well-defined uptrend, showing that every corrective move has been absorbed by demand. This healthy structure provides a foundation for further expansion and reinforces the idea that the recent rejections are more consolidation than reversal.
If $48 is broken with conviction, acceleration toward new all-time highs is expected. Such a breakout would confirm market acceptance at higher levels and create the conditions for momentum-driven expansion. The bullish framework suggests this move would not just be a short-term spike, but part of a continuation in the broader trend that has been unfolding for weeks.
What to Expect in the Coming Price Action
Hyper Liquid is positioned for an upside breakout, with $48 serving as the key level to watch. A successful reclaim would likely trigger acceleration into new all-time highs, confirming continuation of the bullish trend.

HYPE/USDT Forming a Potential Bullish CodingHYPE/USDT potential target is around $53 - $56 based on the Fibonacci Level if it can break its solid resistance - white background. This outlook will remain valid as long as HYPE/USDT does not cross the invalidation line at $40.

Clean Long Setup for Hype I see a good probability trade
• Confluences:
- Bullish Market Structure
- Break of Structure
- Order Block/Demand Zone
- 15min RSI Oversold
- 15min potential MACD crossover
- Discount Zone
- Fibonacci Entry Retracement
HYPE | Looking for All-Time HighsHYPE | Looking for All-Time Highs
📊 Market Sentiment
Market sentiment remains strongly bullish as the FED is set for a 0.25% rate cut, with the possibility of a 0.5% cut in September. Monetary policy is being adjusted not only in response to inflation but also weak labor market data. Recent August and September job numbers came in soft, signaling that the economy is cooling rapidly. This shift is fueling expectations for one of the strongest bullish runs in the coming weeks.
📈 Technical Analysis
HYPE continues to show a strong HTF bullish trend — one of the most bullish structures currently in crypto. Price retraced into the 0.75 HTF discounted range and reacted strongly from there. This level also aligned with the HTF bullish trendline, creating a clean confluence. Following the bounce, price established a fresh 4H demand zone, adding further validation to the bullish outlook.
📌 Game Plan
I will be watching for price to revisit the 4H demand zone, which also overlaps with the HTF bullish trendline. This zone aligns with the 0.5 Fibonacci equilibrium level, making it a key area of interest for continuation to the upside.
🎯 Setup Trigger
I will look for a confirmed 1H break of structure before entering long.
📋 Trade Management
Stoploss: Below the 1H swing low responsible for the BOS
Targets:
• TP1: $47.78
• TP2: $51.20 (ATH)
💬 Like, follow, and comment if you find this setup valuable!
⚠️ Disclaimer: This content is for informational and educational purposes only and does not constitute financial, investment, or trading advice. Always do your own research before making any financial decisions.

Hype Breakout Above $47.6?Hype continues to consolidate near the 45.95 resistance on the 4-hour chart. In this update, I break down the short-term roadmap with clear resistance and support levels. A breakout above 45.95 could open the way to 47.57, 49.32, and even 52.14 in the coming sessions.
On the downside, supports to watch are 44.32, 42.58, and 40.49. The broader structure remains constructive above 38.27, and my bias continues to be for more upside as long as that foundation holds. Watch these levels closely as they will define the next move for Hype.

TradeCityPro | HYPE Weakens Inside Ascending Channel👋 Welcome to TradeCity Pro!
In this analysis, I want to review the HYPE coin for you. It is one of the coins that has recently trended and with a market cap of 15.31 billion dollars is ranked 12th on CoinMarketCap.
📅 Daily Timeframe
In the daily timeframe, this coin has had a very long-term upward trend that has now shown weakness after breaking the 31.132 zone, and its slope has decreased significantly.
✨ After the 31.132 break, an ascending channel has formed, and the price is correcting in the direction of the trend.
📊 The volume has gradually decreased, indicating weakness in this upward move, and on the other hand, RSI has shown a strong divergence.
💥 Of course, the RSI divergence has not yet been activated, and it is natural for RSI to show divergence when the price is in a correction and consolidation phase.
✅ Currently, the price is in the lower half of the channel and has reacted several times to the bottom and midline of the channel. If the resistance at 49.223 is broken, the price structure can change, and if volume starts to increase, the probability of breaking the channel top rises significantly.
⚡️ On the other hand, considering all the negative signs that have led to this trend weakness, the possibility of breaking the channel to the downside is also high.
📈 In that case, with the break of the 40.625 or 36.871 triggers, we can open a short position, but in my opinion, as long as the price is above the 31.132 zone, short positions are not logical and the market trend remains bullish.
📝 Final Thoughts
Stay calm, trade wisely, and let's capture the market's best opportunities!
This analysis reflects our opinions and is not financial advice.
Share your thoughts in the comments, and don’t forget to share this analysis with your friends! ❤️

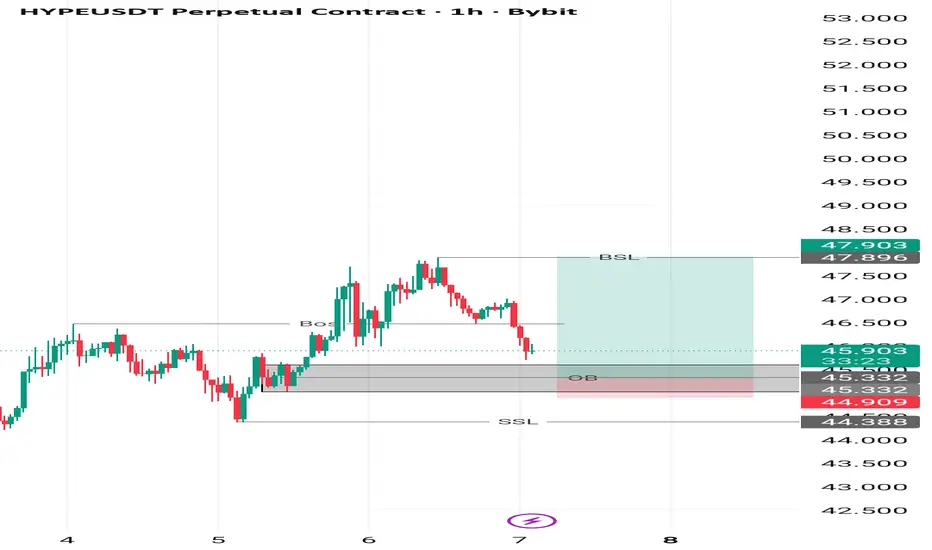
Hyperliquid (HYPE): Potential Good Trade Can Be Taken HereHYPE just gave us a clean breakout and is now retesting the structure. This retest is key — if buyers manage to hold here, we’ll have confirmation for continuation to the upside.
The level to watch is around $46, a break above that area opens the way towards the $51 target. As long as this retest holds, we stay bullish and look for the move into that higher resistance zone.
Swallow Academy

Sep 3, 2025 - HYPEUSDT Long Position ReviewConsidering the daily uptrend, the touch of the ascending trendline provided a good opportunity for a long setup.
On the 1H timeframe, after the formation of a range box with a fake breakdown to the downside, the first bullish signs appeared. As the range continued, the creation of higher lows confirmed stronger buying pressure. With the breakout of the box resistance, rising volume during the upward move, and the RSI entering the overbuy zone , conditions for a long entry became clear.
However, I decided to act earlier — with the increase in volume and the RSI moving higher, I placed a buy stop order at 45.60 to catch any sharp breakout.
This position is now active, and I’m waiting for the next targets to be assigned.

$HYPE – Moon at $50 or steal it at $20?KUCOIN:HYPEUSDT | 1D
Hyperliquid rallied 446% off the lows, grinding up to $51.
The hurdle that needs to regain is the $47–48 level. If price won’t reclaim this zone and loses its base, a drop toward $30–27 (previous value area high) is likely.
Strongest buy zone remains $20–17.

HYPE-USDT SHORT UPDATE #1Hello my friends 😍
I am back with a very interesting update from the last analysis I put on the HYPE-USDT cryptocurrency 😎
💁♂️ In the previous analysis I identified the supply area and considered two scenarios
1️⃣ The first scenario was that it enters the supply area and consumes liquidity and then we will see a price correction
2️⃣ The second scenario was that it crosses the supply area and consumes liquidity from the higher areas and then we move downwards
✅ The first scenario was activated and after hitting the supply area we have seen a price correction of more than 14% so far
What could be better than this? 🙂↕️
Did you use the analysis and find it useful? 🤔
Share your comments with me 😍
To support me, I would appreciate it if you boost the analysis and share it with your friends so that I can analyze it with more energy for you, my dears. Thank you all. 💖

POSSIBLE LONG HYPE D29aug
- good volume
- ascending triangle D
- atmosphere crypto good cut rate
- no fud on crypto

HYPE LONGManipulated into 4H demand zone.
Bullish biased confirmed - weekly highs already taken.
Targetting fixed 3RR don't be greedy
goodluck

Hyperliquid defended the $43 level ┆ HolderStatOKX:HYPEUSDT.P on the 8h chart is showing strength after breaking out of a falling channel. The price is holding above 42.9, supported by a pattern of triangles and sideways ranges that consistently preceded bullish extensions. If momentum holds, the market could target 47.5 and eventually 50, suggesting accumulation is ongoing with breakout potential building.

Lingrid | HYPEUSDT Level Breakout: Bullish ContinuationKUCOIN:HYPEUSDT is rebounding after retesting the 46.000 support zone, which aligns with a higher low in the broader structure. Price action remains locked between the upward support trendline and the descending resistance trendline, forming a compression phase. A confirmed hold above 46.000 keeps the path open toward 55.000, with breakout potential if momentum accelerates. The overall setup suggests a bullish continuation pattern as long as higher lows are maintained.
📉 Key Levels
Buy trigger: Rejection of 46.000 support
Buy zone: 45.000–46.000
Target: 55.000
Invalidation: Break below 45.000
💡 Risks
Failure to hold the higher low structure could shift momentum back toward 36.126.
Macro headwinds from stronger USD could pressure risk assets.
Rejection at the descending trendline may delay the bullish continuation.
If this idea resonates with you or you have your own opinion, traders, hit the comments. I’m excited to read your thoughts!
