$IBIT dont want to buy actual bitcoin but still want the gains>?this is your choice if you're a disciplined investor ;; NASDAQ:MSTR is going to be on its own ride for a litte bit ;;;
this is 1;1 BTC ? right tf . better be -- im long on leaps AMEX:BMNR CRYPTOCAP:BTC NASDAQ:MSTR NASDAQ:IBIT
Key stats
About iShares Bitcoin Trust ETF
Home page
Inception date
Jan 5, 2024
Structure
Grantor Trust
Replication method
Physical
Dividend treatment
Capitalizes
Distribution tax treatment
Ordinary income
Income tax type
Capital Gains
Max ST capital gains rate
39.60%
Max LT capital gains rate
39.60%
Primary advisor
BlackRock Fund Advisors
Identifiers
3
ISINUS46438F1012
Established on June 8, 2023, iShares Bitcoin Trust (IBIT) was launched by BlackRock, a leading global asset manager and ETF provider. The trust allows investors to incorporate Bitcoin into a standard brokerage account. In addition to its pricing aspect, IBIT's appeal lies in its ability to alleviate the operational challenges linked to the direct holding of Bitcoin, along with the potential mitigation of substantial trading expenses and complexities in tax reporting.
Related funds
Classification
Symbol
Geography
Global

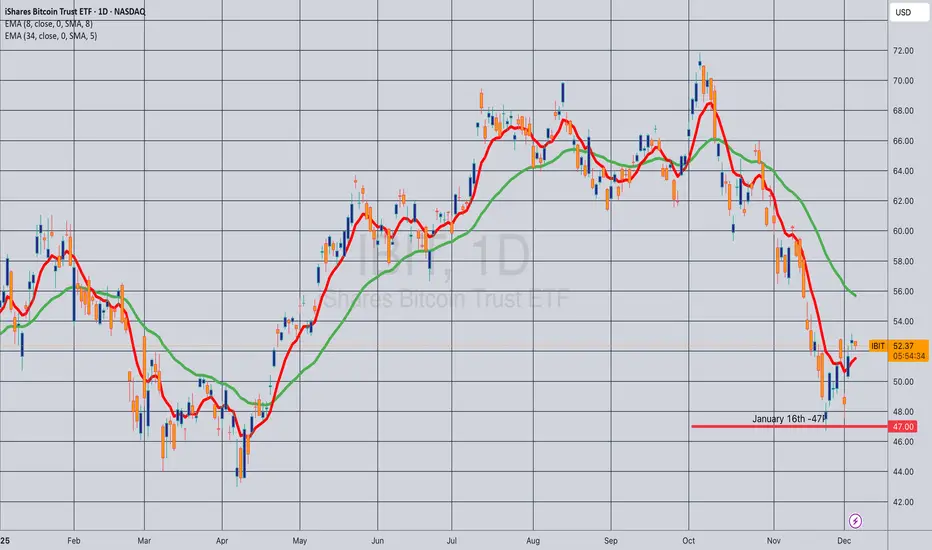
Opening (IRA): IBIT January 16th -47P... for a 1.36 credit.
Comments: Adding at intervals at strikes better than what I currently have on, targeting the 25 delta (ish) strike.
Metrics:
Max Profit: 1.36 ($136)
Buying Power Effect: 45.64
ROC at Max: 2.98%
Will generally look to start taking profit at 50% of max and/or roll to obtain
Opening (IRA): IBIT Feb 20th -45P... for a 1.07 credit.
Comments: Adding at intervals ... .
Metrics:
Max Profit: 1.07 ($107)
Buying Power Effect: 43.93
ROC at Max: 2.44%

Opening (IRA): IBIT January 30th -45P... for a 1.37 credit.
Comments: Adding at intervals at strikes better than what I currently have on (Jan 16th -47P, March 20th -52P), targeting the 25 delta strike.
Metrics:
Max Profit: 1.37 ($137)
Buying Power Effect: 43.63
ROC %-age at Max: 3.14%

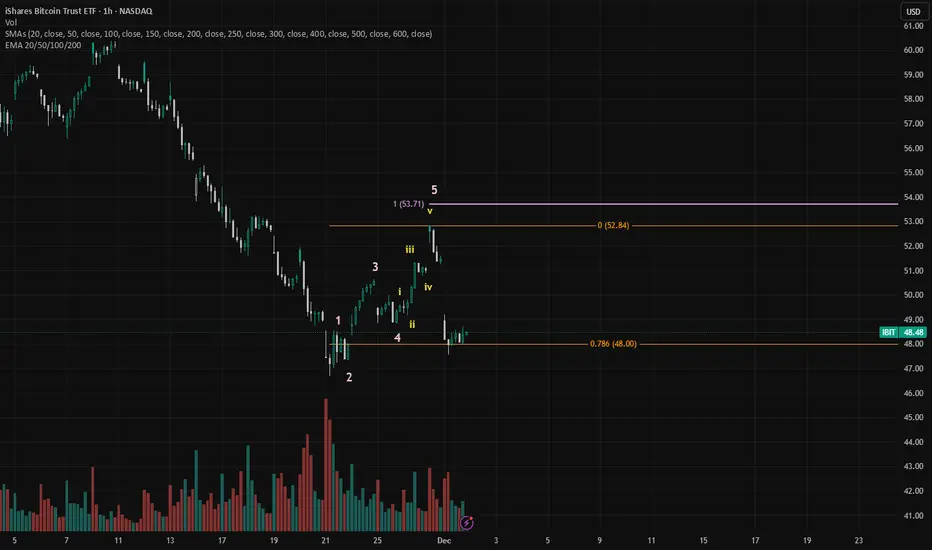
IBIT in 1H ApexAs you can see here, IBIT is consolidating inside the 100sma and the apex is in play. Likely to see continuation into the 200MAs and into the yellow box, the resistance area.
Possibly 10% in near term.

Opening (IRA): IBIT December 19th -56P... for a 1.67 credit.
Comments: A starter position at around the 25 delta strike. Will look to add at intervals, assuming I can get in at strikes better than what I currently have on.
Metrics:
Max Profit: 1.67 ($167)
Buying Power Effect: 54.33
ROC at Max: 3.07%

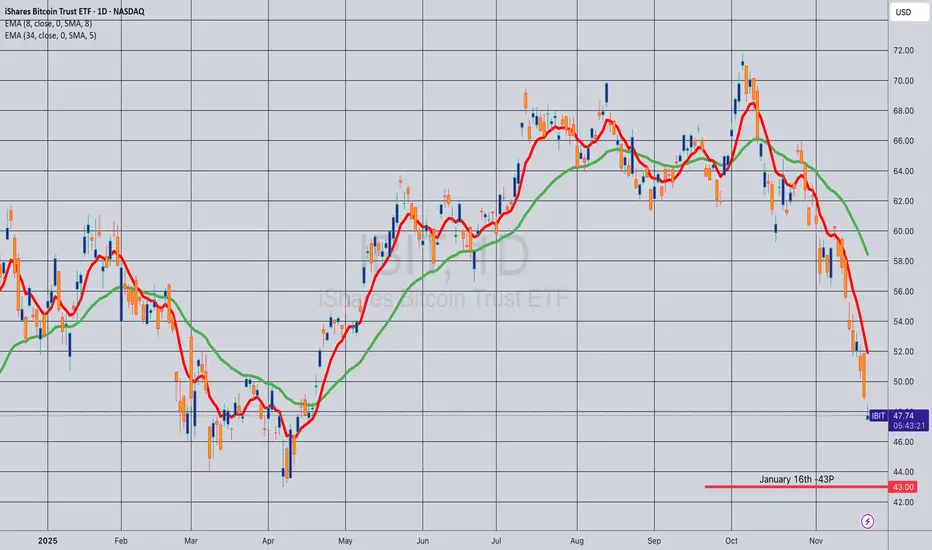
Opening (IRA): IBIT January 16th -43P... for a 2.07 credit.
Comments: Adding at intervals at strikes better than what I currently have on, targeting the 25 delta strike.
Metrics:
Buying Power Effect: 40.93
Max Profit: 2.07 ($207)
ROC at Max: 5.06%
$BTC $IBIT a backtest and higher soonCRYPTOCAP:BTC NASDAQ:IBIT : One can count 5-waves up from the $46 low to the last Friday high. A backtest of this bounce is quite normal. I expect another bound to at least AB = CD of $53 area, which is a 10% move from the current position.
One needs to be careful with position sizing though. W
IBIT vs GOLD. BIGGER RISK ≠ NOT EQUAL BIGGER PROFITS.This publication is a simple comparision of two assets:
iShares Bitcoin Trust ETF NASDAQ:IBIT that has been launched (among many others) in Jan. 2024
Gold spot OANDA:XAUUSD as itself.
Returns over the nearly past two years you can see by yourself. Bigger risk (+ left-and-right + back-and-f

iShares Bitcoin Trust (IBIT) Technical AnalysisThe iShares Bitcoin Trust (IBIT) is testing the critical support level of the medium-term rising channel it has maintained since the fourth quarter of 2024. The pullback that began from the channel upper band resistance seen in September/October 2025 (around the $65.00 region) has brought the price

See all ideas
Summarizing what the indicators are suggesting.
Oscillators
Neutral
SellBuy
Strong sellStrong buy
Strong sellSellNeutralBuyStrong buy
Oscillators
Neutral
SellBuy
Strong sellStrong buy
Strong sellSellNeutralBuyStrong buy
Summary
Neutral
SellBuy
Strong sellStrong buy
Strong sellSellNeutralBuyStrong buy
Summary
Neutral
SellBuy
Strong sellStrong buy
Strong sellSellNeutralBuyStrong buy
Summary
Neutral
SellBuy
Strong sellStrong buy
Strong sellSellNeutralBuyStrong buy
Moving Averages
Neutral
SellBuy
Strong sellStrong buy
Strong sellSellNeutralBuyStrong buy
Moving Averages
Neutral
SellBuy
Strong sellStrong buy
Strong sellSellNeutralBuyStrong buy
Displays a symbol's price movements over previous years to identify recurring trends.
Curated watchlists where IBIT is featured.

Bitcoin ETFs: Spot trading hits Wall Street
11 No. of Symbols
See all sparks
Frequently Asked Questions
An exchange-traded fund (ETF) is a collection of assets (stocks, bonds, commodities, etc.) that track an underlying index and can be bought on an exchange like individual stocks.
IBIT trades at 50.94 USD today, its price has risen 2.60% in the past 24 hours. Track more dynamics on IBIT price chart.
IBIT net asset value is 50.95 today — it's fallen 1.61% over the past month. NAV represents the total value of the fund's assets less liabilities and serves as a gauge of the fund's performance.
IBIT assets under management is 67.91 B USD. AUM is an important metric as it reflects the fund's size and can serve as a gauge of how successful the fund is in attracting investors, which, in its turn, can influence decision-making.
IBIT price has fallen by −3.06% over the last month, and its yearly performance shows a −7.20% decrease. See more dynamics on IBIT price chart.
NAV returns, another gauge of an ETF dynamics, have fallen by −1.61% over the last month, showed a −25.74% decrease in three-month performance and has decreased by −8.09% in a year.
NAV returns, another gauge of an ETF dynamics, have fallen by −1.61% over the last month, showed a −25.74% decrease in three-month performance and has decreased by −8.09% in a year.
IBIT fund flows account for 24.84 B USD (1 year). Many traders use this metric to get insight into investors' sentiment and evaluate whether it's time to buy or sell the fund.
Since ETFs work like an individual stock, they can be bought and sold on exchanges (e.g. NASDAQ, NYSE, EURONEXT). As it happens with stocks, you need to select a brokerage to access trading. Explore our list of available brokers to find the one to help execute your strategies. Don't forget to do your research before getting to trading. Explore ETFs metrics in our ETF screener to find a reliable opportunity.
IBIT expense ratio is 0.25%. It's an important metric for helping traders understand the fund's operating costs relative to assets and how expensive it would be to hold the fund.
No, IBIT isn't leveraged, meaning it doesn't use borrowings or financial derivatives to magnify the performance of the underlying assets or index it follows.
In some ways, ETFs are safe investments, but in a broader sense, they're not safer than any other asset, so it's crucial to analyze a fund before investing. But if your research gives a vague answer, you can always refer to technical analysis.
Today, IBIT technical analysis shows the neutral rating and its 1-week rating is sell. Since market conditions are prone to changes, it's worth looking a bit further into the future — according to the 1-month rating IBIT shows the neutral signal. See more of IBIT technicals for a more comprehensive analysis.
Today, IBIT technical analysis shows the neutral rating and its 1-week rating is sell. Since market conditions are prone to changes, it's worth looking a bit further into the future — according to the 1-month rating IBIT shows the neutral signal. See more of IBIT technicals for a more comprehensive analysis.
No, IBIT doesn't pay dividends to its holders.
IBIT trades at a premium (0.02%).
Premium/discount to NAV expresses the difference between the ETF’s price and its NAV value. A positive percentage indicates a premium, meaning the ETF trades at a higher price than the calculated NAV. Conversely, a negative percentage indicates a discount, suggesting the ETF trades at a lower price than NAV.
Premium/discount to NAV expresses the difference between the ETF’s price and its NAV value. A positive percentage indicates a premium, meaning the ETF trades at a higher price than the calculated NAV. Conversely, a negative percentage indicates a discount, suggesting the ETF trades at a lower price than NAV.
IBIT shares are issued by BlackRock, Inc.
IBIT follows the CME CF Bitcoin Reference Rate - New York Variant - Benchmark Price Return. ETFs usually track some benchmark seeking to replicate its performance and guide asset selection and objectives.
The fund started trading on Jan 5, 2024.
The fund's management style is passive, meaning it's aiming to replicate the performance of the underlying index by holding assets in the same proportions as the index. The goal is to match the index's returns.