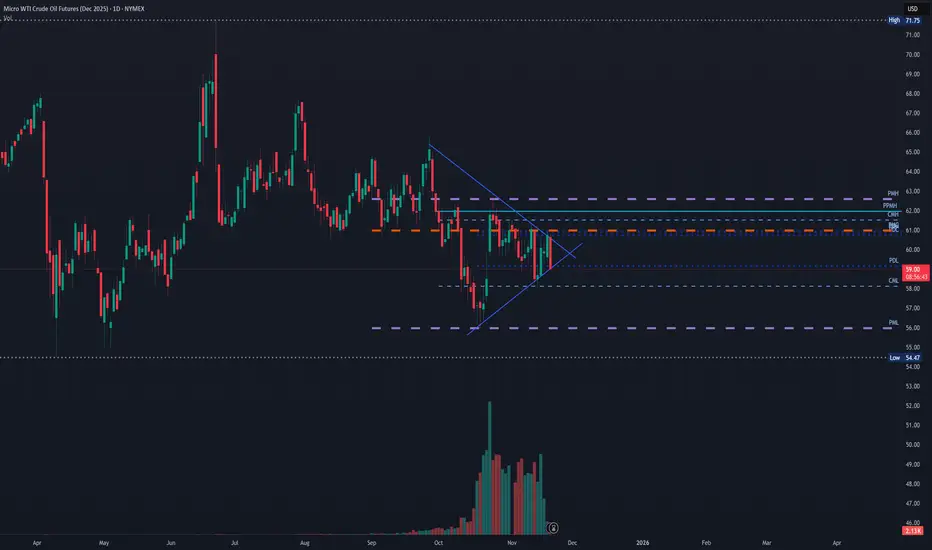
Triangle Pattern in Oil Futures
Does anyone else notice this short term triangle pattern on oil futures?
I will be watching for when it breaks one way or another but I am not that great at understanding oil movements.
If you have any insights, please share
Trade ideas
Elliott Wave - still in corrective Intermediate W(4).Should see some more range bound movement before WTI makes final W(5) down into the $40's..is my guess. Look for longer term short entries above 62.60 Let's see how it plays out. All of this since March 2022 high of $130 is a supercycle wave A.
Sexy 60 - Daily - 1 st chart is 987m tf 6 pm - 10:27 NY candles. Here's a new daily - watching the dance either side of 60 she's been testing the Big blue fib grain above to try for 61.25 + .382 -65.24 . Mama bear could drop to the blue mid mth Fib barn below 57.5 to .5 - 45.09 . It's showing an implied IHS bounce would be 3rd bovine EW big bull 65.24 option . 60 is the key imo .. algos rule with blue grain above as supply or deny . I'll post smaller tf's as she might dance . Good Luck -keep your stick on the ice.

Sexy 60 Here's a new daily - watching the dance either side of 60 she's been testing the Big blue fib grain above to try for 61.25 + .382 -65.24 . Mama bear could drop to the blue mid mth Fib barn below 57.5 to .5 - 45.09 . It's showing an implied IHS bounce would be 3rd bovine EW big bull 65.24 option . 60 is the key imo .. algos rule with blue grain above as supply or deny . I'll post smaller tf's as she might dance . Good Luck -keep your stick on the ice.

56.6This channel is not providing individualized trading or investment advice, nor is it a banking service, brokerage service, trading service, investment service or money management service

Crude OIL - trigger 63$Break of 63 $ area can give right push to the price to arrive untile 71/72 $ area
In this moment we have a H&S pattern but volume is above the price.
If price jump up to POC volume of the last period we can have a rally until next dinamic resistence area.


CRUDE OILPreferably suitable for scalping and accurate as long as you watch carefully the price action with the drawn areas.
With your likes and comments, you give me enough energy to provide the best analysis on an ongoing basis.
And if you needed any analysis that was not on the page, you can ask me with a comment or a personal message.
Enjoy Trading ;)

Crude Oil – Sell around 61.00, target 60.00-58.00Crude Oil Market Analysis:
Crude oil has rebounded, presenting another selling opportunity. We maintain our bearish outlook on crude oil. Today, you can sell directly at 61.00, or consider selling at 61.50. Regardless of the fluctuations, it's a sell opportunity. Crude oil volatility has been minimal in recent months, so patience is needed to enter the market. The overall trend for crude oil is unlikely to change.
Fundamental Analysis:
There are no major data releases today; all are routine data. The most important data this week is tomorrow's CPI, which has seen significant fluctuations over the past year.
Trading Recommendation:
Crude Oil – Sell around 61.00, target 60.00-58.00

Crude Oil 4H analysisBreakout confirmed above descending trendline. Monitoring retests around 60.90–60.50 for potential more long entries . Take-profit zones — 62.30 and 64.15.”
NOTE: it's not late to enter or early from 60.90&60.50🥰 confirm break and retest on LTf on the on those two levels

CRUDE OILWith your likes and comments, you give me enough energy to provide the best analysis on an ongoing basis.
And if you needed any analysis that was not on the page, you can ask me with a comment or a personal message.
Enjoy Trading ;)

CRUDE higher-low structure🛢️ CRUDE OIL – 4H CHART UPDATE
Price is testing the upper trendline resistance after forming a higher-low structure — signaling early bullish intent.
Technical Outlook:
• Multiple rejections near 5340–5360 now acting as breakout zone
• EMA 25 crossing above EMA 55 – momentum buildup
• RSI showing steady recovery from oversold levels
Setup to watch:
➡️ Bullish breakout above 5430 may open room toward 5520–5560
➡️ Rejection could trigger a retest near 5280–5320 before next move
Bias: Mildly bullish while price sustains above 5340
Short-term momentum building up — watch for breakout confirmation on volume!
This view/setup is for learning purpose only!

CRUDE OILPreferably suitable for scalping and accurate as long as you watch carefully the price action with the drawn areas.
With your likes and comments, you give me enough energy to provide the best analysis on an ongoing basis.
And if you needed any analysis that was not on the page, you can ask me with a comment or a personal message.
Enjoy Trading ;)

Crude Oil – Sell around 61.50, target 58.00-56.00Crude Oil Market Analysis:
Crude oil has recently started to decline on the daily chart, with a larger drop than before. Previously, the declines were smaller, but recently the fall has accelerated. Sell on any rebounds. Pay attention to the resistance around 61.40. The daily moving averages are starting to diverge. A break below 55 would trigger a major daily downtrend. Currently, the market is experiencing a volatile decline.
Fundamental Analysis:
Recent comments from Federal Reserve officials have signaled continued interest rate cuts. It is expected that the rapid easing policy will continue, which will support further buying and upward movement in gold.
Trading Recommendation:
Crude Oil – Sell around 61.50, target 58.00-56.00

Crude Oil - trigger zone and trade set upIn this idea setup for next Crude Oil strategy
If price break trigger zone we can have a push action until 63$ zone where we find a great resistence area. This is first target, only after break of this area we can have a final long wave until 72$
Support under bottom zone

reaction to 61.8 Waiting to buy off a bounce from 61.8. Likelihood to bounce from 61.8 as a key Fibonacci level is my thought process. Plus history observation of how many times it has reacted to the level on higher time-frame 1 D and H 4

Crude Oil MCX Future - Intraday Technical Analysis - 10 Nov., 25$MCX:CRUDEOIL — Chart Pathik Intraday Insights | 10-Nov-25
(If these levels have worked for you, a quick boost or comment is a small gesture that keeps these posts flowing and the community lively!)
Crude Oil
is consolidating at 5,309, rotating around the zero line (5,295) after several intraday swings and sharp reversals from weekly lows. Each comment or share helps keep this analysis robust and the trading community engaged!
Bullish Structure:
Long setups get traction above 5,329, with further confirmation on closes above swing resistance.
Targets: 5,353 (primary booking zone), 5,389 (stretch target on breakout)
Control: Stops favored near 5,318, or trail at zero line for risk management
Bearish Structure:
Shorts activate below 5,307, especially if price fails to sustain above the add-long (5,318) or zero line.
Targets: 5,237 (partial/scalp), 5,201 (extended move)
Control: Shorts should cover fast on reversals beyond long entry or breakout pivots
Neutral Zone:
5,295 is the tactical equilibrium — stay nimble until a decisive close establishes the next move.
These setups deliver method, structure, and clarity for disciplined decisions in rapidly shifting markets.
If you find value in these posts, a quick engagement below shows you’re part of this learning journey—don’t be a silent reader, help Chart Pathik reach more traders!

"Long-Term Long" GL1"Since the macro bias (1W) is bullish 1W confirms this (forming a Higher Low), my most likely scenario is a "Long-Term Long".
Then, as you absolutely correctly identified, the "fuel" for this move is "many unbroken local highs". The market will act like a magnet to these 'Internal BSL' (Buy-Side Liquidity) zones, one after the other, with the ultimate "long-term target" at the 'External BSL'."
This is not investment advice!!! Keep your risks low!!! Happy trading!

OIL BIG FALLPreferably suitable for scalping and accurate as long as you watch carefully the price action with the drawn areas.
With your likes and comments, you give me enough energy to provide the best analysis on an ongoing basis.
And if you needed any analysis that was not on the page, you can ask me with a comment or a personal message.
Enjoy Trading ;)

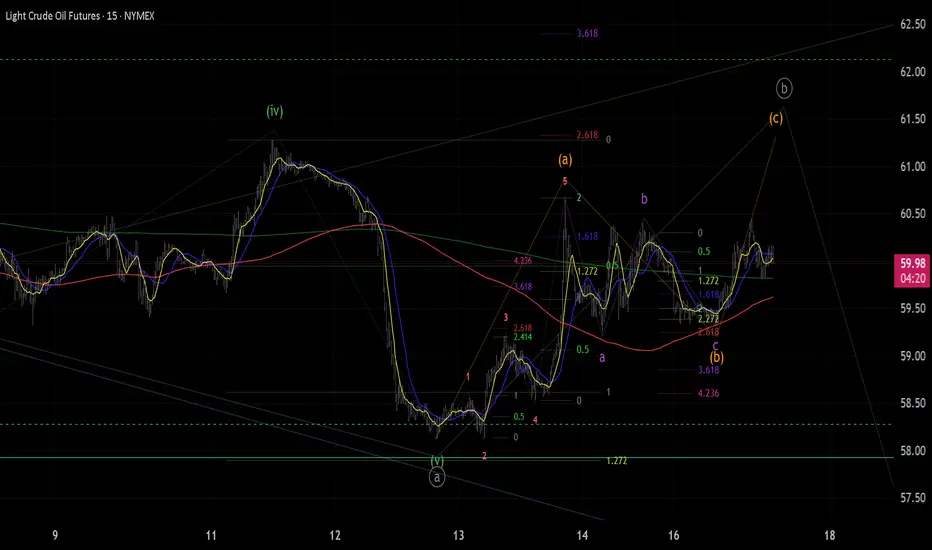
From Bounce to Barrier: Oil Path to the Next Sell ZoneThe short term price action in OIL suggests that the decline from 23rd June 2025 peak ended in 3 waves structure. Up from there, it has made a 5 waves bounce from the lows therefore we suspect that it can be correcting that cycle in simple zigzag correction into the path to the next sell zone.
In which, the decline from $56.29 low has completed wave (W) of the decline from 6.23.2025 peak. Up from there, the bounce unfolded in 5 waves impulse sequence where wave ((i)) ended at $58.27 high. Wave ((ii)) pullback ended at 56.99 low, wave ((iii)) rallied towards $62.20 and wave ((iv)) ended at $61.21 low. Then a new high towards $62.59 high ended wave ((v)) thus completed wave A of a zigzag correction.
Down from there, OIL is correcting the cycle from 10.20.2025 low in wave B pullback. The internals of this ongoing pullback is taking place as double three correction where wave ((w)) ended in lesser degree 3 waves at $59.70 low. Then another 3 wave bounce ended wave ((x)) at $61.50 high. Since than, wave ((y)) is unfolding in another 3 waves. But it can reach $58.61- $56.82 area lower first before starting the C leg higher.

Crude Oil – Sell around 61.00, target 60.00-58.00Crude Oil Market Analysis:
Continue to sell on rallies, as the market is bearish. Sell on any rebounds. The daily chart shows a downward trend, with buying pressure failing. Continue selling on today's rebounds. The crude oil inventory data hasn't changed the overall trend. Short-term fluctuations are expected, but the long-term trend remains bearish. The strategy is relatively simple: continue selling. The new major resistance level for crude oil is around 62.00.
Fundamental Analysis:
Today's NFP employment data will change market expectations for the Federal Reserve's monetary policy. However, in the long term, the possibility of further interest rate cuts is greater.
Trading Recommendation:
Crude Oil – Sell around 61.00, target 60.00-58.00.

crude oil probable price movement1. price looks strong may go up
2. if price doesnt sustain higher levels may go down

Crude Oil ROAD TO 80!The technical outlook for Crude Oil (WTI) has shifted to a bullish bias following a key rejection at a significant resistance level. The subsequent price action has formed a robust ascending channel, indicating sustained buying pressure and a lack of significant sell-offs. The convergence of this channel with a promising ABCD harmonic pattern suggests a potential long-term bullish trend is developing, with a projected target zone near $80.00.
Detailed Pattern Analysis
The analysis begins on Wednesday, 9th April, where the price encountered a clear and defined resistance level on the daily chart. This level represented a point where sellers had previously overwhelmed buyers. However, the market's reaction was notably bullish.
Instead of reversing into a downtrend, the price action following the rejection formed a well-defined ascending channel. This pattern is characterized by a series of higher highs and higher lows, contained within two upward-sloping parallel trendlines. It demonstrates consistent and structured buying interest, with each dip being bought at a progressively higher price.
The observation of "no sign of a drop" is critical. It indicates that the corrections within the channel are shallow and orderly, lacking the aggressive selling volume that would typically signal a reversal. This reinforces the strength of the underlying bullish momentum and supports the thesis for a sustained "long bull run."
The ABCD Pattern: The note that "the ABCD looks promising" refers to a common and reliable harmonic pattern. This pattern suggests that the initial impulsive leg (A to B) is often equal to the subsequent leg (C to D). The completion of this pattern within the context of the broader ascending channel adds significant confluence to the bullish forecast.
Trigger and Target:
Bullish Trigger: A confirmed break and daily close above the $72.50 level is identified as the key catalyst. This level likely represents the recent high or the upper boundary of the initial consolidation. A breakout here would confirm buyer conviction and open the path for the next leg higher.
Long-Term Target: Based on the measured move of the ascending channel and the projected completion point (D point) of the ABCD pattern, the primary profit target is set around $80.00. This represents a significant technical and psychological resistance zone where the pattern would be considered mature.
Conclusion:
In summary, Crude Oil (WTI) presents a compelling bullish setup on the daily timeframe. The combination of a breakout above key resistance, a steady ascent within a defined channel, and a converging harmonic pattern all point towards a continued upward move. The strategy is to enter on a confirmed breakout above $72.50, targeting the $80.00 area, while strictly managing risk with a stop-loss placed below the channel support. This disciplined approach allows for participation in the potential bull run while rigorously protecting capital.
