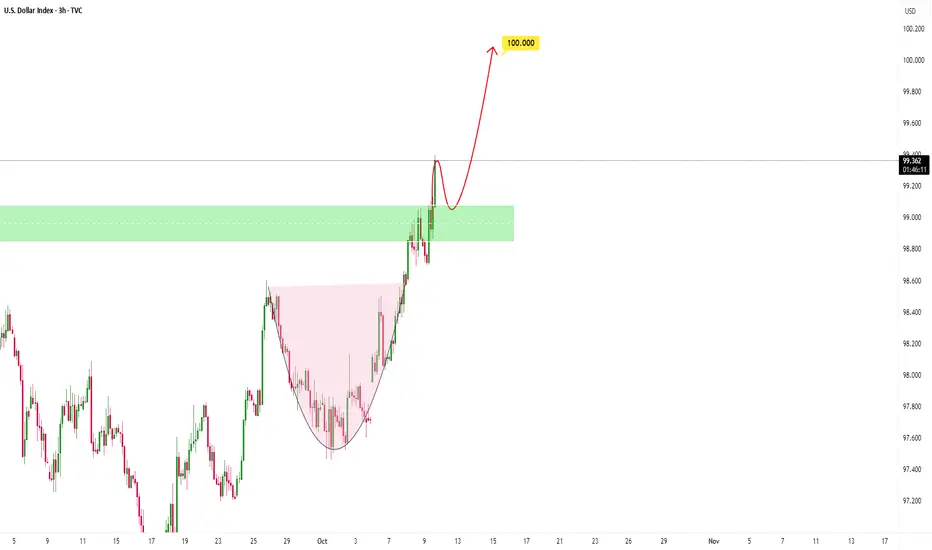
DXY could continue higherPrice has been in a bullish phase, forming a continuation setup showing buyers steadily gaining control after consolidation. The rounded base reflects accumulation, where buyers absorbed selling pressure and built momentum for a breakout.
If buyers manage to hold above the breakout zone, that would
Related indices
10.10.25 Morning ForecastPairs on Watch -
FX:EURCAD
OANDA:XPTUSD
FX:CADJPY
A short overview of the instruments I am looking at for today, multi-timeframe analysis down to what I will be looking at for an entry. Enjoy!

DXY Analysis – Bullish Structure Still IntactIn my latest DXY analysis, I mentioned that the 100.00 level remains the next key target for the U.S. Dollar Index.
After an initial push higher to 99.55, the index faced some selling pressure and is now trading slightly below 99.00.
However, the constructive bullish structure remains intact as long

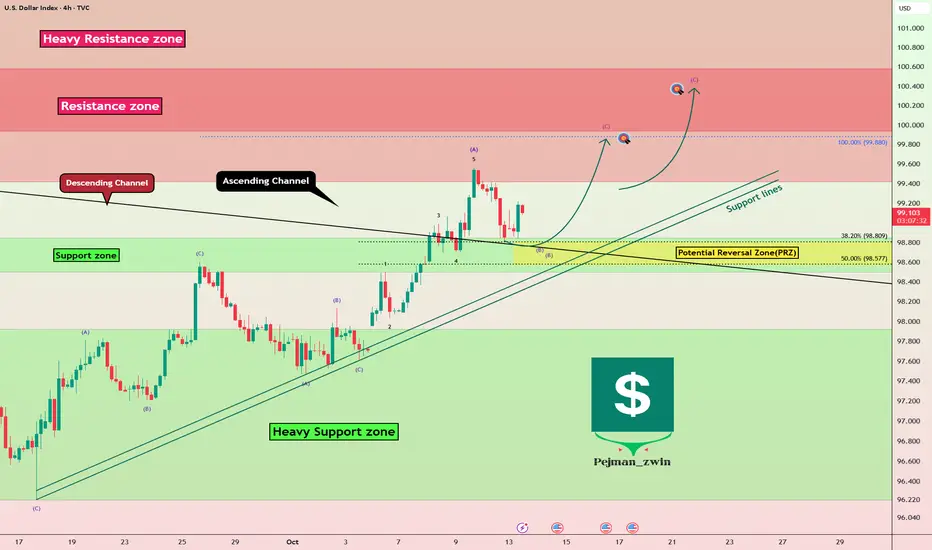
DXY index Near Resistance – Will Powell Trigger the Next Move?To kick off this week, let's take a quick look at the upcoming key indexes in the economic calendar before diving into the DXY analysis ( TVC:DXY ).
On Tuesday, we have Fed Chair Powell speaking, which could stir some excitement in the DXY index and ripple through correlated financial marke
15.10.25 Morning ForecastPairs on Watch -
FX:EURUSD
FX:GBPUSD
FX:AUDUSD
A short overview of the instruments I am looking at for today, multi-timeframe analysis down to what I will be looking at for an entry. Enjoy!

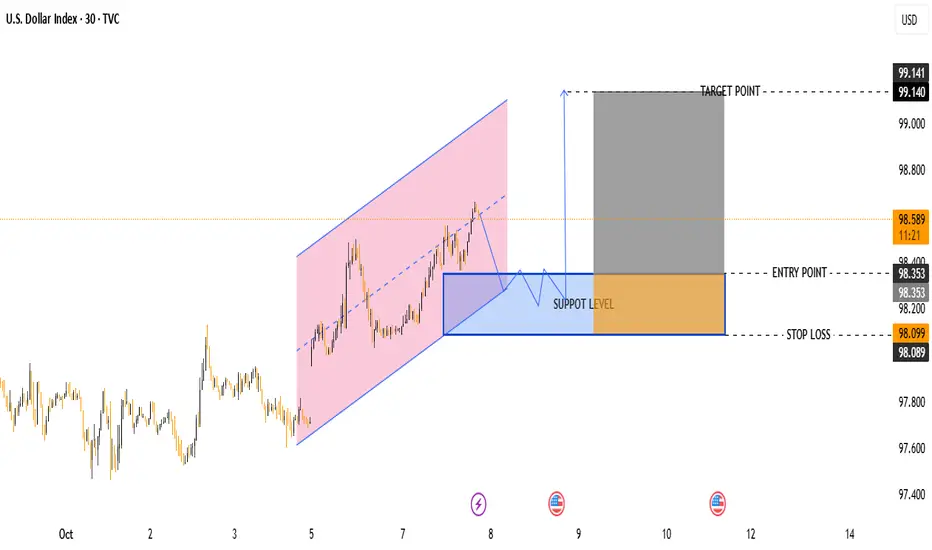
DXY Buy Opportunity – Support Retest Before Next Leg UpPair: U.S. Dollar Index (DXY)
Timeframe: 30 minutes
Current Price: 98.602
Trend: Short-term bullish channel (highlighted in pink)
🧭 Key Levels
Support Zone: 98.100 – 98.350
Entry Point: 98.353 (buy zone confirmation)
Stop Loss: 98.099 (below support)
Target Point: 99.140
📊 Market Structure
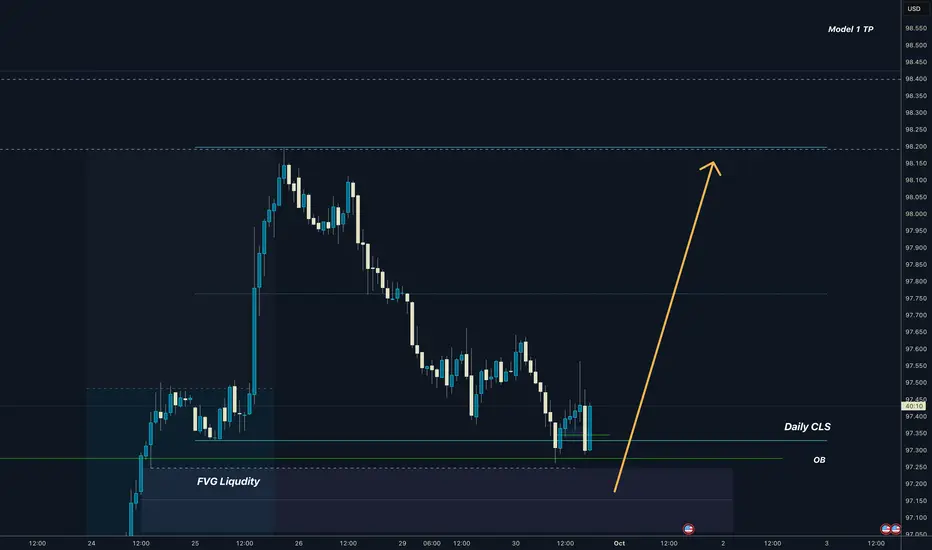
Dollar I Daily CLS I Manipulation I Bullish HTFDollar just manipulated Daily CLS range while HTF bias is nicely bullish
Im still open to the dip to FVG before it goes higher
Big picture view
Adapt useful , Reject useless add what is specifically your own.
Trade safely
Dave
16.10.25 Morning ForecastPairs on Watch -
FX:EURUSD
FX:GBPUSD
FX:GBPCAD
A short overview of the instruments I am looking at for today, multi-timeframe analysis down to what I will be looking at for an entry. Enjoy!

US Dollar: Bullish! The Pullback To Support Is An Opportunity!Welcome back to the Weekly Forex Forecast for the week of Oct 13 - 17th.
In this video, we will analyze the following FX market: USD Dollar
The USD was bullish all of last week, except for Friday. Pres. Trump announced China tariffs and the market dumped. For me, this is a market knee jerk reac

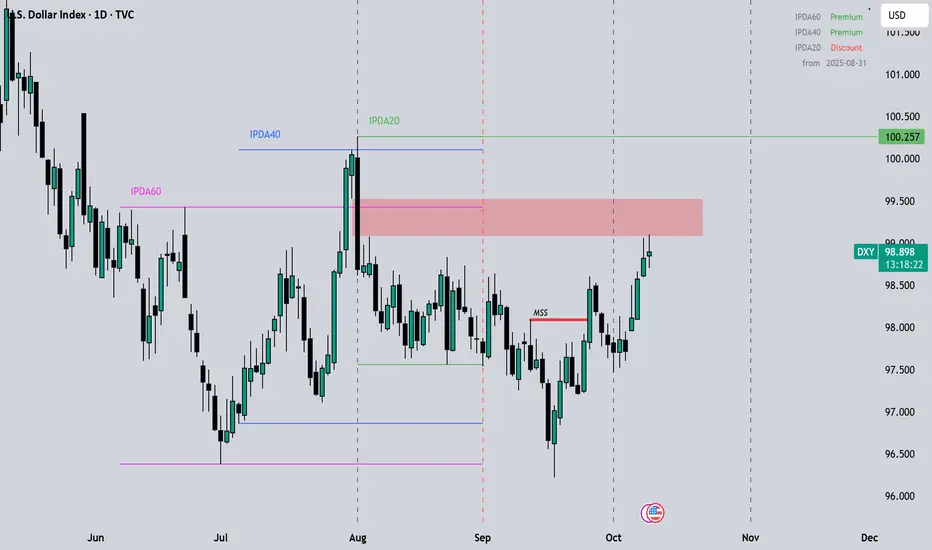
Dollar Index HTF BiasBased on the most recent Market Structure Shift, Quarterly Shift, using ICTs' IPDA 20-40-60 Lookback and Cast Forward.
I am expecting a DXY reaching 100.257 within this month, with a Daily SIBI getting ran through quite easily.
See all ideas
Summarizing what the indicators are suggesting.
Oscillators
Neutral
SellBuy
Strong sellStrong buy
Strong sellSellNeutralBuyStrong buy
Oscillators
Neutral
SellBuy
Strong sellStrong buy
Strong sellSellNeutralBuyStrong buy
Summary
Neutral
SellBuy
Strong sellStrong buy
Strong sellSellNeutralBuyStrong buy
Summary
Neutral
SellBuy
Strong sellStrong buy
Strong sellSellNeutralBuyStrong buy
Summary
Neutral
SellBuy
Strong sellStrong buy
Strong sellSellNeutralBuyStrong buy
Moving Averages
Neutral
SellBuy
Strong sellStrong buy
Strong sellSellNeutralBuyStrong buy
Moving Averages
Neutral
SellBuy
Strong sellStrong buy
Strong sellSellNeutralBuyStrong buy
Displays a symbol's price movements over previous years to identify recurring trends.
Frequently Asked Questions
The current value of U.S. Dollar Currency Index is 98.587 USD — it has fallen by −0.29% in the past 24 hours. Track the index more closely on the U.S. Dollar Currency Index chart.
U.S. Dollar Currency Index reached its highest quote on Nov 8, 1985 — 129.670 USD. See more data on the U.S. Dollar Currency Index chart.
The lowest ever quote of U.S. Dollar Currency Index is 70.698 USD. It was reached on Mar 17, 2008. See more data on the U.S. Dollar Currency Index chart.
U.S. Dollar Currency Index value has increased by 0.14% in the past week, since last month it has shown a 1.15% increase, and over the year it's decreased by −4.52%. Keep track of all changes on the U.S. Dollar Currency Index chart.
U.S. Dollar Currency Index is just a number that lets you track performance of the instruments comprising the index, so you can't invest in it directly. But you can buy U.S. Dollar Currency Index futures or funds or invest in its components.