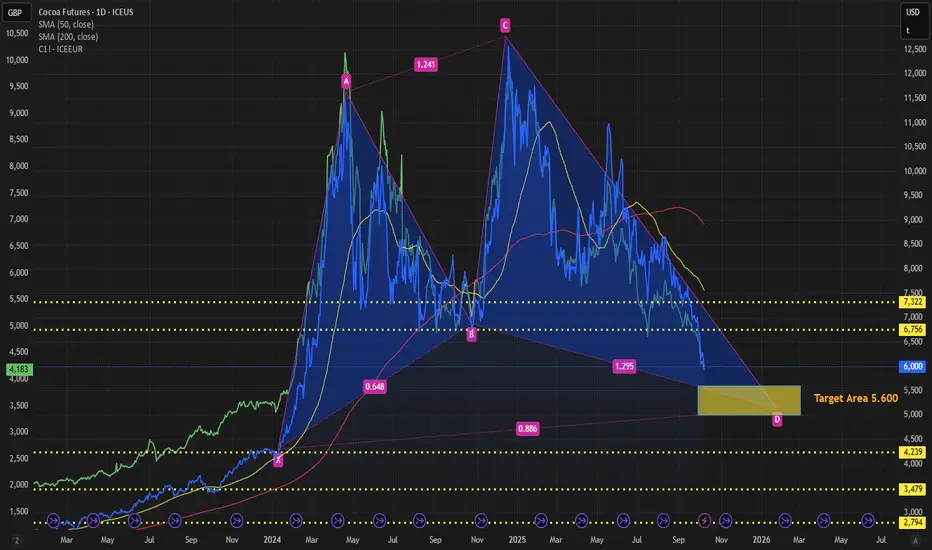
COCOA Idea 23.11.The market and cocoa are currently at the level where I would like to take a possible long trade in SFP below the current value low at the level of 5377. If the market were to go lower, I see a level of around 4000.
Cocoa Futures
No trades
Trade ideas

COCOA FUTURES |Long Setup | El Niño Aftershock | Nov 7, 2025COCOA FUTURES (CC1!) | Long Setup | Seasonal Tightness, El Niño Aftershock, Channel Base Retest | Nov 7, 2025
🔹 Thesis Summary
Cocoa sits at the lower rail of a multi-year rising channel while global stocks remain tight after 2024–25 weather shocks. Seasonality turns constructive into Q4–Q1, and the forward curve is flat to mildly contango, which limits negative carry. I’m looking for a trend resumption long with defined risk.
🔹 Trade Setup
Bias: Long
Entry Zone: 5,950–6,150 (current ~6,090)
Stop Loss: 5,770 invalidation below channel base
Take-Profits:
• TP1 8,500, prior consolidation and mid-channel
• TP2 10,200–10,300, upper midline confluence
• TP3 12,500, late-2023 supply shelf
• Max Target 17,600–18,000, channel top if squeeze extends
🔹 Narrative & Context
Structure: Price tested the channel base and printed a higher low versus the October flush. Visible range shows heavy volume nodes above 7,500 and 9,000 that can act as magnets if momentum returns.
Seasonality: Q4–Q1 tends to firm on main-crop uncertainty, then volatility fades into Apr–Jun. The 2024 seasonal outlier underscores how weather and positioning can drive multi-month trends.
Term structure: Forward curve is broadly flat to mild contango into mid-2026, then softens into 2027 before lifting again. That keeps roll drag manageable for futures or NIB exposure during a hold through Q1.
Supply/Demand: Côte d’Ivoire and Ghana still face yield recovery risk following El Niño and disease pressure. Grind data in Europe and the US remains the clean demand proxy to watch.
Risk management frame: We’re long against a clear structural level. If the base breaks, the thesis is wrong, step aside and re-assess near 5,400–5,500.
🔹 Valuation & Context (Pro Metrics, Framed Simply)
Commodity analogs to “valuation” guide risk here.
• Carry/Term Structure = Mild contango vs prior backwardation → Limited roll cost vs 2024’s squeeze regime → Favorable to maintain long through Q1 → Supports swing hold into seasonal strength.
• Inventory-to-Use = Below historical norms → Tight coverage means weather headlines move price faster → Justifies paying a small carry to hold exposure → Aligns with momentum targets.
• Volatility Regime = Elevated but compressing vs spring 2025 → Option pricing still rich, but realized is moderating → Spreads or staged entries reduce slippage → Fits scale-in plan at 5,950–6,150.
• Producer Hedging Activity = High vs average → More fuel for upside if hedges are reduced into rallies → Adds asymmetry toward TP2 on squeezes.
🔹 Contrarian Angle (Your Edge)
Consensus expects normalization through 2026. Yet structure is holding, curve isn’t rewarding shorts, and weather normalization isn’t assured. If mid-channel clears with volume, a path to 12.5k then 17k is open while many remain under-positioned after the 2025 washout.
🔹 Risks
• Seasonal air-pocket in Apr–Jun if main-crop shipments exceed expectations.
• Policy or logistics relief in West Africa that boosts exports.
• Dollar strength or broad commodity de-risking compressing risk premia.
🔹 Macro Considerations
• Dollar and global liquidity swings affect softs beta.
• If energy softens, cost pressures on processing ease, which can help grinds but may reduce inflation hedging flows.
• Monitor BTC/NQ risk tone for cross-asset VAR effects. A volatility spike can unwind commodity longs short-term.
🔹 Bottom Line
This is a defined-risk long from structure plus seasonality with acceptable carry. Above 7,500 the tape can accelerate, with 8,500 and 10,200 the first objective levels. Break 5,770 and we’re out clean.
🔹 Forward Path
If this gathers interest I’ll post the weekly map with updated mid-channel pivots, plus a term-structure and grind-report tracker. Comment if you want the seasonal backtest or a coffee/sugar correlation pair overlay.
Like & Follow for structured ideas, not signals. I post high-conviction setups here before broader narratives play out.
⚠️ Disclaimer: This is not financial advice. Do your own research. Charts may include AI-enhanced visuals.
🔹 Footnote
Forward P/E: Price divided by expected earnings over the next 12 months. Lower = cheaper relative to profits.
P/FCF (Price-to-Free-Cash-Flow): Price vs. the cash left after investments. A measure of efficiency.
FCF Yield: Free cash flow per share ÷ price per share. Higher = more cash returned for each dollar invested.
ROE (Return on Equity): Net income ÷ shareholder equity. Shows management efficiency with investor capital.
ROIC (Return on Invested Capital): Net income ÷ all invested capital (equity + debt). A purer profitability gauge.
Debt/Equity: Debt divided by equity. <1 usually means balance sheet is conservative.
R:R (Risk-to-Reward): Ratio of expected upside vs. downside. 3:1 = you risk $1 to make $3.

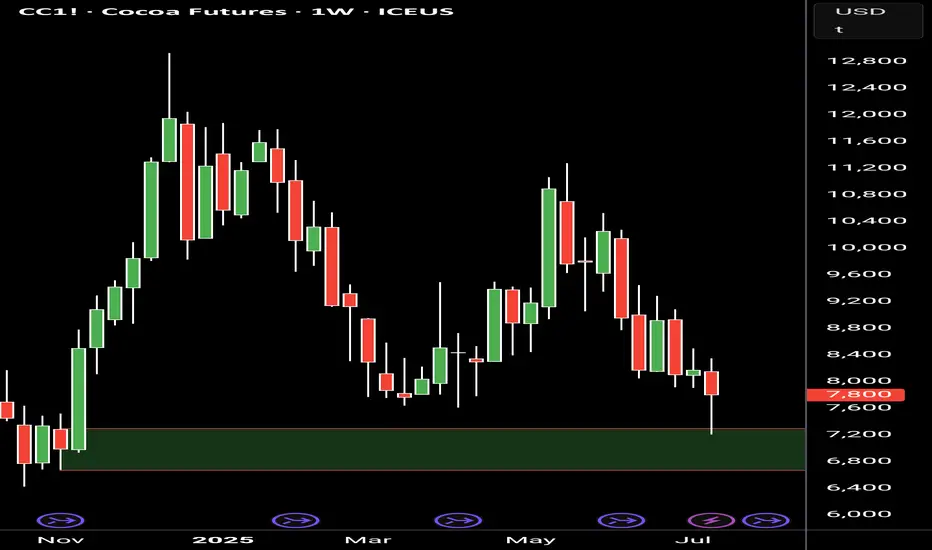
Cocoa Crash: From $12,000 to $6,000 — Over 50% Drop in 2025After hitting record highs above $12,000 per ton in April 2024, cocoa futures ( NYSE:CC ) have plunged more than 53%, now trading near $6,000.
The selloff comes as supply pressures ease in West Africa, speculative longs unwind, and better weather improves harvest outlooks.
Still, chocolate prices haven’t followed — showing how slow consumer prices react even when raw materials collapse.
#Cocoa #Commodities #Futures #Inflation #Deflation #Softs #OrbisInvestment

23.10.25 Cocoa Weekly buyWeekly
Cocoa reacted from a previous demand zone (Rally-Base-Rally, wider version) and it looks like it may be forming a Drop-Base-Rally pattern. This will be confirmed or invalidated with the close of this week.
At the moment, there is no clear trend, as there is still no confirmation according to my rules. Cocoa has mostly been moving sideways.
The existing risk is that we may be starting a breakout into a downtrend, since we already have one high with a lower high and one low with a lower low. However, we still need one more lower high and one more lower low to confirm a new downtrend.
Daily
A Drop-Base-Rally has formed with an explosive daily candle, which for me indicates the creation of a new demand zone inside a not-yet-confirmed weekly demand zone. My strategy is to set a buy limit order and go long.
I would prefer to see the buy limit triggered before price reaches the supply zone, because if it reacts from my weekly supply, there is a risk of confirming the downtrend.
Cocoa Futures (CC1!)Cocoa prices in New York are down over -50% from their all-time high in 2024 (Blue Line); but London prices have declined -58% from their April 2024 peak (Green Line), to $4,262, the lowest in 20 months. New York prices are still above the 20-year average of ~$2,700 per ton. What's driving the London-New York price split? Geographic arbitrage on cocoa futures feels like it's telling us something about supply chain fragmentation nobody's pricing in yet. Supply shocks, weather swings, and speculative bets turning it into a wild ride.
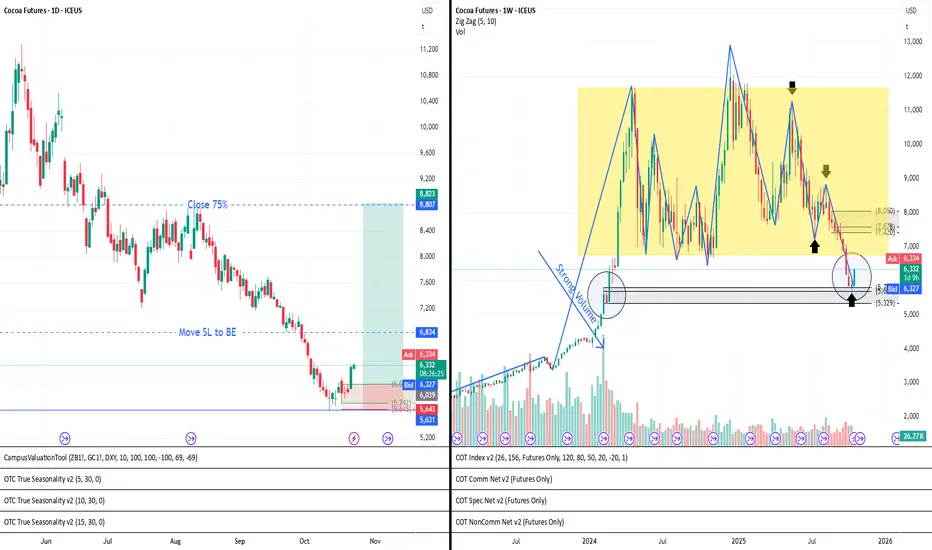
Cocoa ICEUS - Support (5,950-6,250) | Multi-Confluence AnalysisCocoa Seasonal Confluence Zone – Q4 Outlook
This is a multi-confluence analysis of cocoa futures, combining seasonal patterns, structural levels and institutional positioning zones .
All key levels and insights are annotated directly on the charts for clarity and quick visual reference.
Seasonality & Timing:
Cocoa is historically a seasonal asset, with long-term buy opportunities often emerging between October and December.
With only a limited window before the next quarterly cycle, there is a high probability of accumulation developing this month or next.
Data Integrity Note:
The ICEUS feed provides the most authoritative and historically complete data for cocoa futures, with records extending back to 1980 .
This deep data history ensures that the monthly EMAs, pivot levels, and seasonal statistics are calculated on a continuous, reliable series.
To illustrate the impact of data history, this post includes three charts:
• ICEUS (main reference) – full historical feed since 1980, used for all structural levels (EMA-50, pivots, seasonal stats).
• Pepperstone – history begins in 2015; shorter look-back affects EMA-50 and pivot alignment but offers a good execution-side view.
• FP Markets – history begins in 2022; good for broker-specific volume but not reliable for long-term structural calculations .
This comparison also highlights how truncated feeds can distort long-term indicators.
For accuracy in technical structure, ICEUS is treated as the benchmark, while Pepperstone and FP Markets are included for context and liquidity considerations and also show how the levels are aligning.
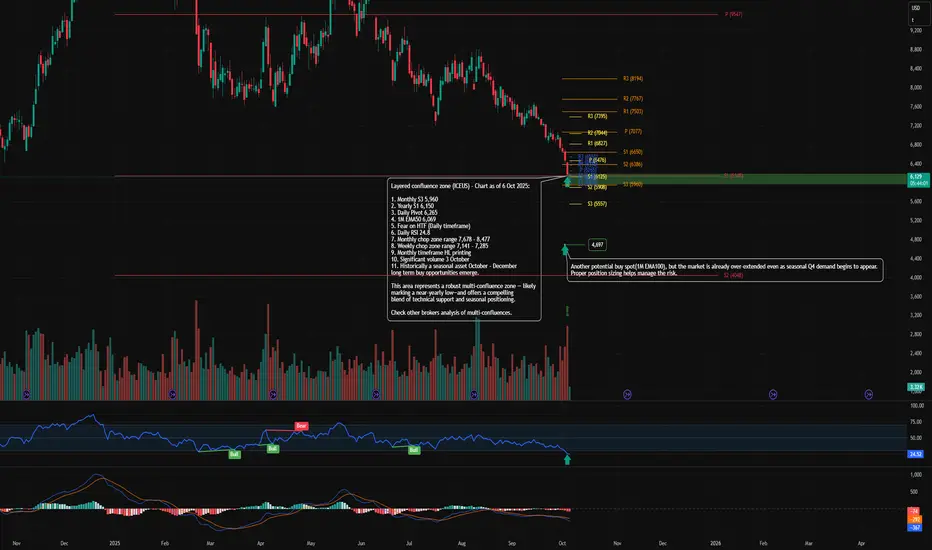
Key Confluence Zone (ICEUS):
Price has recently tapped 1M EMA-50 at 6,069 , aligned with yearly S1 at 6,150, daily S3 at 6,089 , and is approaching monthly S3 near 5,960.
This cluster forms a robust multi-confluence zone — likely near a yearly low — offering a compelling blend of technical support and seasonal positioning.
Institutional Positioning Outlook:
Cocoa typically attracts institutional accumulation in Q4 driven by seasonal demand and hedging flows ahead of the holiday chocolate season.
The layered support region around 5,950 – 6,250 coincides with historical areas where managed-money net-long positions tend to build.
This confluence of technical structure, seasonal demand, and historical positioning patterns suggests that larger participants may start scaling in over the coming quarter.
Trade Consideration:
Given the time-sensitive seasonal setup and layered technical structure, cocoa currently presents a high-probability observation zone with an attractive risk-to-reward profile.
This is not a buy or sell signal. It highlights a high-probability zone where multiple confluences align, useful for observation and study.
⚠️ Risk Note:
It is recommended not to overleverage your positions. Overexposure is the main killer of portfolios. Position sizing directly impacts mental clarity: excessive size can cloud judgment and trigger emotional reactions , while appropriate sizing supports composure and disciplined execution. It is better to collect steady breadcrumbs than to risk giving away your capital. Trading risk can be managed but never eliminated.
❗️Disclaimer:
This content is provided for educational purposes only. It does not constitute financial, legal, tax, or investment advice. The author does not provide trading signals, portfolio management, or any services regulated by the Financial Conduct Authority.
Note: The full analysis was conducted using the author’s private custom indicators.
In accordance with TradingView’s publishing rules, those indicators are not displayed on these charts. All key levels and conclusions derived from them have been manually highlighted for educational purposes.
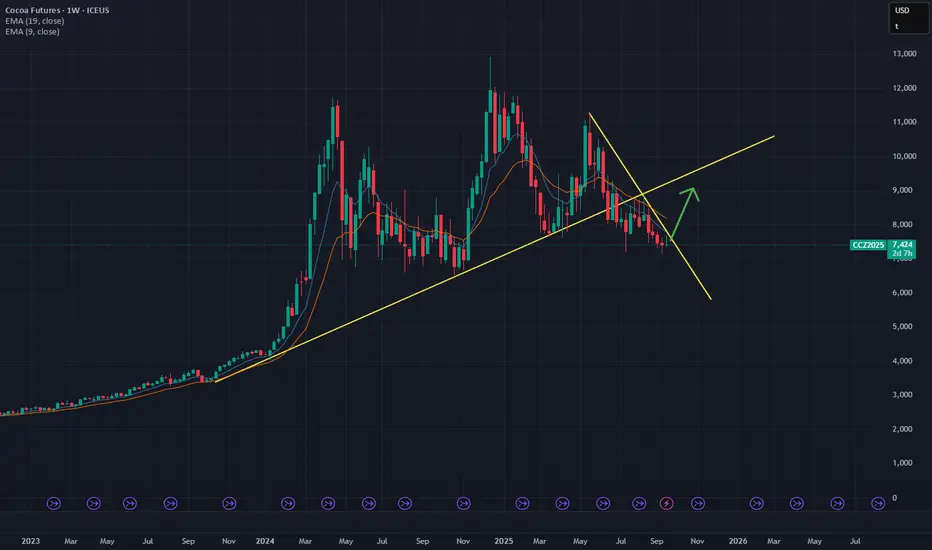
Cocoa Futures (ICE) – Long Trade Setup🍫 Cocoa Futures (ICE) – Long Trade Setup
Direction: Long Bias
Contract: Cocoa (NY / ICE)
Current Price: ~7,437
🔍 Technical Setup
Price has been consolidating after the sharp run-up and has now pulled back into a key long-term trendline (yellow support).
A downtrend channel breakout is forming – if price clears this, it opens the door to a relief rally.
I’m looking for price to push back toward the 8,500–9,000 zone as a first target (previous structure resistance).
EMA cross (9 vs 19) is flattening, signaling potential shift in momentum.
📊 COT & Sentiment
Speculators remain net long in cocoa, reflecting continued bullish sentiment.
Commercials (hedgers) are still short, but that’s typical for producers – nothing extreme.
Fundamentals remain tight:
Black pod disease in Cameroon hitting yields.
Stockpiles in London/NY at multi-year lows.
Consumer demand holding up despite high prices.
This alignment supports a bullish recovery if technicals confirm.
🎯 Trade Plan
Entry: Current levels around 7,400–7,500, scaling in on confirmation.
Target 1: 8,500 (previous resistance zone).
Target 2: 9,000+ if momentum extends.
Stop Loss: Below 7,000 to protect against breakdown.
Risk/Reward: ~1:2 setup.
⚠️ Risks
Stronger-than-expected supply recovery in Ivory Coast/Ghana.
Weak grind demand data (sign of demand destruction).
Speculators cutting long positions aggressively.
✅ Conclusion
Cocoa has pulled back into long-term support, with positioning and fundamentals still supportive of higher prices. If the descending trendline breaks, I’m positioning for a long swing toward 8,500–9,000.
This cocoa strategy has a profitability rate of 66% and average 9.4% gain on a long position.
Long Chocolate📌 Cocoa Futures: Seasonality, Trading Strategies & Market Drivers
Cocoa is more than just the foundation of chocolate; it’s a soft commodity with centuries of economic significance. Once used as currency by ancient civilizations in Central and South America, cocoa became a global commodity after the Spanish conquest introduced it to Europe. Today, it underpins a multibillion-dollar industry that spans confectionery, beverages, cosmetics, and pharmaceuticals.
Cocoa futures, traded on the ICE (Intercontinental Exchange), give traders and institutions exposure to this volatile market. These contracts are a critical tool for producers, exporters, chocolate manufacturers, and speculative traders. Because cocoa is grown almost exclusively in tropical regions—with over 70% of global supply coming from West Africa—it is highly vulnerable to weather, political instability, and labor disruptions, making it one of the most volatile agricultural commodities.
For traders, this volatility is both a challenge and an opportunity. With the right combination of technical setups, seasonal awareness, and macro fundamentals, cocoa futures can be a powerful addition to a diversified trading strategy.
🔹 1. A Simple but Effective Cocoa Futures Strategy (RSI + EMA Model)
One robust short-term trading framework for cocoa is built on two components: momentum (measured by the Relative Strength Index) and trend direction (measured by the 100-day Exponential Moving Average).
📌 Trading Rules:
Buy Signal (enter next day open): When the 3-day RSI falls below 20 (oversold) and the close remains above the 100-day EMA.
Short Signal (enter next day open): When the 3-day RSI rises above 80 (overbought) and the close is below the 100-day EMA.
Risk/Reward (RR): Set at 2:1 for favorable risk exposure. I use Heikin-Ashi.
Historical Win Rate: Approximately 70%, meaning the system has shown consistent profitability in backtests.
📌 Why it works:
The RSI ensures entries are taken when the market is temporarily stretched.
The EMA filter avoids fighting against the broader trend, reducing false signals.
Cocoa, being highly mean-reverting, often corrects after extreme RSI conditions, especially when aligned with the prevailing long-term trend.
This makes the system simple enough for beginners yet effective for experienced futures traders looking for structured rules.
🔹 2. Seasonality in Cocoa Futures
In commodity trading, seasonality refers to recurring price tendencies tied to the calendar—harvests, weather cycles, or consumption trends. Cocoa has one of the clearest seasonal footprints in the soft commodity sector.
📈 Summer Months (June – September): Historically the strongest period for cocoa. Demand from chocolate manufacturers builds as companies secure supply ahead of year-end holidays. Weather risk in West Africa also coincides with the rainy season, which can create uncertainty about crop quality and yields.
📉 Winter Months (December – February): Often weaker as fresh harvest supplies enter the market. Prices may dip unless weather shocks disrupt output.
📌 Historical Example:
Between June and September 2020, cocoa futures rallied over 20% due to concerns about rainfall and labor issues in the Ivory Coast, even though global demand was still recovering from pandemic restrictions.
Thus, traders often rotate into cocoa longs during the summer months, much like how they rotate into corn or soybean trades during North American planting/harvest cycles.
🔹 3. Key Drivers of Cocoa Prices
Cocoa is especially sensitive to supply shocks because of its geographic concentration. A few core variables explain most of the large price swings:
1️⃣ Weather Conditions
Cocoa pods are delicate and require the right mix of rainfall and sunshine.
Too much rain → fungal outbreaks like Black Pod disease.
Too little rain → drought stress, smaller pods, and lower yields.
West Africa’s climate variability is the single largest driver of year-to-year volatility.
2️⃣ Labor Issues
Ivory Coast and Ghana rely heavily on manual labor for cocoa harvesting.
Strikes, disputes over wages, or child labor controversies can quickly cut output.
Supply disruptions ripple globally since these two countries account for over two-thirds of global cocoa exports.
3️⃣ Political Risk
Elections, coups, or civil unrest in cocoa-producing regions can paralyze exports.
Example: The 2010 Ivory Coast political crisis disrupted shipping, pushing cocoa futures to multi-decade highs.
4️⃣ Crop Diseases
Cocoa plants are vulnerable to pests and diseases.
The 2010 Black Pod outbreak alone wiped out 500,000 tonnes of cocoa.
The Cocoa Swollen Shoot Virus (CSSV) continues to be a structural threat.
5️⃣ Demand Shifts & Health Reports
Rising consumer demand for dark chocolate and functional foods (antioxidant-rich products) supports consumption growth.
Positive health studies on cocoa’s cardiovascular benefits can boost demand.
Conversely, economic downturns often weigh on chocolate consumption as it is seen as a semi-luxury item.
🔹 4. Seasonal Cocoa Trading Calendar
Month Key Events Typical Price Behavior Trade Implication
Jan–Feb Main crop exports Bearish pressure Avoid longs, look for shorts
Mar–Apr Mid-crop harvest Neutral to weak Cautious positioning
May–Jun Pre-summer build-up Bullish setup Early long entries
Jul–Sep Summer strength, weather risk Strongest seasonal rally Long futures, ETNs
Oct–Nov Rainy season risk Volatile Weather-driven trading
Dec Fresh harvest supply Often weak Take profits, rotate out
📌 Historical note: Cocoa’s June–September rally has persisted across multiple decades, making it one of the most reliable seasonal plays in the soft commodity space.
🔹 5. Vehicles for Trading Cocoa
Traders and investors can access cocoa in several ways:
Cocoa Futures (ICE: CC): Standardized contracts, physically delivered, high liquidity.
ETNs/ETFs:
NIB – iPath Bloomberg Cocoa Subindex ETN → easy exposure without futures account.
Chocolate & Confectionery Stocks:
Hershey (HSY), Mondelez (MDLZ), Nestlé (NESN.SW), Cheesecake (CAKE) → indirect exposure to cocoa demand.
Diversified Agricultural Funds: ETFs that include cocoa alongside coffee, sugar, and cotton.
📌 Conclusion: Best Cocoa Trading Strategy
Cocoa’s unique combination of ancient cultural roots, geographic concentration, and modern global demand makes it one of the most fascinating soft commodities to trade.
✅ Technical Edge: The RSI/EMA strategy offers a clear, rules-based approach with ~70% win rate.
✅ Seasonal Edge: Cocoa futures are strongest during summer (June–Sept).
✅ Macro Edge: Watch West African weather, labor strikes, and politics—they are the biggest price movers.
✅ Diversification Edge: Cocoa behaves differently than equities, metals, or energy, making it valuable for portfolio diversification.
While cocoa may not get the same attention as gold or crude oil, it remains a highly profitable niche market for traders who understand its seasonal flows and unique risks.

CACAO ShortCC is now net short on the regression break.
The roll on commodity = +2.2% in the short direction.
CC LongCC1! is now net long on the regression break.
The roll on this pair long is +9%.
I am considering this trade.

Cocoa long opportunityPossible long opportunity on cocoa as the price seems to be finding support at a weekly demand level.
A breach above the latest week's high is what i am looking for to enter longs
Cocoa Futures: CC1! Potential Pullback at Familiar Supply ZoneCocoa futures (CC1) are approaching a key demand zone previously tested in March 2025. This area, highlighted on the chart, presents a potential for a pullback, fueled by likely buy orders from commercial traders, as indicated by bullish sentiment evident in the latest Commitment of Traders (COT) report. We're watching for a reversal pattern within these highlighted zones, signaling a shift from the current upward trend. This anticipated pullback, driven by commercial market participation, could offer a compelling entry point for traders looking to capitalize on a potential reversal in the agricultural commodity.
✅ Please share your thoughts about CC1! in the comments section below and HIT LIKE if you appreciate my analysis. Don't forget to FOLLOW ME; you will help us a lot with this small contribution.

Cocoa $CC Evidence leans toward a bearish scenario due to the breakout below 9,200 and seasonal weakness in summer months. However, traders should remain open to bullish reversals, especially if institutional buying continues, and consider range-bound strategies if volatility stabilizes. Monitoring fundamental factors like weather in cocoa-producing regions and global demand trends will be crucial for a comprehensive strategy.

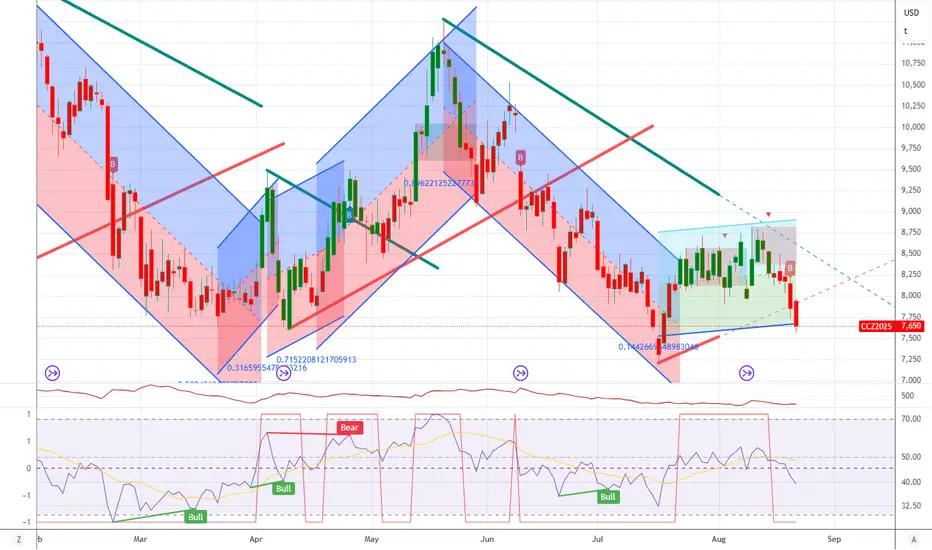
Cocoa Bounce From Demand – Can This Lead to a New 2025 High?On June 11th, price reacted sharply to a key demand block around the 8,880–9,000 zone, which aligns with:
Golden Pocket Fib (0.705–0.78) between 8,420 and 9,006
The midpoint of a previous consolidation range
A liquidity sweep followed by a strong bullish rejection
The RSI is showing a bullish divergence (lower lows on price vs rising RSI), which supports a possible technical rebound.
🟣 Immediate target: 10,400–10,600 (supply zone)
🔴 The bullish bias would be invalidated on a close below 8,850
📈 Commitments of Traders (COT) – as of June 3, 2025
Non-Commercials (speculators): still net long, but reduced their long exposure by -2,006 contracts, and trimmed shorts slightly as well
Commercials: remain heavily net short with over 61,000 contracts (61.4% of OI), indicating ongoing hedging by producers
Open Interest dropped by -1,257 → a sign of general position liquidation
➡️ The reduction in speculative longs likely reflects profit-taking after the May rally, but overall net positioning remains bullish on a medium-term view.
📅 Seasonality – June
On the 20, 15 and 10-year averages, June typically shows a moderately bullish rebound, often following weakness in May.
On the 5 and 2-year views, however, performance is more neutral to slightly negative.
Historically, June acts as a consolidation or pre-rally month, often preceding a stronger uptrend in July–August.
🧠 Operational Outlook
Bias: Moderately bullish in the short term, with potential recovery toward 10,400. Structure still shows signs of broader distribution, so caution remains in the medium term.
🎯 Trade idea:
Aggressive long initiated on the bounce from demand
First target: 10,400
Breakout extension: 11,200
Invalidation on daily close below 8,850

BULLISH CACOA Bullish on Cacoa with target at $13000. we may break this higher resistance with the durrent supply sortage on the market.

Cocoa Explosion Loading? Specs & Hedgers Agree🔍 Fundamental Analysis – Commitment of Traders (COT)
The latest COT report, dated May 13, 2025, reveals a strong bullish accumulation signal, with a significant increase in long positions across all major trader categories.
Specifically, Non-Commercials (speculative traders such as hedge funds and money managers) increased their long positions by +3,490 contracts while simultaneously reducing shorts by -467 contracts. This dynamic reflects renewed speculative confidence in the cocoa bullish trend.
Simultaneously, Commercials (typically producers and processors) added +5,187 long contracts and closed -661 short contracts. This is especially noteworthy, as commercials usually take the opposite side of speculators. Here, however, their alignment with speculators may indicate expectations of upcoming supply constraints or market stress.
Total open interest rose by more than +6,000 contracts, suggesting real capital inflow into the market rather than just rebalancing.
This alignment between speculators and institutional hedgers is rare and often precedes further price appreciation.
📈 Net Positions & Price Action
Looking at the “Net Positions & Prices” chart over the past year, it’s clear that Non-Commercial net positions are recovering after a notable drop in March and April. This reversal aligns with the technical bottom and the start of the current price rally.
Commercials, although still net short (in line with their historical bias), are reducing their bearish exposure, hinting at lower physical supply pressure or a need for hedging against further price increases.
Price action has reflected this narrative, surging higher following the April lows.
🕰️ Seasonal Analysis
Seasonality adds another layer to the analysis.
Historically, May tends to be flat or slightly bearish (10Y and 15Y averages), but the 2-Year seasonal line—which better reflects current market behavior—shows a strong bullish tendency starting mid-month. This supports the ongoing rebound and increases the likelihood of further upside in the short term.
Historical data also shows that June, while volatile, is often positive or neutral in shorter cycles.
📊 Technical Analysis
From a technical perspective, cocoa recently completed a strong bullish leg, rebounding from the 8,800–9,000 USD demand zone, identified as a clear area of institutional buying (evident through volume and impulsive candles).
The price then decisively broke through mid-range resistance levels and tested a key weekly supply zone between 11,200 and 11,500 USD, where it was initially rejected.
Currently, we are in a technical pullback, likely targeting the mitigation zone at 9,700–10,000 USD. This area represents a solid long entry opportunity if the market confirms a bullish structure on intraday charts (H1 or H4).
The RSI is near overbought, yet without divergence—suggesting the trend remains structurally bullish despite a natural correction.
🧭 Strategic Conclusion
Cocoa currently shows a rare convergence of bullish signals: supportive COT positioning, increasing net long interest, strong 2Y seasonality, and clear technical structure controlled by buyers.
However, after the recent sharp upside move, a correction to key support zones is likely before another bullish leg unfolds.

Cocoa's Future: Sweet Commodity or Bitter Harvest?The global cocoa market faces significant turbulence, driven by a complex interplay of environmental, political, and economic factors threatening price stability and future supply. Climate change presents a major challenge, with unpredictable weather patterns in West Africa increasing disease risk and directly impacting yields, as evidenced by farmer reports and scientific studies showing significant yield reductions due to higher temperatures. Farmers warn of potential crop destruction within the decade without substantial support and adaptation measures.
Geopolitical pressures add another layer of complexity, particularly regarding farmgate pricing in Ghana and Côte d'Ivoire. Political debate in Ghana centres on demands to double farmer payments to align with campaign promises and counter the incentive for cross-border smuggling created by higher prices in neighbouring Côte d'Ivoire. This disparity highlights the precarious economic situation for many farmers and the national security implications of unprofitable cocoa cultivation.
Supply chain vulnerabilities, including aging trees, disease prevalence like Swollen Shoot Virus, and historical underinvestment by farmers due to low prices, contribute to a significant gap between potential and actual yields. While recent projections suggest a potential surplus for 2024/25 after a record deficit, pollination limitations remain a key constraint, with studies confirming yields are often capped by insufficient natural pollination. Concurrently, high prices are dampening consumer demand and forcing manufacturers to consider reformulating products, reflected in declining cocoa grinding figures globally.
Addressing these challenges necessitates a multi-pronged approach focused on sustainability and resilience. Initiatives promoting fairer farmer compensation, longer-term contracts, agroforestry practices, and improved soil management are crucial. Enhanced collaboration across the value chain, alongside government support for sustainable practices and compliance with new environmental regulations, is essential to navigate the current volatility and secure a stable future for cocoa production and the millions who depend on it.

Cocoa futures swing idea There is some room for price to advance to 9.500 area for a nice swing. We'll see.

LONG FUTURE CACAO Hello everyone, today I’m sharing my analysis on cocoa futures, as I see an interesting opportunity for an upward move. Below, I’ll break down the reasons behind my bullish bias and my entry strategy. Let’s get into the details!
Why I’m Bullish on Cocoa Futures
Institutional and Retail Activity
My indicator is showing an incredible amount of long contracts from institutional players, while retail traders are selling aggressively, which is a bit alarming. Since retail traders often get it wrong, this strengthens my expectation of an upcoming upward move, and I’m looking for a long entry.
Open Interest
My open interest indicator confirms my bias, as all open positions are longs. This signals strong buying interest from the big market players, aligning with my bullish outlook.
Valuation
My valuation indicator also shows a clear undervaluation of cocoa, suggesting that the current price is an attractive opportunity for buyers.
Technical Analysis
The price recently touched a key zone on the weekly timeframe, and in that touch and reaction, it left a zone that, based on my objective parameters, is actionable, as cocoa is at a significantly discounted price. While this move and reaction might not yet change the downtrend on lower timeframes, I can take advantage of this zone for a tactical entry. Let’s recall the principle of supply and demand: I’m placing my entries where institutions have their buy orders, and this is one of those zones.
Additionally, on higher timeframes, I see very significant demand zones below, which suggests a potential upward move that could indeed shift the trend to bullish. However, for this specific entry, I’m aiming for an entry within the next day. If the price drops further, I’ll be happy to buy at an even more refined zone on the weekly timeframe.
My Entry Strategy
I’ll enter a long position in the identified zone, expecting a quick upward move. I’ll keep this idea updated as the price evolves, so stay tuned for more details.
Disclaimer
This is my personal analysis and does not constitute financial advice. Trading carries risks, so always conduct your own research and assess your risk tolerance before making decisions.

Cocoa Short: Completed wave 2 (or B) rallyI've previously publish an idea for Cocoa long because of ending diagonal. But it should be clear to an EWer that the down move was a 5-wave structure and thus the long idea was a wave 2 or B idea. Now that we have completed 3-waves up for Cocoa, I think it's time that Cocoa resumes it's down move again. The conservative target is set at the previous support, but I certainly expect it to move way below that target.

Cocao Futures LongCC1! is not net long on the regression break.
The roll long on this commodity is (-1.4%) per a month.
I am entering a EA for this pair with limited risk and controlled entry.

Cocoa Swing LongTrade idea based on supply and demand, intermarket analysis, COT positioning and cross market valuation. Following a structured approach with clear entry, risk management, and confluence factors.

Cocoa shortCocoa is clearly in a downtrend. Friday's candle is clearly a pin bar. For me it makes sense to go short with a target of 6000 USD. I would enter the trade if we break below the low of Friday's candlestick.
