R2KThis still looking great imo I rather get this retest out the way now so we can get this show back going
We hold and maintain this area
We are good to continue.
Trade ideas

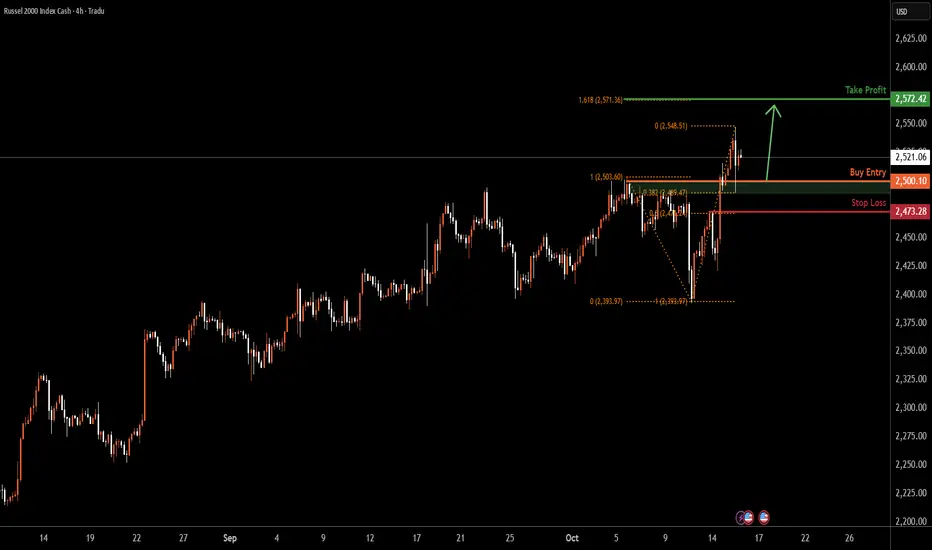
US2000 H4 | Price Rebounds from Key Support LevelUS2000 has bounced off the buy entry at 2,500.10, which is a pullback support that is slightly above the 38.2% Fibonacci retracement and could rise from this level to the upside.
Stop loss is at 2,473.28, which is a pullback support that lines up with he 50% Fibonacci retracement.
Take profit is at 2,572.42, which lines up with the 161.8% Fibonacci extension.
High Risk Investment Warning
Trading Forex/CFDs on margin carries a high level of risk and may not be suitable for all investors. Leverage can work against you.
Stratos Markets Limited (tradu.com ):
CFDs are complex instruments and come with a high risk of losing money rapidly due to leverage. 65% of retail investor accounts lose money when trading CFDs with this provider. You should consider whether you understand how CFDs work and whether you can afford to take the high risk of losing your money.
Stratos Europe Ltd (tradu.com ):
CFDs are complex instruments and come with a high risk of losing money rapidly due to leverage. 66% of retail investor accounts lose money when trading CFDs with this provider. You should consider whether you understand how CFDs work and whether you can afford to take the high risk of losing your money.
Stratos Global LLC (tradu.com ):
Losses can exceed deposits.
Please be advised that the information presented on TradingView is provided to Tradu (‘Company’, ‘we’) by a third-party provider (‘TFA Global Pte Ltd’). Please be reminded that you are solely responsible for the trading decisions on your account. There is a very high degree of risk involved in trading. Any information and/or content is intended entirely for research, educational and informational purposes only and does not constitute investment or consultation advice or investment strategy. The information is not tailored to the investment needs of any specific person and therefore does not involve a consideration of any of the investment objectives, financial situation or needs of any viewer that may receive it. Kindly also note that past performance is not a reliable indicator of future results. Actual results may differ materially from those anticipated in forward-looking or past performance statements. We assume no liability as to the accuracy or completeness of any of the information and/or content provided herein and the Company cannot be held responsible for any omission, mistake nor for any loss or damage including without limitation to any loss of profit which may arise from reliance on any information supplied by TFA Global Pte Ltd.
The speaker(s) is neither an employee, agent nor representative of Tradu and is therefore acting independently. The opinions given are their own, constitute general market commentary, and do not constitute the opinion or advice of Tradu or any form of personal or investment advice. Tradu neither endorses nor guarantees offerings of third-party speakers, nor is Tradu responsible for the content, veracity or opinions of third-party speakers, presenters or participants.
Small Caps: Finally a Breakout?The Russell 2000 has been stuck in a rut for years, but some traders may think the small-cap index has finally achieved escape velocity.
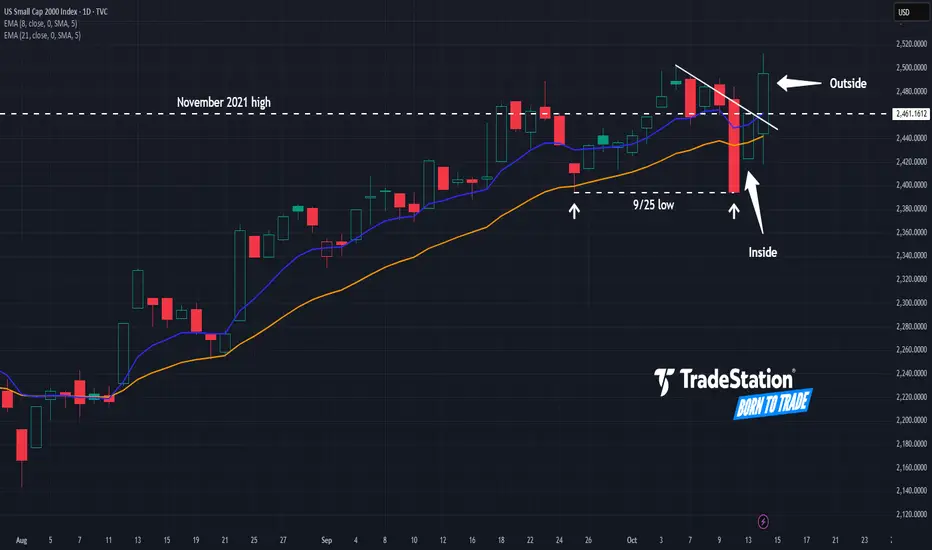
The first pattern on today’s chart is the November 2021 high around 2,460, where prices stalled last November. RUT has gotten above it this month and refused to stay below. Is a breakout finally underway?
Second is the September 25 low of 2,394. Prices tested and held that level last week, which may confirm support is in place.
Third, the index had a bullish inside candle after Friday’s selloff, followed by a bullish outside bar. That may reflect buyers are gaining control.
Next, RUT has apparently broken a trendline that began with the high on October 6.
Finally, consider this weekly ratio chart of the Russell 2000 against the Nasdaq-100. Notice how RUT outperformed in late 2023 and July 2024. Both of those moments saw expectations of Federal Reserve rate cuts. (Such moves often favor small caps.) Notice how the ratio is climbing again at the same time that investors look for more dovishness from the central bank.
TradeStation has, for decades, advanced the trading industry, providing access to stocks, options and futures. If you're born to trade, we could be for you. See our Overview for more.
Past performance, whether actual or indicated by historical tests of strategies, is no guarantee of future performance or success. There is a possibility that you may sustain a loss equal to or greater than your entire investment regardless of which asset class you trade (equities, options or futures); therefore, you should not invest or risk money that you cannot afford to lose. Online trading is not suitable for all investors. View the document titled Characteristics and Risks of Standardized Options at www.TradeStation.com . Before trading any asset class, customers must read the relevant risk disclosure statements on www.TradeStation.com . System access and trade placement and execution may be delayed or fail due to market volatility and volume, quote delays, system and software errors, Internet traffic, outages and other factors.
Securities and futures trading is offered to self-directed customers by TradeStation Securities, Inc., a broker-dealer registered with the Securities and Exchange Commission and a futures commission merchant licensed with the Commodity Futures Trading Commission). TradeStation Securities is a member of the Financial Industry Regulatory Authority, the National Futures Association, and a number of exchanges.
TradeStation Securities, Inc. and TradeStation Technologies, Inc. are each wholly owned subsidiaries of TradeStation Group, Inc., both operating, and providing products and services, under the TradeStation brand and trademark. When applying for, or purchasing, accounts, subscriptions, products and services, it is important that you know which company you will be dealing with. Visit www.TradeStation.com for further important information explaining what this means.
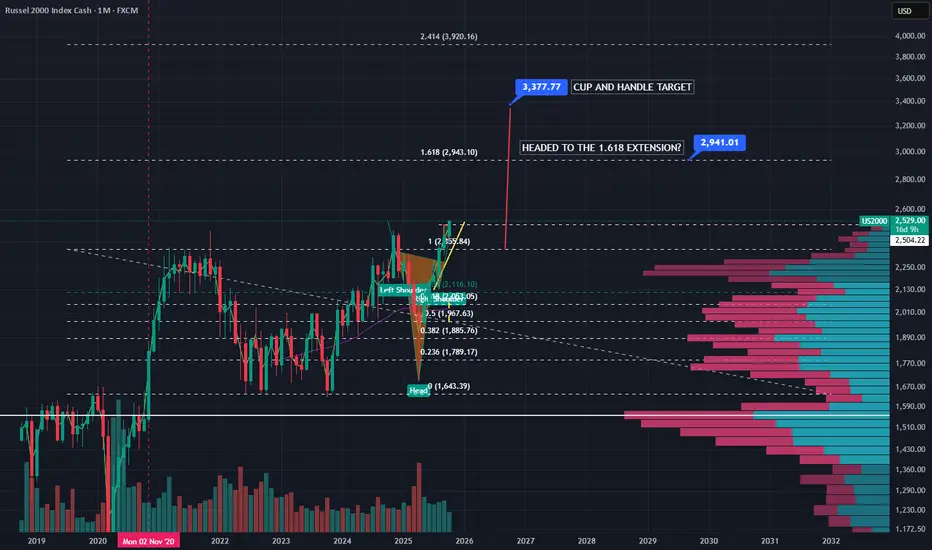
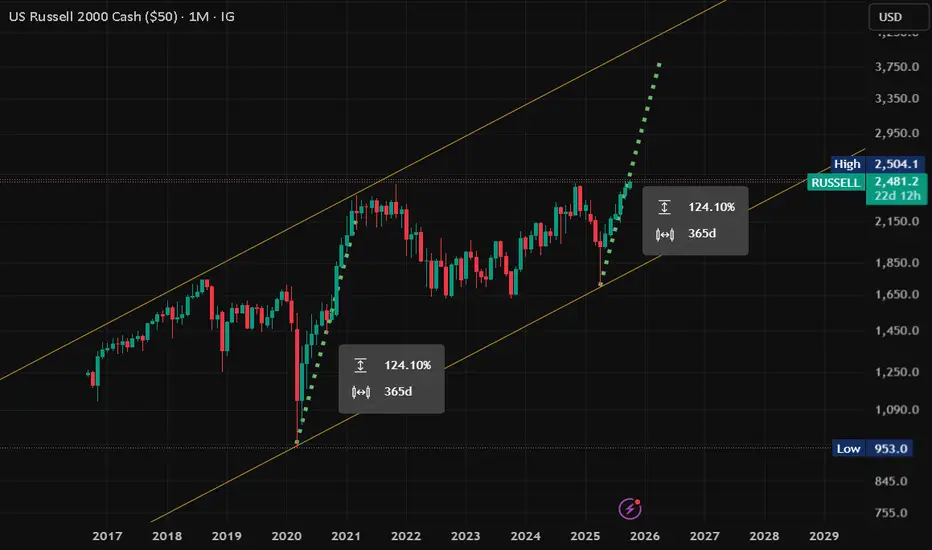
Russell 2000 all time high breakoutRussell 2000 small cap index has finally broken cup and handle formation to the upside. Possible targets are 2900 at the 1.618 Fib extension and the cup and handle target around 3300.
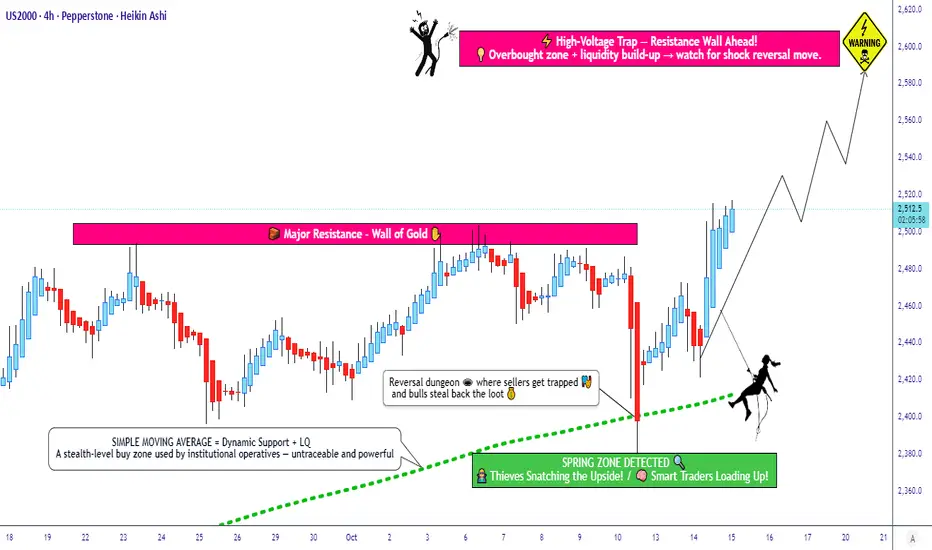
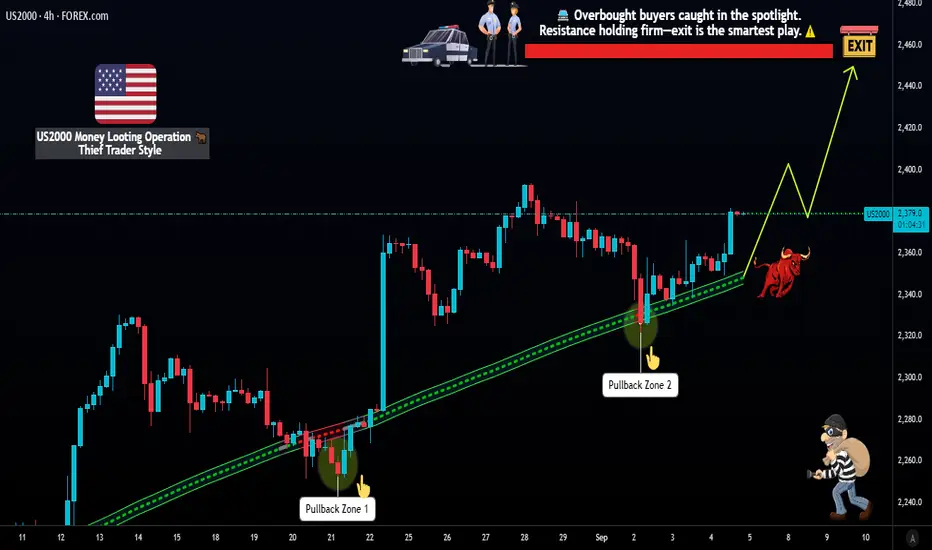
Is Smart Money Accumulating in US2000 Before the Next Move?🎯 RUSSELL 2000: Institutions Loading Up While You Sleep! 💰
📊 Asset Overview
US2000 / RUSSELL 2000 Index CFD - The small-cap kingmaker is showing serious institutional footprints!
🔥 The Setup: Bullish Retest at SMA
The Russell is doing that classic "look weak, go strong" move! 📈
We're seeing a textbook retest pullback at the Simple Moving Average - and guess who's quietly accumulating? The big money institutions! 🏦 While retail traders are panicking, the smart money is silently entering positions like ninjas in the night. 🥷
Translation: The trend is your friend, and right now that friend is buying the dip!
💎 The "Thief Strategy" Entry Plan
Layered Entry Approach 🎯
This isn't your grandma's single-entry strategy! We're using multiple limit orders (aka "The Thief Layering Method"):
Layer 1: 2440
Layer 2: 2460
Layer 3: 2480
Pro tip: Scale in like you're building a pyramid scheme, except this one actually makes money! 😂
Or: Jump in at current market price if you're feeling spicy 🌶️
🛡️ Risk Management
Stop Loss: 2420
⚠️ Thief's Disclaimer: This is MY stop loss based on MY risk tolerance. You do you! Manage your own risk like the responsible adult trader you are (or aspire to be). Take what makes sense for YOUR account size and sleep-at-night level.
🎯 Target Zone
Take Profit: 2600 🚀
Here's where it gets interesting - we've got a POLICE BARRICADE situation brewing! 🚨
What's a Police Barricade? It's when you've got:
✅ Strong resistance level
✅ Overbought conditions
✅ Potential trap zone for late buyers
The Game Plan: Secure those gains before the party gets too crowded! When you see 2600, that's your cue to take profits and live to trade another day.
Another Thief Disclaimer: This is MY target. You're the captain of your own ship! 🚢 If you want to take profits earlier or let it ride longer, that's YOUR call. Make money, then TAKE money - at your own risk and discretion!
🔗 Related Pairs to Watch
Keep your eyes on these correlated instruments:
AMEX:IWM (iShares Russell 2000 ETF)
Direct ETF tracking the Russell 2000
Higher liquidity for stock traders
Mirrors US2000 movement almost perfectly
AMEX:SPY (S&P 500 ETF)
Broad market correlation
Risk-on sentiment indicator
When SPY pumps, Russell often follows (with extra volatility!)
AMEX:DIA (Dow Jones ETF)
Blue-chip correlation check
Divergence signals can warn of small-cap weakness
NASDAQ:QQQ (Nasdaq-100 ETF)
Tech sector correlation
Russell 2000 often leads or lags based on risk appetite
📌 Key Correlation Insight: Russell 2000 is the risk-on barometer! When investors feel confident, small-caps outperform. When fear creeps in, they sell off harder than large-caps. Watch the broader indices for confirmation of market sentiment!
🎓 Technical Summary
Bias: Bullish 🐂
Setup Type: Retest/Pullback Entry
Strategy: Layered Entry (Thief Method)
Risk/Reward: Favorable with defined stops
Institutional Activity: Accumulation phase detected 🏦
⚡ The Bottom Line
This setup screams institutional accumulation! The smart money doesn't announce their entries on CNBC - they quietly load up while everyone else is distracted. Be the thief, not the victim! 🎭
Remember: Markets reward patience and punish FOMO. Layer in, manage your risk, and let the trade come to you!
✨ If you find value in my analysis, a 👍 and 🚀 boost is much appreciated — it helps me share more setups with the community!
⚠️ DISCLAIMER
This is the "Thief Style" trading strategy. Trading involves substantial risk of loss. Always do your own research, manage your own risk, and never trade with money you can't afford to lose. Past performance doesn't guarantee future results. Trade at your own risk! 🎲
#Russell2000 #US2000 #SmallCaps #SwingTrading #DayTrading #TechnicalAnalysis #PullbackEntry #InstitutionalTrading #ThiefStrategy #LayeredEntry #CFDTrading #IndexTrading #BullishSetup #SMARetest #TradingStrategy #RiskManagement #IWM #MarketAnalysis #TradingView #PriceAction
Nasdaq Becoming the New Gold? The AI Boom and Market RotationSince 2020, the Nasdaq has completely pulled away from the pack. Compared to the S&P 500, Russell 2000, the dollar, and even gold, it’s been the clear leader — fueled by the AI boom and the massive flows into tech giants like NVIDIA, Microsoft, and Meta. While gold used to be the classic safe haven, lately it feels like investors see the Nasdaq as their new store of value.
The twist, of course, is that gold doesn’t need earnings to shine, but the Nasdaq does. As long as the AI narrative keeps delivering, it could keep playing this “new gold” role. But if that story cracks, the downside will look very different than a sideways-moving metal.

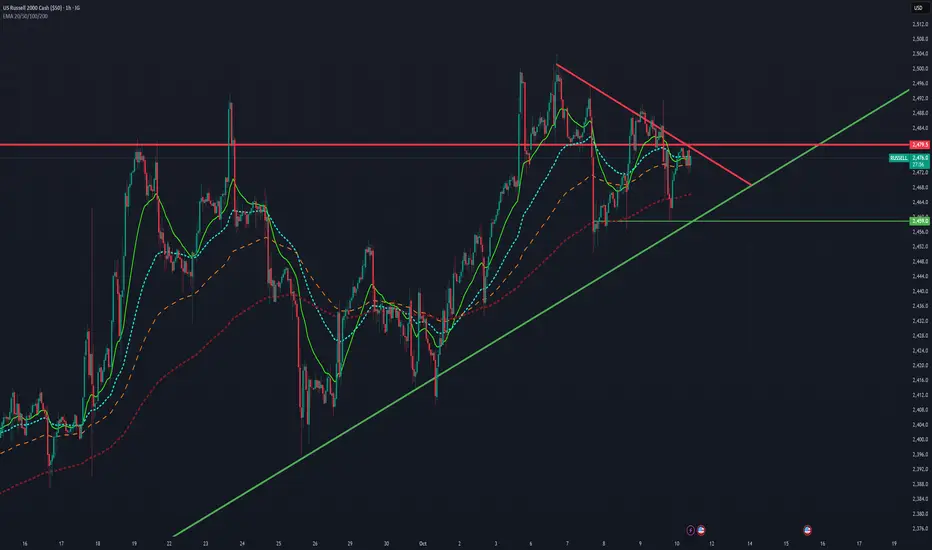
Why I Believe the Small Cap Market Might Be Bearish TodayLooking at the current 1-hour chart of the US Russell 2000 Index, several technical factors suggest that the small-cap market may be leaning toward a bearish sentiment in the short term.
First, price action has formed a descending triangle pattern, a structure that often signals potential downside continuation. The upper trendline (shown in red) indicates consistent lower highs, suggesting selling pressure is gradually increasing. Meanwhile, the green ascending trendline underneath shows that buyers have been defending support—but each bounce has been weaker than the last.
The index is currently consolidating near a critical resistance level around 2,479, a zone that has rejected price multiple times. Failure to break above this resistance could trigger a move back toward the 2,459–2,460 support area or even lower if selling accelerates.
Additionally, the short-term moving averages (EMA 20 and 50) are flattening and showing early signs of a potential crossover below the longer EMAs (100/200), a classic bearish signal that often precedes downward momentum.
In summary, while the long-term trendline support remains intact, the combination of a descending triangle, resistance rejection, and weakening momentum makes the small-cap market vulnerable to a short-term bearish move unless buyers reclaim the 2,480 zone decisively.
Bearish Divergence Builds in U.S. Small CapsThe U.S. small-cap contract has struggled above 2492 recently, delivering multiple failed bullish breakouts from the high established on September 23. With bearish divergence between price and RSI (14) evident, the longer this iffy price action persists, the more it may encourage bears to seek out a larger downside flush.
Should we see another failed breakout attempt above 2492, shorts could be established beneath the level with a stop above the recent highs to protect against reversal. 2450 is the first downside level of note, albeit a minor one. For shorter-term types, it’s a potential target, although uptrend support running from September 2 screens as a more important level should we see a pullback. If the price were to crack that level convincingly, it may spark a faster unwind towards the 50-day moving average, which the contract bounced strongly from the last two times it was tested. Both levels provide targets for longer-term traders.
As a reminder, the underlying Russell 2000 index remains very much a play on the U.S. interest rate outlook and, consequently, broader domestic economic conditions. With nearly four rate cuts priced by the Fed’s September meeting next year, it’s provided meaningful tailwinds for non-profitable, capital-reliant firms without sparking any real concern about a looming U.S. recession.
However, with few signs the government shutdown will end anytime soon, coupled with prominent headlines surrounding private debt markets and iffy price action in other riskier asset classes, it’s not difficult to see potential macro landmines. Tailwinds from any increase in rate cuts would likely be overridden quickly if driven by concerns about increased volatility stemming from another economic downturn.
For small-cap bulls, there is such a thing as too much of a good thing when it comes to the magnitude and speed of rate cuts. Be careful what you wish for.

Looks like we are almost half way to the top...My drawings show what I see as a likely continuation by examining the chart and finding patterns and trendlines.
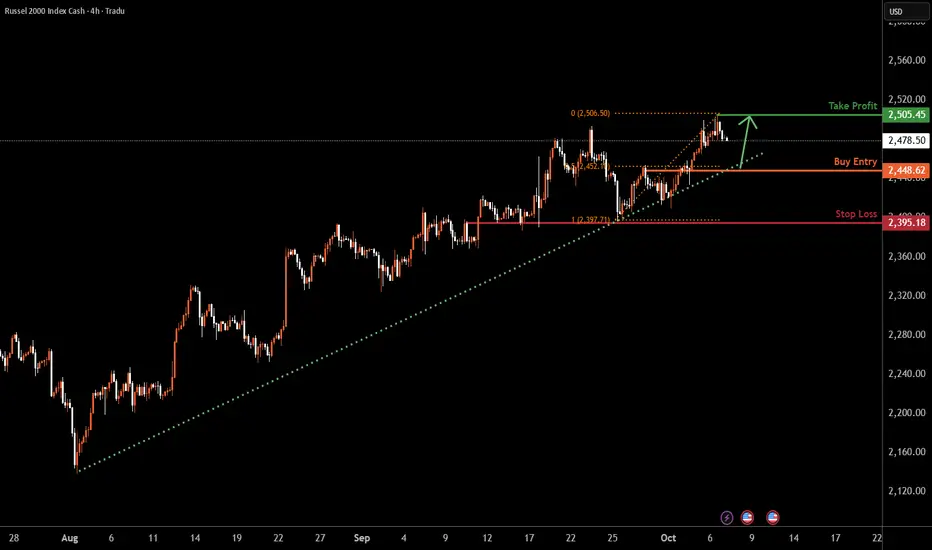
US2000 H4 | Potential Bullish Continuation AheadBased on the H4 chart analysis, we could see the price fall to the buy entry at 2,448.62, which is a pullback support that aligns with the 50% Fibonacci retracement and could bounce from his level to the take profit.
Stop loss is at 2,395.18, which is a pullback support.
Take profit is at 2,505.45, which is a swing high resistance.
High Risk Investment Warning
Trading Forex/CFDs on margin carries a high level of risk and may not be suitable for all investors. Leverage can work against you.
Stratos Markets Limited (tradu.com ):
CFDs are complex instruments and come with a high risk of losing money rapidly due to leverage. 65% of retail investor accounts lose money when trading CFDs with this provider. You should consider whether you understand how CFDs work and whether you can afford to take the high risk of losing your money.
Stratos Europe Ltd (tradu.com ):
CFDs are complex instruments and come with a high risk of losing money rapidly due to leverage. 66% of retail investor accounts lose money when trading CFDs with this provider. You should consider whether you understand how CFDs work and whether you can afford to take the high risk of losing your money.
Stratos Global LLC (tradu.com ):
Losses can exceed deposits.
Please be advised that the information presented on TradingView is provided to Tradu (‘Company’, ‘we’) by a third-party provider (‘TFA Global Pte Ltd’). Please be reminded that you are solely responsible for the trading decisions on your account. There is a very high degree of risk involved in trading. Any information and/or content is intended entirely for research, educational and informational purposes only and does not constitute investment or consultation advice or investment strategy. The information is not tailored to the investment needs of any specific person and therefore does not involve a consideration of any of the investment objectives, financial situation or needs of any viewer that may receive it. Kindly also note that past performance is not a reliable indicator of future results. Actual results may differ materially from those anticipated in forward-looking or past performance statements. We assume no liability as to the accuracy or completeness of any of the information and/or content provided herein and the Company cannot be held responsible for any omission, mistake nor for any loss or damage including without limitation to any loss of profit which may arise from reliance on any information supplied by TFA Global Pte Ltd.
The speaker(s) is neither an employee, agent nor representative of Tradu and is therefore acting independently. The opinions given are their own, constitute general market commentary, and do not constitute the opinion or advice of Tradu or any form of personal or investment advice. Tradu neither endorses nor guarantees offerings of third-party speakers, nor is Tradu responsible for the content, veracity or opinions of third-party speakers, presenters or participants.
Russell hits new highsSo much for the government shutdown. US equity indices have rallied again today, thanks to ongoing bullish momentum and AI optimism. Bets that the Fed easing will continue to support corporate earnings are keeping the bulls fully in charge with traders continuing to take the ongoing US gov shutdown in their stride..
While tech stocks continue to shine -- led by Advanced Micro Devices (AMD), which soared after signing a deal with OpenAI to roll out AI infrastructure -- small caps are doing great too ahead of the earnings season.
The Russell has been printing lots of bullish price action lately and we have called for new highs on the index. It has not let us down and today climbed to a new high, after taking out a long-term resistance zone between 2461 and 2468, marking the highs from 2021 and 2024.
The breakout means the index has also poked its head above last week's high at 2491, thus invalidating the bearish-looking inverted hammer candle that had pointed to a potential top. Well that candle only preceded a modest pullback, as the index has now hit a new record. 2500, 2600 could be the next upside targets from. Key support levels below that 2461-2468 range are marked on the chart.
By Fawad Razaqzada, market analyst with FOREX.com

US2000 Layered LSMA Pullback Strategy – Bullish Opportunity🚀 US2000 Index – Thief Plan: LSMA Pullback + Layered Entries 📊
📌 Trading Plan (Swing / Day Trade)
Strategy: Bullish LSMA moving average pullback plan 📈
Thief Style Entries (Layering Method):
Multiple buy-limit layers at 2340 / 2350 / 2360 / 2370
You can increase layers based on your own strategy & risk 🧩
Stop Loss (SL): Thief SL @ 2310 (adjust based on your own plan & risk) 🛡️
Target (TP): Strong resistance at 2450 ⚠️ – “Police barricade” 🚓
Note: This is not a fixed TP recommendation. Thief OG’s 🎭, take profits where it fits your risk and reward. 💰
❓ Why This Plan? (Thief Logic)
🔹 Technical (Thief Strategy)
Bulls loading pressure with LSMA pullback signals 🐂.
Layered entries reduce timing risk and allow multiple profit grabs.
Strong resistance ahead at 2450 = escape zone before “police barricade” 🚨.
🔹 Sentimental Reasoning
Retail sentiment 58% bullish 🟢 vs. 32% bearish 🔴 → optimism is leaning upward.
Institutions also show 52% bullish bias, confirming retail direction ⚖️.
Fear & Greed index at 52/100 = Neutral 😐 → balanced emotions, not overheated.
🔹 Fundamental Reasoning
Earnings growth ~12% expected in 2025 💼 supporting equity demand.
Consumer spending still rising (+0.5% in July) 🛍️ keeps the economy resilient.
Fed policy steady at 4.25%–4.50% 🏦 = stable environment for stocks.
🔹 Macro Reasoning
Inflation above Fed target (Core PCE 2.9% y/y) 📈 = caution flag.
Trade tariffs 🌐 add uncertainty, but no crash-level risk.
Fed rate cut expected in September 🔽 = bullish fuel if confirmed.
👉 Thief Conclusion: Fundamentals 💼 + Sentiment 🧠 + Macro 🌍 align with a slightly bullish thief setup. The layering style plan matches the market bias → stack the layers, steal the profits, and escape before 2450 barricade hits 🚀💰.
*********************************************************************************************************************
📊 US2000 Index CFD Data Report – September 5, 2025
🕒 Real-Time Snapshot
Daily Change: +0.89% (+19.12 pts) 🚀
Monthly Trend: +3.28% 📅
Yearly Trend: +18.21% 🌟
😊 Investor Sentiment Outlook
Retail Traders:
Bullish: 58% 🐂
Bearish: 32% 🐻
Neutral: 10% ⚖️
Institutional Traders:
Bullish: 52% 🐂
Bearish: 38% 🐻
Neutral: 10% ⚖️
🌡️ Fear & Greed Index
Current: 52/100 (Neutral) 😐
Fear: Below 45
Greed: Above 55
Market mood balanced ⚖️
📈 Fundamental Score: 72/100
Corporate earnings growth ~12% (2025 outlook) 💼
Consumer spending resilient (+0.5% in July) 🛍️
Fed funds steady at 4.25%–4.50% 🏦
🌍 Macro Score: 65/100
Inflation still above target (Core PCE 2.9% y/y) 📈
Tariff policies = trade uncertainty 🌐
Fed rate cut expected September 🔽
🐂🐻 Overall Market Outlook: Slightly Bullish
Score: 68/100 🐂
Reason: Strong earnings + consumer demand support upside, but tariffs + inflation cap growth. Expect consolidation with bullish tilt 🚀
🔑 Key Takeaways
Neutral → bullish tilt 😐➡️🐂
Retail + institutional both lean optimistic ⚖️
Fundamentals strong 💼, macro mixed 🌍
Payroll data = key Fed signal today 📊
Thief Plan aligns with market bias & LSMA pullback 📈
👀 Related Pairs to Watch
CAPITALCOM:US30
FOREXCOM:SPX500
PEPPERSTONE:NAS100
TVC:DXY
TVC:VIX
✨ “If you find value in my analysis, a 👍 and 🚀 boost is much appreciated — it helps me share more setups with the community!”
#US2000 #Russell2000 #IndexTrading #ThiefPlan #SwingTrade #DayTrading #StockIndices #MarketOutlook #FearAndGreed #TradingStrategy
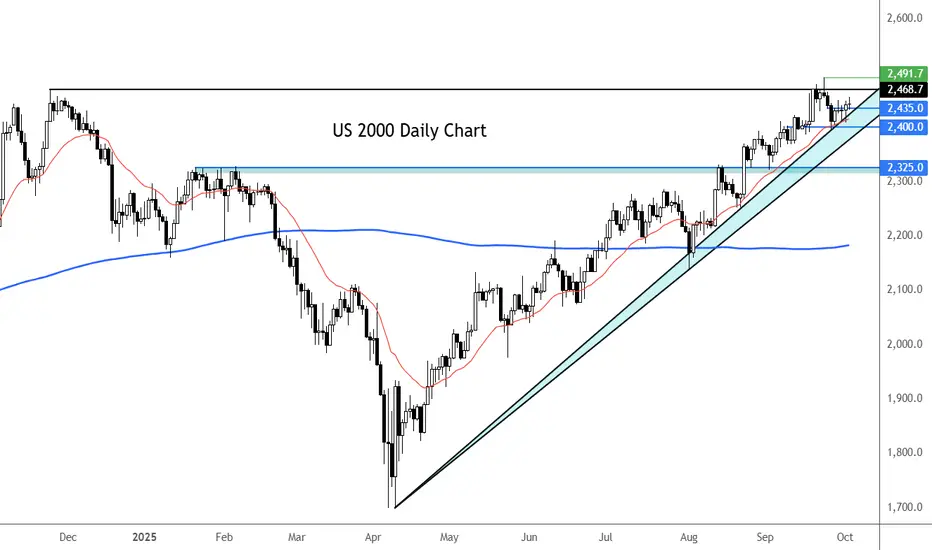
Russell eases to test key short-term supportThe Russell has bounce off its lows a tiny bit but could we now see a more decisive recovery heading deeper into the U.S. session?
The markets have been holding firm with tech sector leading the spx500 to a new high today, even though the index then came off earlier highs amid profit taking with government shutdown making things complicated.
Still, the trend is clearly bullish and we could well see the small cap index hold support here around 2435 which was prior resistance.
On the upside 2468 is the main level to watch. Break this and a new ATH above 2491 could be on the cards.
By Fawad Razaqzada, market analyst with FOREX.com

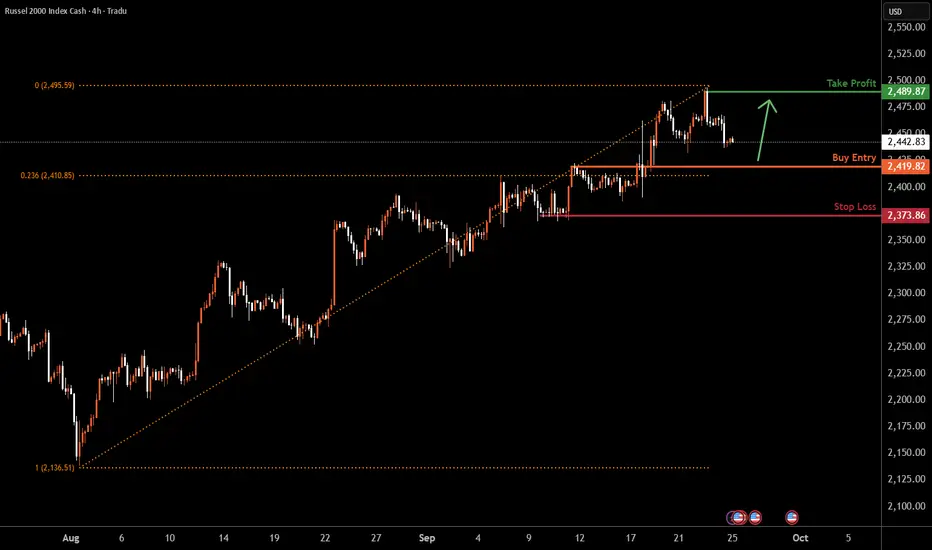
US2000 H4 | Continuation of bullish momentumBased on the H4 chart analysis, we could see the price fall to the buy entry at 2,419.82, which is a pullback support that is slightly above the 23.6% Fibonacci retracement and could bounce from this level to our take profit.
Stop loss is at 2,373.86, which is a pullback support.
Take profit is at 2,489.87, which is a swing high resistance.
High Risk Investment Warning
Trading Forex/CFDs on margin carries a high level of risk and may not be suitable for all investors. Leverage can work against you.
Stratos Markets Limited (tradu.com ):
CFDs are complex instruments and come with a high risk of losing money rapidly due to leverage. 65% of retail investor accounts lose money when trading CFDs with this provider. You should consider whether you understand how CFDs work and whether you can afford to take the high risk of losing your money.
Stratos Europe Ltd (tradu.com ):
CFDs are complex instruments and come with a high risk of losing money rapidly due to leverage. 66% of retail investor accounts lose money when trading CFDs with this provider. You should consider whether you understand how CFDs work and whether you can afford to take the high risk of losing your money.
Stratos Global LLC (tradu.com ):
Losses can exceed deposits.
Please be advised that the information presented on TradingView is provided to Tradu (‘Company’, ‘we’) by a third-party provider (‘TFA Global Pte Ltd’). Please be reminded that you are solely responsible for the trading decisions on your account. There is a very high degree of risk involved in trading. Any information and/or content is intended entirely for research, educational and informational purposes only and does not constitute investment or consultation advice or investment strategy. The information is not tailored to the investment needs of any specific person and therefore does not involve a consideration of any of the investment objectives, financial situation or needs of any viewer that may receive it. Kindly also note that past performance is not a reliable indicator of future results. Actual results may differ materially from those anticipated in forward-looking or past performance statements. We assume no liability as to the accuracy or completeness of any of the information and/or content provided herein and the Company cannot be held responsible for any omission, mistake nor for any loss or damage including without limitation to any loss of profit which may arise from reliance on any information supplied by TFA Global Pte Ltd.
The speaker(s) is neither an employee, agent nor representative of Tradu and is therefore acting independently. The opinions given are their own, constitute general market commentary, and do not constitute the opinion or advice of Tradu or any form of personal or investment advice. Tradu neither endorses nor guarantees offerings of third-party speakers, nor is Tradu responsible for the content, veracity or opinions of third-party speakers, presenters or participants.
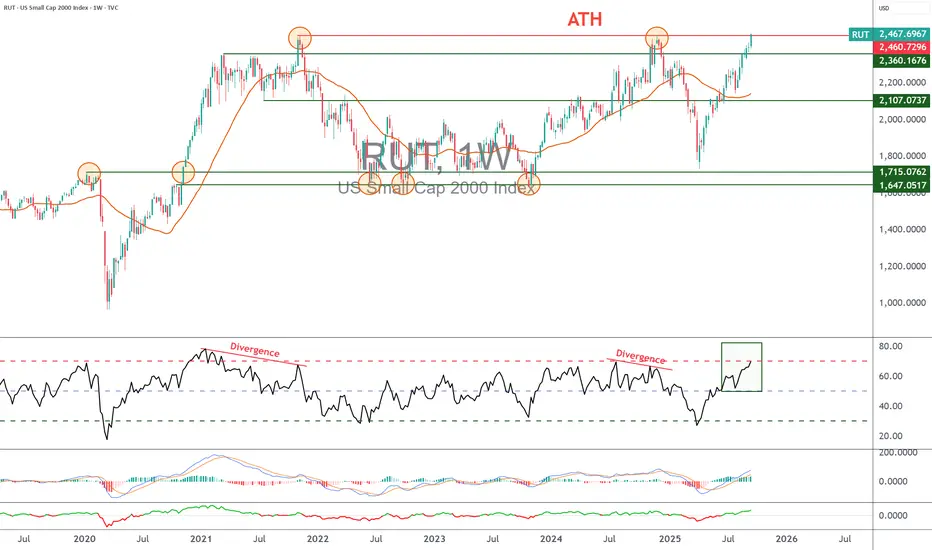
Russell 2000 Year-End Price Target and Technical Rebound OutlookIf you ahven`t bought the Double Bottom on RUT 2K:
Now the Russell 2000 Index (RUT), which tracks small-cap stocks, has recently entered oversold territory, signaling that a potential technical rebound could be on the horizon. Oversold conditions typically occur when selling pressure becomes excessive, driving the index below its fundamental value and creating an opportunity for a corrective bounce.
Several technical indicators, including the Relative Strength Index (RSI), have fallen below the 30 level — a classic oversold signal. Historically, similar setups have led to strong short-term recoveries as buying interest returns once the selling momentum exhausts itself.
Additionally, market breadth indicators suggest that the recent pullback has been broad-based, with a high percentage of RUT 2K components trading below their 50-day and 200-day moving averages. This type of widespread weakness often precedes a period of mean reversion, where prices bounce back toward key resistance levels.
Given these technical signals, my price target for RUT 2K is $2,450 by the end of the year. A rebound toward this level would represent a recovery of approximately 10-12% from current levels, aligning with previous post-oversold rallies in the index. If broader market sentiment stabilizes and small caps benefit from improving economic conditions or easing rate hike pressures, the path toward this target becomes increasingly plausible.
While downside risks remain — including ongoing macroeconomic uncertainty and geopolitical tensions — the technical setup suggests that RUT 2K is primed for a recovery in the coming months.

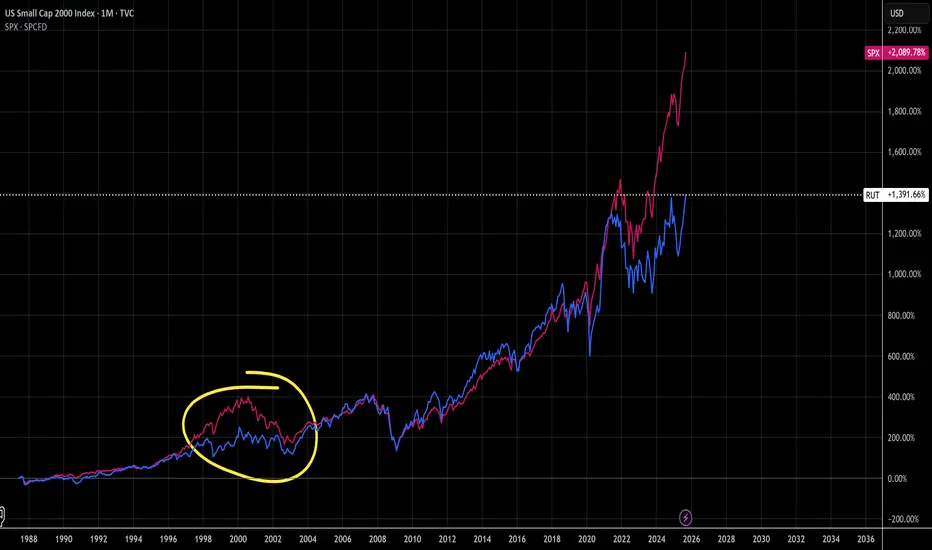
RUT vs SPX - A clear mirror of the 2000 Dot Com CrashTechnicals:
Here we compare the SPX in pink to the RUT in blue. You can see the last time the SPX overtook the RUT was in 1998-2002, if history repeats this puts us squarely in the late 1998. Unlike 1998, we see the RUT has made a higher high after it's V-shaped recovery which looks more promising for it this time around. We could have an everything bubble forming here as money supply inflation and speculation trickle down into smaller companies and people look to diversify outside of the already booming precious metals, crypto, and SPX markets. So far the market has not had a lot of breadth, but it's starting to diversify
Fundamentals:
Looking at the companies that form the RUT, I was surprised to learn that larger ones like AMD are in there. Other notables include utility and the health care which were hit hard earlier this year. Now that there is rotation out of some tech into these 2 sectors I think we may see the RUT really start to perform, but... is it worth buying?
Well the fact is, in this 38 year chart history the RUT has outperformed the SPX for 26 years. The RUT's longest run outperforming the SPX was following the 2000 crash, bottoming in 2002 before surpassing the SPX in 2003-2020. Personally, I'll be looking into this index in 2028/2029
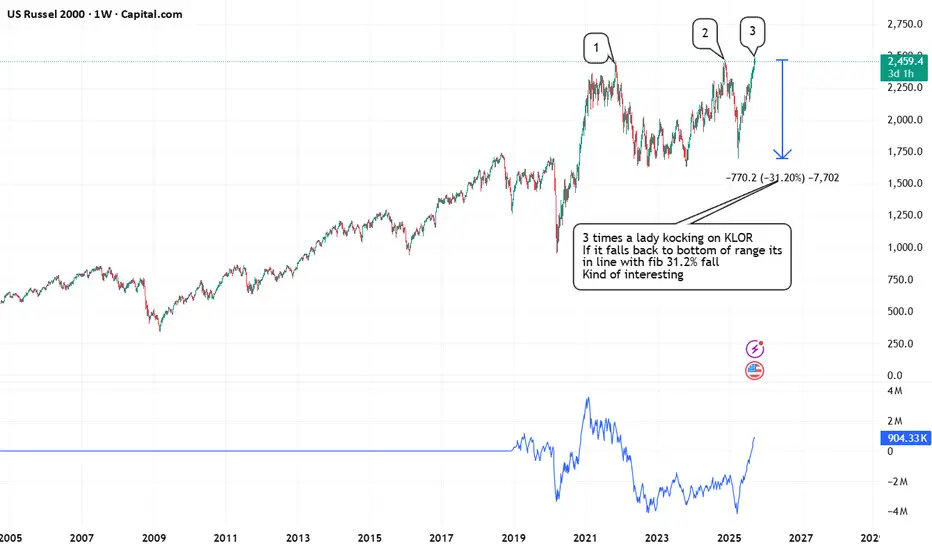
3 times a lady! Knock knock knocking on heavens door ...Bearish on the Russel
looks kind of toppy to me
love that if it goes back to the bottom of the range if so it falls 31.2% a fib number
Not advice - just for educational purposes
Oh there are next to no bears left out there out in the cold just feels like me!
you will need to count 5 small impulse waves down from this level before you could justify putting on shorts unless you are bit early as bull blow off moves go further than anyone of our time can know
Look for volume to pick up on down days
Surprises come to the downside if the market turns bearish
if it moves roughly 32% down then there should be some nice bear equities in that index to feast short on as more bears come out of hibernation, and they will be very hungry!
However the counter side is that companies have put in their best profits in for like the past 25 years so don't rule out bull continuation.
RTY ShortRTY is likely to face a potential decline from the 2430 level at point D of the crab pattern, with TP1 through TP3 serving as probable target objectives.

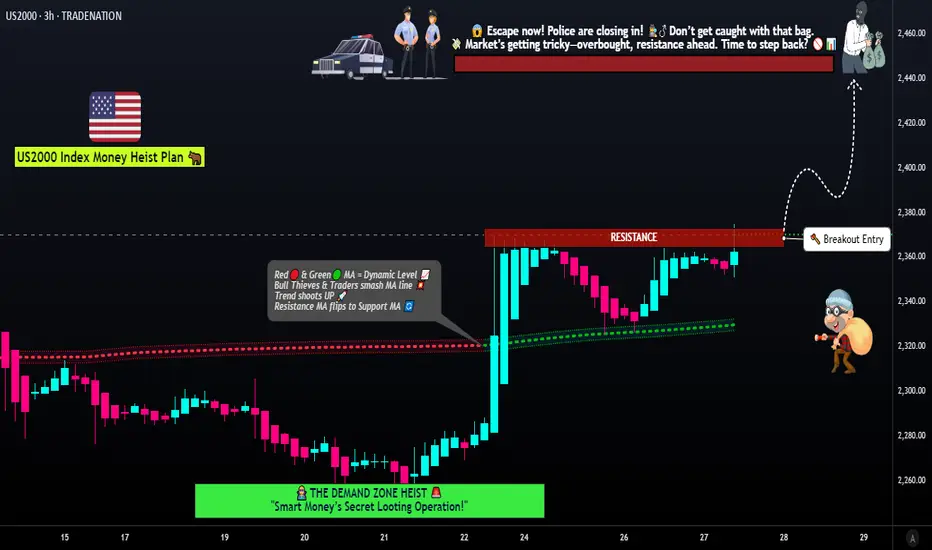
US2000 Bullish Breakout Strategy! Layer Entries and Escape Plan🚨💰 US2000 / RUSSELL2000 Index Market Robbery Plan 🏦💸 (Swing/Scalping Trade)
🌟Hi! Hola! Ola! Bonjour! Hallo! Marhaba!🌟
Dear Money Makers & Robbers, 🤑💰💸✈️
Based on 🔥 Thief Trading Strategy 🔥 here is our heist plan to rob the US2000 / RUSSELL2000 Index Bank Vault. Stick to the strategy outlined below – this is a layered entry plan, designed to outsmart market police 🚓.
🎯 Entry Plan (Breakout + Layered Thief Style)
📌 Breakout Entry @ 2370.00 ⚡ → Robbery starts here!
📌 Layered Buy Limit Orders: (2370.00) – (2360.00) – (2350.00) – (2340.00)
👉 Add more layers if you want, but only activate after breakout confirmation!
📌 Set Alarm in TradingView ⏰ to know the exact breakout moment.
(Thief Rule: Using multiple entries = more bags of cash 💰. Don’t be lazy – set layers smartly!)
🛑 Stop Loss (SL) – Thief Protection Line
📍 Thief SL @2300.00 (place AFTER breakout)
📍 Adjust based on your risk, lot size, and how many layers you’ve stacked.
👉 Remember: Stop loss is the alarm system – place it wisely or police will catch you 🚨.
🏴☠️ Target 🎯 – Escape Point
🚀 2440.00 = Police Barricade!
Escape with stolen profit bags before they lock down the road 🛑.
👉 You can take profit earlier if you see police headlights flashing 👮♂️.
🧲 Scalpers Note 👀
⚡ Rob fast, rob clean – only scalp long side.
If you’re rich 💎 – straight breakout entry.
If you’re patient thief – layer it like an OG.
📢 News & Risk Management Alert ⚠️
📰 Big news = extra police patrols 🚔.
👉 Avoid new trades during red news events.
👉 Use trailing SL to lock profits – don’t get caught after a good robbery.
💖 Support our robbery gang 💥Hit the Boost Button💥 on TradingView and power up the Thief Trading Squad 🏆🤝❤️🚀.
Stay tuned, more heist plans are on the way… 🤑🐱👤💸
#ThiefTrader #Russell2000 #US2000 #SwingTrade #Scalping #BreakoutTrading #LayerStrategy #BullishPlan #IndexTrading #HeistPlan #TradingView
New Risks Require Policy Adjustment – Fed Rate Cut as ExpectedNew Risks Require Policy Adjustment – Fed Rate Cut as Expected
On September 17, at the conclusion of the FOMC meeting, the Fed lowered its policy rate by 25 bps, as expected, to a range of 4.0–4.25%. The decision was almost unanimous, with only one dissent: Stephen Miran, a new committee member appointed by D. Trump following the recent departure of Adriana Kugler, voted for a 50 bps cut. The post-meeting press release also noted that the Fed will continue reducing the size of its balance sheet, while risks to employment have increased. The committee emphasized that it remains attentive to risks on both sides of its dual mandate.
The Fed also released its September economic projections. The key change was a downward revision in the path of future rates: to 3.6% for 2025 and 3.4% for 2026. This confirmed the Fed’s readiness to cut rates again in October and December 2025 but also reflected caution toward further easing in 2026. Futures markets currently price in three cuts for 2026, while the Fed projects only one. Nevertheless, confirmation that the Fed is prepared to significantly lower rates in the near term is a positive signal.
The Fed’s GDP growth forecasts were raised to 1.6% for 2025 and 1.8% for 2026. Unemployment projections were little changed: 4.5% at the end of 2025 and 4.4% at the end of 2026. Core inflation, however, was revised up for 2026 to 2.6% y/y, while the 2025 forecast was left unchanged at 3.1% y/y. Market participants noted the inconsistency: rate cuts alongside stronger growth, stable unemployment, and higher inflation projections — an unusual situation for the Fed.
In his traditional post-meeting statement, Fed Chair J. Powell offered little new. His speech was cautious, filled with guarded and politically correct wording. In short: inflation has recently risen and remains elevated; risks to employment have increased. To balance these risks, the Fed decided to cut rates by 25 bps in September. The current labor market weakness is unusual, in part due to shrinking labor supply (linked to the deportation of illegal migrants). Goods inflation accelerated, but services inflation appears to remain in a disinflationary trend. The projected rate path was lowered by 25 bps, though Powell stressed this is not a preset plan or commitment.
Powell’s Q&A yielded more interesting insights:
He confirmed that current tariffs have partly shifted their impact onto the labor market by accelerating automation, rather than fueling inflation.
He stressed that the main reason for the rate cut was a reassessment of risks: earlier tilted toward inflation but now closer to balance, warranting policy adjustment.
He characterized the cut as a form of risk management, not a reaction to a sharp deterioration in the labor market.
Overall, the Fed is acting appropriately and is ready to respond quickly to changing conditions,
though inflation concerns remain a strong constraint. In our view, the Fed will cut rates twice more in 2025 — in October and December, by 25 bps each. Cuts in 2026 will depend heavily on inflation dynamics. The Fed’s projection of one cut in 2026 with core inflation at 2.6% reflects its conservative stance. We believe two cuts may be required in 2026, even if inflation is somewhat higher (around 2.9% y/y).
The start of the Fed’s easing cycle is a positive factor for equities, though inflation risks will clearly limit the pace of cuts. Much of this expectation is already priced in. Going forward, market dynamics will depend on how the economy responds: if lower rates support the labor market, boost consumer spending, and increase net hiring, this will be strongly positive for stocks. Conversely, if labor market reaction is weak but inflation ticks higher from the current 0.25–0.28% m/m pace in the core PCE deflator, markets may correct.
Looking at market expectations from two sources — the prediction market Polymarket and Fed funds futures — consensus points to continued easing at each of the next Fed meetings.
Polymarket data: October cut probability — 25 bps at 80%, 50 bps at 6%. December — 25
bps at 72%, 50 bps at 6%. Thus, Polymarket implies 86% and 78% odds of cuts in October
and December, respectively, or a 67% probability of two cuts by year-end.
Futures market: more dovish, pricing an 82.8% probability of two cuts by end-2025.
Freedom Broker’s base-case forecast aligns with market consensus: two cuts totaling 50 bps by year-end.
For equities, as the probability of two cuts nears 100%, the impact should be strongest for growthoriented, long-duration risk assets (small caps, fast-growing tech), as well as rate sensitive sectors outside the “growth” category (utilities, real estate). Still, since much of this is already priced in, a sharp rally in risk assets is unlikely.
On Wednesday, markets were subdued: the S&P 500 closed 0.1% lower, Nasdaq 100 fell 0.2%,
while the small-cap Russell 2000 gained 0.18%. In Thursday’s premarket (September 18),
sentiment is positive: S&P 500 futures +0.6%, Nasdaq +0.8%, Russell 2000 +1.0%.
Freedom Broker – Capital Markets Research
capitalmarkets@frhc.group

Can the Russell 2000 break its all-time high?The U.S. Federal Reserve (Fed) pivoted this week and confirmed a more accommodative monetary trajectory for the last quarter of 2025. The federal funds rate is expected to be cut two more times, for a total of three cuts across the September, October, and December meetings.
Small businesses are highly sensitive to financing conditions, and lower funding costs are a driver of investment and growth for this category of companies. Under these conditions, can the Russell 2000 — the U.S. small-cap equity index — reach a new all-time high by the end of 2025?
1. The Russell 2000 represents the dynamics of small business activity in the U.S. stock market
The Russell 2000 holds a special place in the American equity universe as it brings together around 2,000 small-cap companies. Unlike the S&P 500, which includes the 500 largest publicly traded U.S. firms, the Russell 2000 reflects more the dynamics of domestic companies, less exposed internationally and often more sensitive to domestic economic conditions, particularly interest rates and U.S. consumption. Given their smaller size, these firms generally have fewer financial resources, making them more vulnerable to economic cycles, but also more agile and able to post rapid growth when the environment is favorable, especially in periods of falling interest rates.
2. There will be a total of three federal funds rate cuts by the end of 2025
Jerome Powell’s Fed has thus confirmed a true monetary pivot to take into account the slowdown in the labor market, while remaining cautious about the upcoming normalization of inflation. The more accommodative monetary trajectory announced should be supportive for risk assets in the stock market, but upcoming U.S. employment and inflation updates will still have a strong impact.
Federal funds rate cycle through the end of 2025: there should therefore be a total of 3 rate cuts by year-end according to the CME Fed Watch Tool shown below.
3. From a technical analysis perspective, the Russell 2000 is testing its all-time high set in November 2021
The upward trend in the Russell 2000 over the past several months signals that investors are anticipating better conditions for U.S. small businesses, directly linked to the decline in the federal funds rate. In the short term, the Russell 2000 may pause as it tests its all-time high, but this resistance could be broken this fall thanks to the Fed’s monetary easing.
The chart below shows weekly candlesticks of the Russell 2000 equity index:
DISCLAIMER:
This content is intended for individuals who are familiar with financial markets and instruments and is for information purposes only. The presented idea (including market commentary, market data and observations) is not a work product of any research department of Swissquote or its affiliates. This material is intended to highlight market action and does not constitute investment, legal or tax advice. If you are a retail investor or lack experience in trading complex financial products, it is advisable to seek professional advice from licensed advisor before making any financial decisions.
This content is not intended to manipulate the market or encourage any specific financial behavior.
Swissquote makes no representation or warranty as to the quality, completeness, accuracy, comprehensiveness or non-infringement of such content. The views expressed are those of the consultant and are provided for educational purposes only. Any information provided relating to a product or market should not be construed as recommending an investment strategy or transaction. Past performance is not a guarantee of future results.
Swissquote and its employees and representatives shall in no event be held liable for any damages or losses arising directly or indirectly from decisions made on the basis of this content.
The use of any third-party brands or trademarks is for information only and does not imply endorsement by Swissquote, or that the trademark owner has authorised Swissquote to promote its products or services.
Swissquote is the marketing brand for the activities of Swissquote Bank Ltd (Switzerland) regulated by FINMA, Swissquote Capital Markets Limited regulated by CySEC (Cyprus), Swissquote Bank Europe SA (Luxembourg) regulated by the CSSF, Swissquote Ltd (UK) regulated by the FCA, Swissquote Financial Services (Malta) Ltd regulated by the Malta Financial Services Authority, Swissquote MEA Ltd. (UAE) regulated by the Dubai Financial Services Authority, Swissquote Pte Ltd (Singapore) regulated by the Monetary Authority of Singapore, Swissquote Asia Limited (Hong Kong) licensed by the Hong Kong Securities and Futures Commission (SFC) and Swissquote South Africa (Pty) Ltd supervised by the FSCA.
Products and services of Swissquote are only intended for those permitted to receive them under local law.
All investments carry a degree of risk. The risk of loss in trading or holding financial instruments can be substantial. The value of financial instruments, including but not limited to stocks, bonds, cryptocurrencies, and other assets, can fluctuate both upwards and downwards. There is a significant risk of financial loss when buying, selling, holding, staking, or investing in these instruments. SQBE makes no recommendations regarding any specific investment, transaction, or the use of any particular investment strategy.
CFDs are complex instruments and come with a high risk of losing money rapidly due to leverage. The vast majority of retail client accounts suffer capital losses when trading in CFDs. You should consider whether you understand how CFDs work and whether you can afford to take the high risk of losing your money.
Digital Assets are unregulated in most countries and consumer protection rules may not apply. As highly volatile speculative investments, Digital Assets are not suitable for investors without a high-risk tolerance. Make sure you understand each Digital Asset before you trade.
Cryptocurrencies are not considered legal tender in some jurisdictions and are subject to regulatory uncertainties.
The use of Internet-based systems can involve high risks, including, but not limited to, fraud, cyber-attacks, network and communication failures, as well as identity theft and phishing attacks related to crypto-assets.
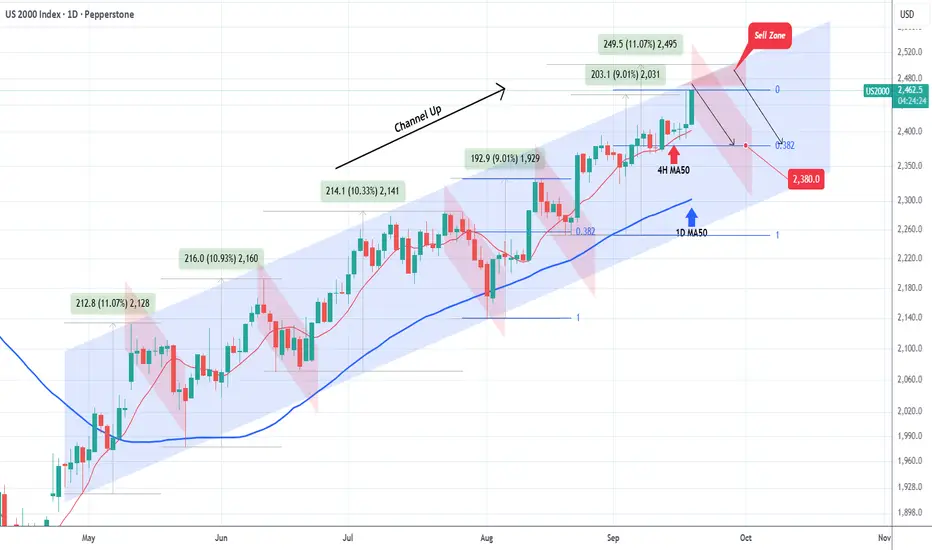
RUSSELL Will it correct this time also?Russell 2000 (RUT) has been trading within a Channel Up since late April and right now its current Bullish Leg is about to test the pattern's top (Higher Highs trend-line).
It has completed a +9.01% rise from the August 20 Low, which is the same increase of the previous (August 01 - 13) Bullish Leg and that has been the 'weakest' one out of all Legs of the Channel Up (+11.07%, +10.93% and +10.33% the others).
As a result, we can start thinking about taking profits on this run and an upcoming new pull-back (red Bearish Leg/ Channel Down) within a Sell Zone that extends up to +11.07% (2500).
Within this Zone, any rejection we get, we are targeting 2380, which is the 0.382 Fibonacci retracement level applied on the minimum +9.01% rally.
-------------------------------------------------------------------------------
** Please LIKE 👍, FOLLOW ✅, SHARE 🙌 and COMMENT ✍ if you enjoy this idea! Also share your ideas and charts in the comments section below! This is best way to keep it relevant, support us, keep the content here free and allow the idea to reach as many people as possible. **
-------------------------------------------------------------------------------
💸💸💸💸💸💸
👇 👇 👇 👇 👇 👇