US30 Eyes 47,200 for Potential BounceHey Traders, in today’s trading session we’re monitoring US30 for a potential buying opportunity around the 47,200 zone.
The Dow Jones continues to trade in a broader uptrend, and price action is currently in a correction phase, approaching the 47,200 support and resistance confluence area — a key z

DOW JONES approaching the end of its Bull Cycle?Dow Jones (DJI) has been trading within a 16-year Channel Up ever sine the March 02 2009 market bottom of the U.S. Housing Crisis. As this chart shows, we have divided this pattern into three different phases.
Since the March 2020 COVID crash, it appears that the Cycle got restarted as the index br

US30 Looking bearish trend a short-term ForecastThe US30 index has retested its recent highs, and a short-term pullback appears likely as the new trading week begins.
Technically, price action suggests that after reaching the top once again, the index may retrace to recover lost ground. Local investors are closely watching the midweek release of

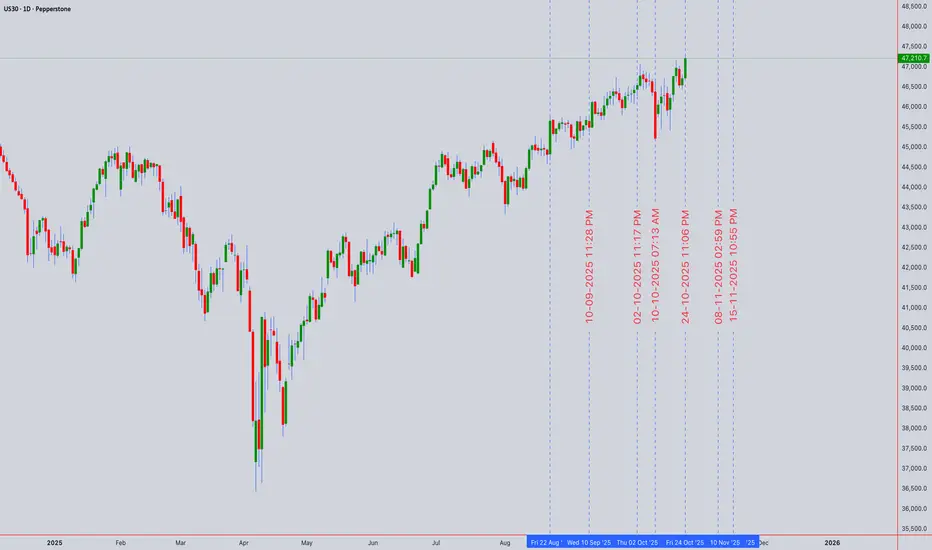
DJI (US30) SPOT TECHNICAL ANALYSIS 📊 DJI (US30) SPOT TECHNICAL ANALYSIS | Oct 27-31, 2025 | Intraday Swing Trading Blueprint 🚀
Current Price: 42,210.7 | Timeframe Focus: 5M, 15M, 30M, 1H, 4H & 1D ⏰
━━━━━━━━━━━━━━━━━━━━━━━━━━━━━━━━━━━━━━━━━━━━━━━
🔍 DAILY (1D) ANALYSIS - Swing Trade Framework
On the daily timeframe, DJI exhi
US30 Ready for shorts?Momentum on US30 is finally slowing. Character of price action is indicating short term shorts for a continuation of longs. Price is very overextended currently. I would have preferred a few pips in longs to major key level before sells, but current price action is hinting at shorts, and you do not

DowJones Key Trading LevelsKey Support and Resistance Levels
Resistance Level 1: 48085
Resistance Level 2: 48255
Resistance Level 3: 48500
Support Level 1: 47260
Support Level 2: 47040
Support Level 3: 46880
This communication is for informational purposes only and should not be viewed as any form of recommendation as

Dow Jones – Bearish Leg Expected Toward 46,500
After several attempts to hold above the 48,000 zone, the **Dow Jones Index (US30)** is showing clear signs of exhaustion on the higher timeframes.
The current market structure suggests a potential **corrective move toward 46,500**, which aligns with the 0.618 Fibonacci retracement level and prev

DOW JONES 30 HIGH PROBABILITY SETUP SOON!!!🚨 DJ30 HIGH PROBABILITY SELL SETUP 🚨
* Here We Can See Clearly The Next Potential Moves For US30 Coming Hours/Days.
* Keep Your Eyes Close On Your Trading Positions.
* Happy PIP Hunting Traders.
FXKILLA.

US30US30 has taken the top one more time, now we are expecting a Pullback to start this week.
Disclosure: We are part of Trade Nation's Influencer program and receive a monthly fee for using their TradingView charts in our analysis.

US30 Trade Set Up Oct 27 2025Price ended up making ATH in Asia session closing above PDH and creating a 4h FVG which has been filled along with Asia lows/SSL being swept so i am expecting price to continue bullish to London highs/BSL

See all ideas
Displays a symbol's price movements over previous years to identify recurring trends.
Frequently Asked Questions
Dow Jones Industrial Average Index reached its highest quote on Oct 24, 2025 — 47,327.60 USD. See more data on the Dow Jones Industrial Average Index chart.
The lowest ever quote of Dow Jones Industrial Average Index is 12,818.00 USD. It was reached on Dec 31, 2012. See more data on the Dow Jones Industrial Average Index chart.
Dow Jones Industrial Average Index is just a number that lets you track performance of the instruments comprising the index, so you can't invest in it directly. But you can buy Dow Jones Industrial Average Index futures or funds or invest in its components.