#IDX can be bullish trend next week ??Next week will be decisive by #IDX and supported by 2 potential bullish trends, where the candlestick pattern (cup and handle and bullish flag) that is formed clearly indicates a strengthening towards 7300.
but these 2 chart patterns will fail if next week they are under pressure and stay below 6850.
Trade ideas

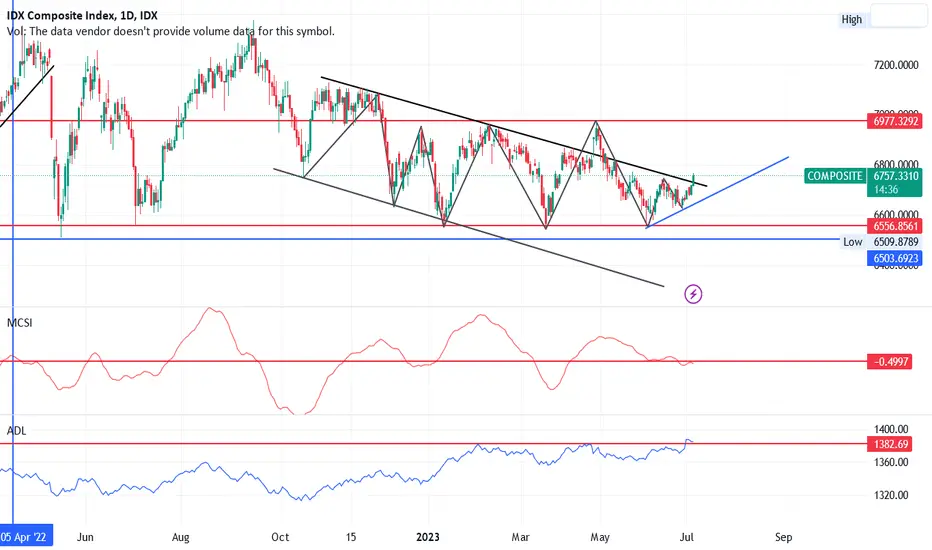
COMPOSITEIf We see period from 5 june to today 6 july, there is a symmetrical triangle pattern formed and
today's closing above the upper trend line of the symmetrical triangle. if the price is staying on this level, it's possible to reach next resistance on 6822.
If we assess using AD Line indicator, we can see that the ADline is recording a new high which means more stocks are following this trend
But if we see using McClellan Summation index, it shows the money havent entered the market yet which make the market will retrace for some time
so is composite will go higher or retrace for some time? only time will tell
@plan_trade_repeat
IDX Composite Index (IHSG) Swing Trend AnalysisJune 21th 2023 IDX Composite Index (IHSG) Swing Trend Analysis
This Analysis is Based on ICT/SMC Market Structure in Daily TF
The information I provide should not be considered as financial or investment advice. Forex trading involves significant risk, and it is important to conduct thorough research and seek advice from qualified professionals before making any trading decisions.


JCI and Yield Indonesia 10Yr are looking goodComposite is about to start its long term Uptrend while id10y is continuing Downtrend

Eyeing Sub 6500 IDR Amidst Potential Head and Shoulders Pattern.Keeping a close watch on the Indonesia Composite Index as it may approach sub 6500 IDR. If the downtrend continues, there is potential for a head and shoulders pattern to emerge.
Additionally, the low volume of the index should be taken into consideration. Will be monitoring closely for further developments and opportunities.

IDX Composite 27/02 - 04/02 IDX Composite is making a Correction Wave C
Just a simple & Quick Prediction using Fibo retrace and EW
Wish us a goodluck!
Havefun!
#DYOR


COMPOSITE, JKSE, IHSG Possibility CorrectionCOMPOSITE has breakdown from Ascending Triangle pattern, Next area at demand zone 5930-6150

market started positive today after closing at 6800 levelthroughout its movement, the JCI has been positive by moving away from support at 6752, closing also well at the 6800 level. today JCI will test resistance 6858 to 6911 with support at 6752 and 6683.
the market has left the support range 6509 - 6752, after the crash from the fall of GOTO, which impacted to several stocks, both bigcaps stocks to second tier stocks.

Weakening Target of Jakarta CompositeDisclaimer on,
This is a personal opinion, I am not responsible on your trading results.
Trade with your own risk.
For 6 months ( 13 May '22 - 06 Dec '22 ), the Composite Index moves in a huge sideways and forming the Bearish Pattern Flag, finally it decide one way to be chosen.
Unfortunately , its choice is to go down which is confirmed by broke the lower trendline and close below it ( 08 Dec '22 ). This action is confirming the Bearish Flag Pattern which is mean then the price will be going down.
I assume:
- The first target of declining is the 6440 - 6450 level (1.0 Fibonacci Extension ratios and classic Support area).
- The lowest target of this decline is the 6140 - 6180 level, because there is a gap that needs to be closed at the levels 6160 - 6180 which was formed on 30 sept '21 . This assumption is reinforced by the accumulation of 1,618 Fibonacci Retracement and Fibonacci Extension ratios plus classic support area.
"Fasten your Seatbelt, and get ready to BOW"
Follow me for next update
___________
Best regards, @riandwip686

IDX Analysis....................................Downward trend analysis of IDX....................................

Return Comparison: Bitcoin, Jakarta Composite Index, and GoldReturn Comparison: Bitcoin, Jakarta Composite Index, and Gold

When Stock Market and Bond Market move South togetherComposite Index is still moving sideways but it has potential to continue upward direction.
ID10Y or Bond also is breaking out the down trendline which mean the yield is continuing upward direction too.
Composite is Bullish, ID10Y is Bearish.

Crash Potential 2026Two Fib. Resistance, 2026 is 18 years after 2008 crisis.
And i think the big trap will happen between 8500-9500 range.

Current Rise of JCI :I separate Big Caps stocks of JCI into 3 categories : Big Bank (BBCA, BBRI, BMRI and BBNI), Others (ASII and TLKM) and Consumer (INDF, ICBP and UNVR).
During 2022, the graphs is showing that Consumer stocks behave as Defensive Stocks that holds JCI during the bad time while Big Bank and Others lead JCI.
Recent rally of JCI shows that Big Bank and Others (once again) become leading stocks while Consumer become balancing stocks.

IHSG - 23 Mei 2022IHSG after set high record in 7354.08, got corrections by breaking ascending wedge pattern from 7246 and hit the TARGET 1 to 6596 (5% from body ascending wedge).
After that, breaking down the ascending channel and found support at 6511 (wave A), rebound to support that flip as resistance at 6957 (wave B). if we break support 6860, then probability the drop will continue to TARGET 2 to 6262 (wave c).

IHSG on supply areaThe price retest last resist at 7100 area. I recommend to wait until the market make new low at 6800 area to buy.


IHSGTechnical analysis is a trading discipline employed to evaluate investments and identify trading opportunities by analyzing statistical trends gathered from trading activity, such as price movement and volume.

Big Caps of Composite MonitoringI monitor the big caps stocks that very much become the core of Composite.
The stocks are : BBCA, BBRI, BMRI, BBNI, ASII, TLKM, INDF, ICBP and TLKM.
I excluded GOTO because it has no enough previous movement.
I didn't include HMSP and GGRM because of their low Free Market Weighted.
Banking Stock near its Support while ASII+TLKM is has room to fall before meeting their Support.
Consumer Stocks is still Uptrend and could provide cushion and relatively hold Composite for falling too deep.

Feeling Bear for JKSEThe inflation situation right now impacted to Indonesia Stock Market, yet I think JKSE will eventually moving to a bear trend.
My personal view using elliott wave, JKSE will reach the area of 6050 - 6236 sooner or later.
DYOR

