Dow rolls over, shifting directional risksDirectional risks in the Dow Jones contract appear more balanced following the break of uptrend support earlier this week, a view supported by momentum indicators such as RSI (14) and MACD, which have also rolled over, delivering a neutral signal. More weight should be placed on price action in the near term rather than maintaining a specific bias.
If the price can hold above support at 45,762, longs could be established above the level with a stop beneath for protection, targeting the record high of 46,723 set earlier this month. Should the uptrend break lead to an extension of the bearish move beneath 45,762, the setup could be flipped, with shorts placed below the level and a stop above for protection. The 50DMA, 45,000 or 44,500 screen as potential targets.
Good luck!
DS
DOW trade ideas

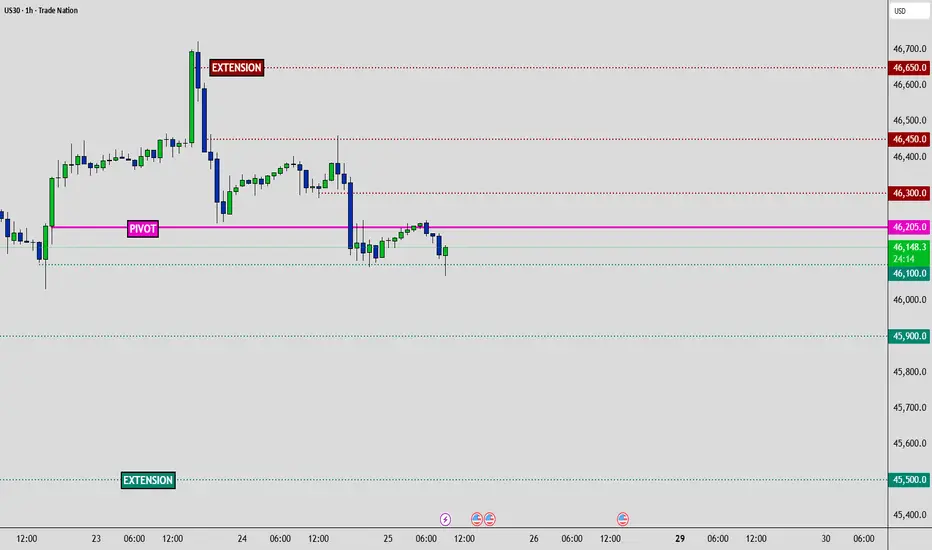
US30 - 2 Day Traders Edge📈Technical:
MARKET BIAS: Neutral-Bullish above PIVOT (holding above HVN level, testing resistance)
PIVOT ZONE: 46,205 (Current HVN magnet)
🥇 Traders Edge - Actionable & Tactical
TRADE SETUPS:
🟧 Risk Warning: Core PCE surprise = 200+ point moves
↕️ Bias Flip: Break below 46,100 (bearish) | above 46,450 (bullish)
🟢BULLISH Potential if PIVOT holds -
• Bounce from Pivot area 46300 | 46450
• Stop Loss: 46,050
🔴BEARISH Potential -
• Look for SHORT Entries: Rejections at 46300 and/or below PIVOT @ 46205
• Take Profit: 45900 | 45500 Extended Breakdown
• Stop Loss: Above 46300
🎯KEY LEVELS:
• Strong Resistance: 46,300 | 46,450 | 46,650
• Strong Support: 46,100 | 45,900 | 45,700 | 45,500
🎯PRICE TARGETS:
• Bullish Path: 46,300 → 46,450 → 46,650 (Extended breakout)
• Bearish Path: 46,100 → 45,900 → 45,500 (Extended breakdown)
🚨HIGH-IMPACT EVENTS (48H): (NY Time Zone)
• Sep 25 | 08:30 Core Durable Goods: -0.1% vs 1.1% → Manufacturing health
• Sep 25 | 08:30 GDP Q2 Final: 3.3% vs -0.5% → Growth = equity bullish
• Sep 26 | 08:30 Core PCE MoM: 0.2% vs 0.3% → RATE REPRICING RISK
• Sep 26 | 08:30 Personal Income: 0.3% vs 0.4% → Corporate earnings proxy
🛑 MASTER RISK EVENT
🟧Friday September 26 | 08:30 (NY Time Zone)
🟧 Core PCE Price Index (MoM) - Forecast: 0.2% vs Previous: 0.3%
🟧 Critical Impact: Fed's preferred inflation gauge determines rate path and USD strength
• Gold: Collapse risk if hot print
• Equities: Rate repricing volatility
• Sectors: Tech rotation sensitivity
⚠️ RISK MANAGEMENT PROTOCOL
• Reduce position sizes before Friday 08:30 EDT
• USD strength reversals impact Gold heavily
• Tech high beta to rate repricing
• Month-end flows amplify volatility
________________________________________
Analysis based on Session Volume POC clusters and HVN methodology
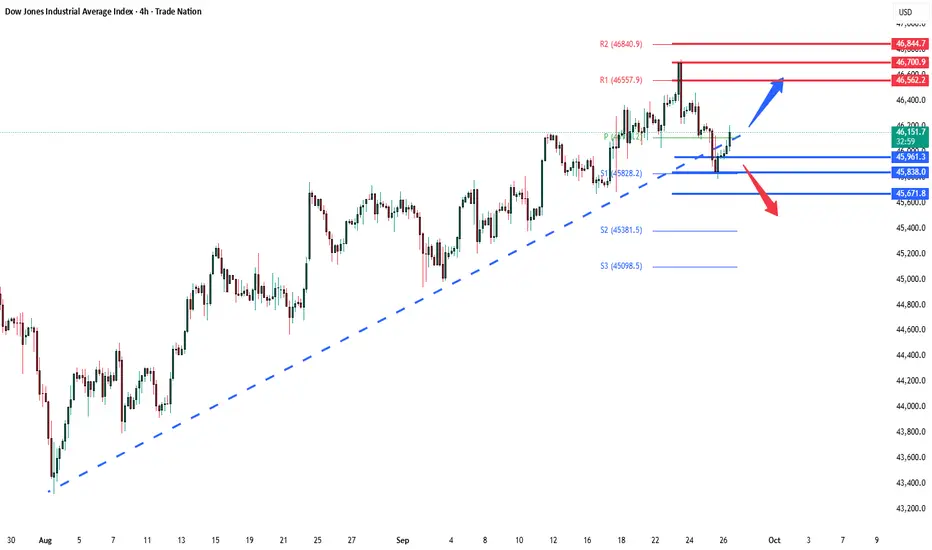
DowJones Key Trading levelsKey Support and Resistance Levels
Resistance Level 1: 46560
Resistance Level 2: 46700
Resistance Level 3: 46850
Support Level 1: 45960
Support Level 2: 45840
Support Level 3: 45670
This communication is for informational purposes only and should not be viewed as any form of recommendation as to a particular course of action or as investment advice. It is not intended as an offer or solicitation for the purchase or sale of any financial instrument or as an official confirmation of any transaction. Opinions, estimates and assumptions expressed herein are made as of the date of this communication and are subject to change without notice. This communication has been prepared based upon information, including market prices, data and other information, believed to be reliable; however, Trade Nation does not warrant its completeness or accuracy. All market prices and market data contained in or attached to this communication are indicative and subject to change without notice.
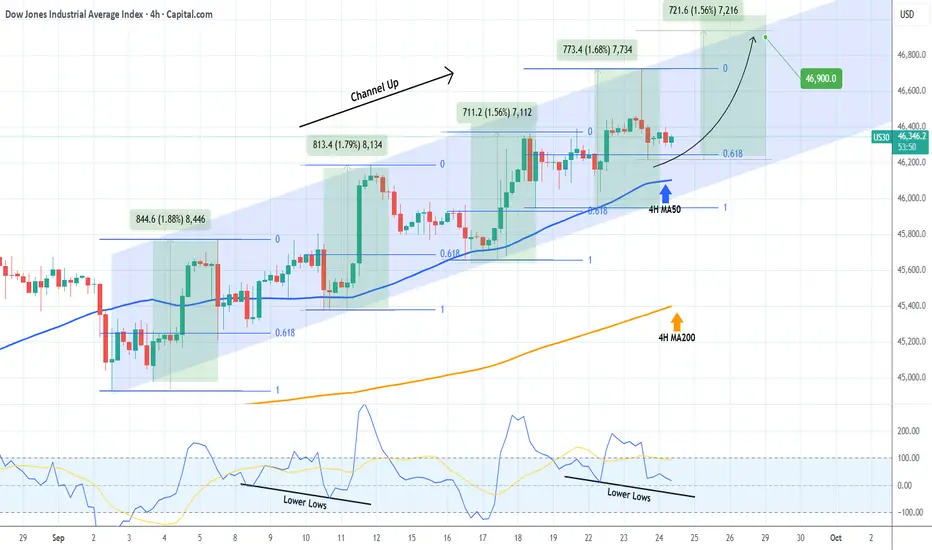
DOW JONES forming a bottom ahead of the next rally.Dow Jones (DJI) has been trading within a Channel Up since the start of September and right now it is consolidating after having hit the 0.618 Fibonacci retracement level, following a Higher High rejection at the top of the pattern.
As you can see, the 0.618 Fib was always pull-back tested after a Higher High, with the 4H MA50 (blue trend-line) also or at least coming very close to. As a result, the current 4H candle consolidation is technically a bottoming process before the new Bullish Leg.
The weakest Bullish Leg of this Channel Up has been +1.56%, which more than covers our 46900 Target.
-------------------------------------------------------------------------------
** Please LIKE 👍, FOLLOW ✅, SHARE 🙌 and COMMENT ✍ if you enjoy this idea! Also share your ideas and charts in the comments section below! This is best way to keep it relevant, support us, keep the content here free and allow the idea to reach as many people as possible. **
-------------------------------------------------------------------------------
💸💸💸💸💸💸
👇 👇 👇 👇 👇 👇
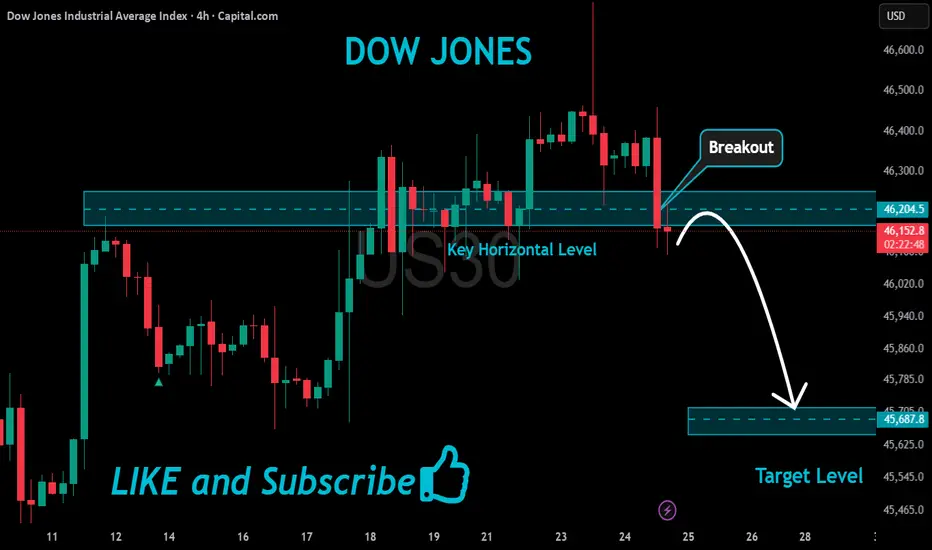
US30 Bearish Breakout!
HI,Traders !
#US30 made a bearish
Breakout of the key horizontal
Level of 46203.3 which is now
A resistance and the breakout
Is confirmed so we are bearish
Biased and we will be expecting
A further move down !
Comment and subscribe to help us grow !
Dow Oversold bounce back?Key Support and Resistance Levels
Resistance Level 1: 46560
Resistance Level 2: 46700
Resistance Level 3: 46850
Support Level 1: 45960
Support Level 2: 45840
Support Level 3: 45670
This communication is for informational purposes only and should not be viewed as any form of recommendation as to a particular course of action or as investment advice. It is not intended as an offer or solicitation for the purchase or sale of any financial instrument or as an official confirmation of any transaction. Opinions, estimates and assumptions expressed herein are made as of the date of this communication and are subject to change without notice. This communication has been prepared based upon information, including market prices, data and other information, believed to be reliable; however, Trade Nation does not warrant its completeness or accuracy. All market prices and market data contained in or attached to this communication are indicative and subject to change without notice.

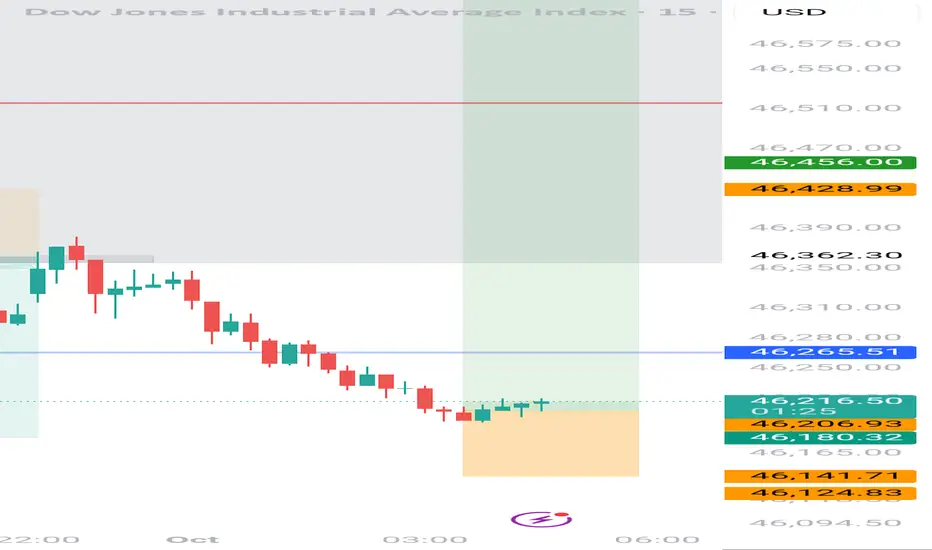
Us30 Trade Set Up Sep 30 2025Price is making HH/HL now so structure is bullish. I will want to see a close above the 15m FVG for price to go higher into the 4h FVG and higher to PDH
www.tradingview.com

DowJones Key Trading Levels Key Support and Resistance Levels
Resistance Level 1: 46560
Resistance Level 2: 46700
Resistance Level 3: 46850
Support Level 1: 45960
Support Level 2: 45840
Support Level 3: 45670
This communication is for informational purposes only and should not be viewed as any form of recommendation as to a particular course of action or as investment advice. It is not intended as an offer or solicitation for the purchase or sale of any financial instrument or as an official confirmation of any transaction. Opinions, estimates and assumptions expressed herein are made as of the date of this communication and are subject to change without notice. This communication has been prepared based upon information, including market prices, data and other information, believed to be reliable; however, Trade Nation does not warrant its completeness or accuracy. All market prices and market data contained in or attached to this communication are indicative and subject to change without notice.
US30 - Bullish PUSHI definitely see US30 fighting to crash. But I do see another push to the upside.
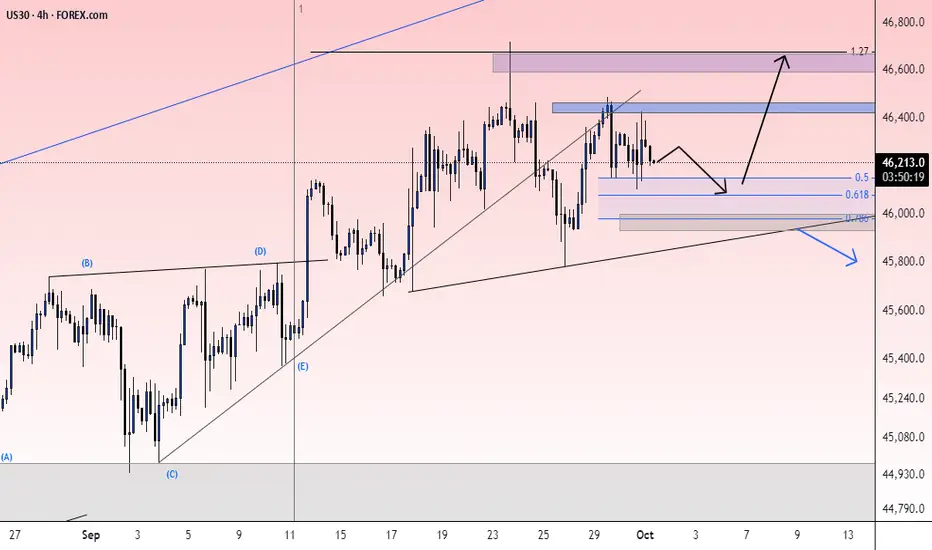
US30 4H🔹 Overall Outlook and Potential Price Movements
In the charts above, we have outlined the overall outlook and possible price movement paths.
As shown, each analysis highlights a key support or resistance zone near the current market price. The market’s reaction to these zones — whether a breakout or rejection — will likely determine the next direction of the price toward the specified levels.
⚠️ Important Note:
The purpose of these trading perspectives is to identify key upcoming price levels and assess potential market reactions. The provided analyses are not trading signals in any way.
✅ Recommendation for Use:
To make effective use of these analyses, it is advised to manually draw the marked zones on your chart. Then, on the 15-minute time frame, monitor the candlestick behavior and look for valid entry triggers before making any trading decisions.

Us30 US30 is approaching a key demand zone where strong buying pressure has previously emerged. If buyers step in again, we could see a bullish reversal or continuation. However, a clean break below this zone may indicate weakening momentum and open the door to further downside.

US30 Analysis (Short Bias)I expect US30 to remain bearish this week. Current price action suggests weakness, with momentum favoring sellers. If market conditions hold, we may see a continuation to the downside, and today’s session is also likely to close bearish. A short position looks favorable at this point, but as always, risk management is key.
The last week’s predictions toyed with my analysis, but this week might just be the setup for a stronger sell opportunity.

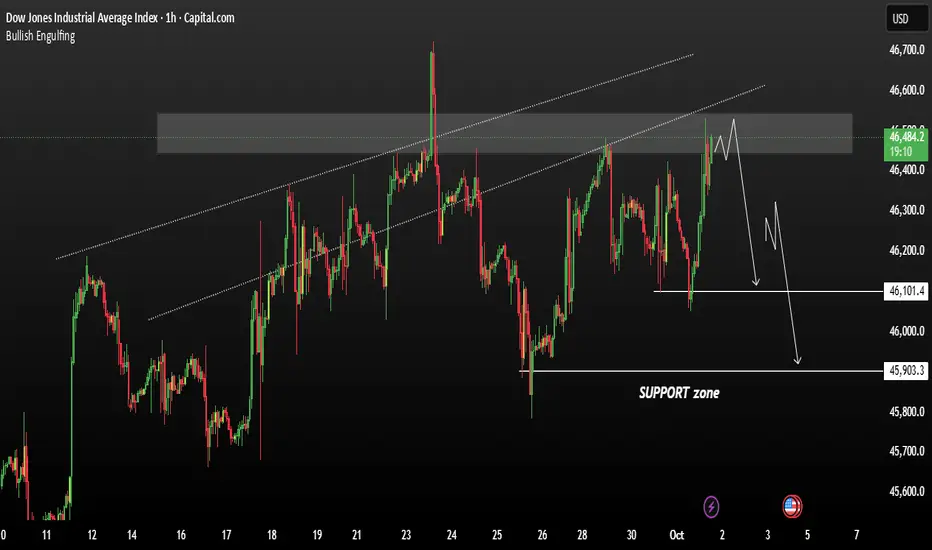
US30 currently consolidating near a key resistance zone US30 is currently consolidating near a key resistance zone likely around the yearly high / major supply level. This resistance has already been tested once previously, where price reversed downward sharply — showing sellers are active here The current sideways movement suggests the market is indecisive or absorbing liquidity before a larger move. If bearish momentum builds, potential support zone we could expect downside target 46,100 – 45,900 falling Range.
You may Find more details in the chart.
Trade wisely Best Of Luck.
Ps. Support with like and comments for better analysis Thanks for Supporting.
Is the Dow Jones still bullish? Yes.
Hello everyone
I think Dow Jones has the potential to grow further and if the conditions set in the figure below are met, it can be said that it can easily reach the set target. What do you think, friend? Leave me a comment

US30 DropsUS30 looks bearish on the M30 timeframe with one price target of 46,108.7 and a bias of 46,002.2.
The setup will be invalidated if the price breaches 46,463.5, which is derived from bearish pressure at the H4 to Daily resistance.
The high at 46,363.4 is held by the 46,417 area zone, and the bulls' momentum is also challenged by the bearish highs at 46,353.8. Overall, the sentiment is therefore bearish.
Happy Trading,
K.
Not trading advice

Looking to SHORT US30Thou we are in a Bullish Trend and All time High which might be difficult to time or predict the local top or major Resistance level, however IMO we have been moving up with a Rising Wedge Pattern on the daily which symbolize a potential "Massive Pullback"

check the trend It is expected that the correction process at the specified support levels will end and then we will witness a change in trend.
If the support range is broken, the continuation of the downward trend is likely.
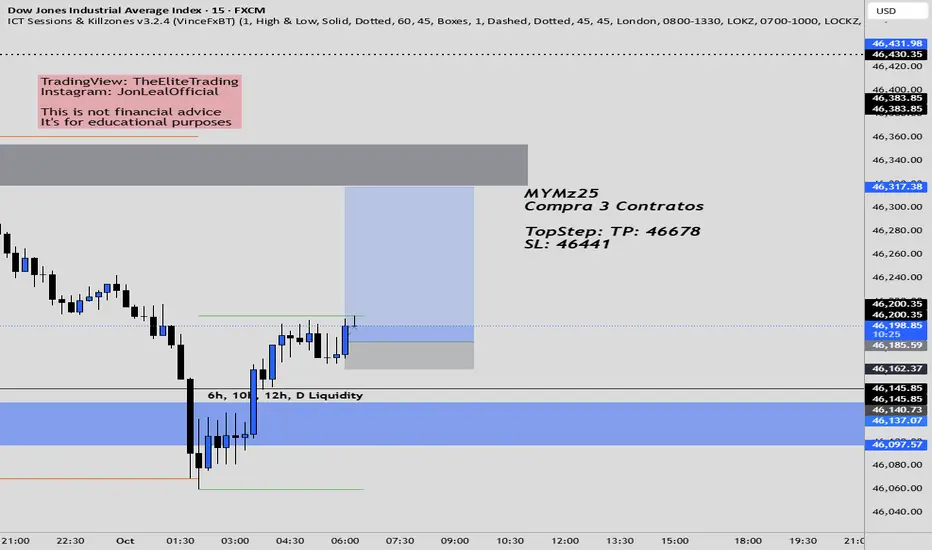
US30: Bearish Continuation & Short Trade
US30
- Classic bearish setup
- Our team expects bearish continuation
SUGGESTED TRADE:
Swing Trade
Short US30
Entry Point - 46297
Stop Loss - 46377
Take Profit - 46148
Our Risk - 1%
Start protection of your profits from lower levels
Disclosure: I am part of Trade Nation's Influencer program and receive a monthly fee for using their TradingView charts in my analysis.
❤️ Please, support our work with like & comment! ❤️

Us30 Trade Set Up Sep 26 2025Price pushed up from the daily FVG yesterday and has formed a 4h bearish FVG which acts has imbalance to be filled to if price continues to make internal bullish structure i will look for buys to target 50% of the 4h FVG/PDH
www.tradingview.com


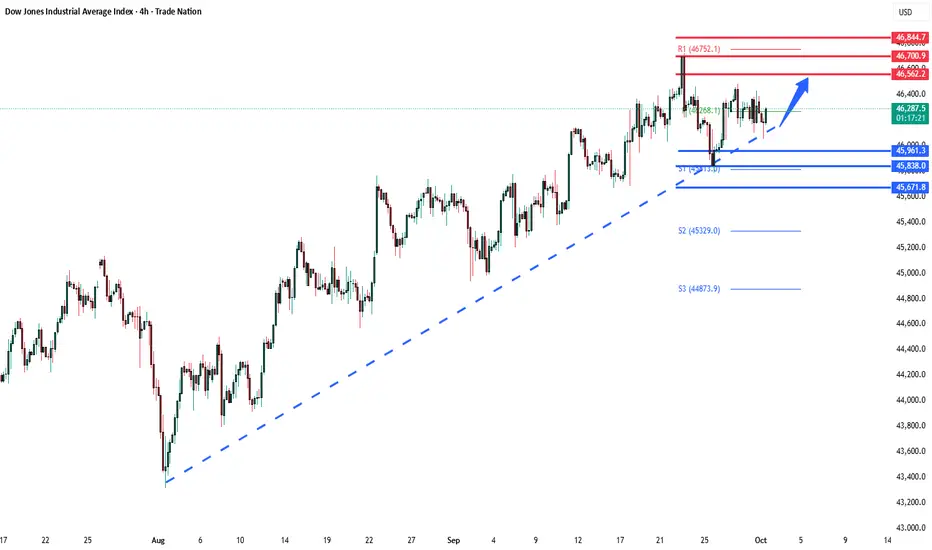
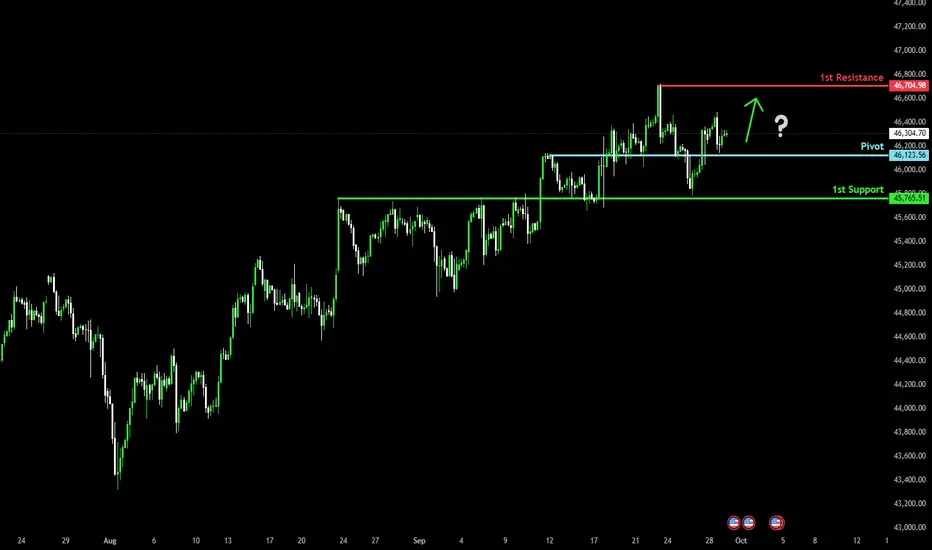
Bullish momentum to extend?Dow Jones (US30) has bounced off the pivot which has been identified as an overlap support and could bounce to the 1st resistance which is a swing high resistance.
Pivot: 46,123.56
1st Support: 45,765.51
1st Resistance: 56,704.98
Disclaimer:
The above opinions given constitute general market commentary, and do not constitute the opinion or advice of IC Markets or any form of personal or investment advice.
Any opinions, news, research, analyses, prices, other information, or links to third-party sites contained on this website are provided on an "as-is" basis, are intended only to be informative, is not an advice nor a recommendation, nor research, or a record of our trading prices, or an offer of, or solicitation for a transaction in any financial instrument and thus should not be treated as such. The information provided does not involve any specific investment objectives, financial situation and needs of any specific person who may receive it. Please be aware, that past performance is not a reliable indicator of future performance and/or results. Past Performance or Forward-looking scenarios based upon the reasonable beliefs of the third-party provider are not a guarantee of future performance. Actual results may differ materially from those anticipated in forward-looking or past performance statements. IC Markets makes no representation or warranty and assumes no liability as to the accuracy or completeness of the information provided, nor any loss arising from any investment based on a recommendation, forecast or any information supplied by any third-party.
DJI moving according to the same analysis I chartedThis is an update to the same one mentioned, the target 53300-54000
