FTSE 100 Outlook: Twin Bullish Signals Point to Fresh HighsFresh record highs for the FTSE 100 contract may be on the cards, with consecutive bullish signals pointing to growing upside risks.
The first arrived on Friday with a hammer candle on the daily chart, rebounding strongly after testing the 50-day moving average. That was followed on Monday by anoth
About FTSE 100 Cash (£10)
The FTSE UK Index Series is designed to represent the performance of UK companies, providing market participants with a comprehensive and complementary set of indices that measure the performance of all capital and industry segments of the UK equity market.

FTSE breakout support at 9445The FTSE remains in a bullish trend, with recent price action showing signs of a breakout within the broader uptrend.
Support Zone: 9445 – a key level from previous consolidation. Price is currently testing or approaching this level.
A bullish rebound from 9445 would confirm ongoing upside momentu

UK100 - TIME TO KILL Team, yesterday we did well with the AUS200 short position. couple of times.
Today we focus on SHORTING THE UK100 AT THIS LEVEL 9515-22
STOP LOSS at 9580
Target 1 at 9486-72 - TAKE PARTIAL 50-70%
Target 2 at 9465-56
NOTE: Once the price below 9492, bring stop loss to BE
lets go

FTSE 100 Wave Analysis – 20 October 2025
- FTSE 100 reversed from key support level 9330.00
- Likely to rise to resistance level 9600.00
FTSE 100 index recently reversed from the support area between the key support level 9330.00 (former strong resistance from August and September), 50% Fibonacci correction of the upward impulse from Se

Price Action Key for FTSE 100With momentum indicators generating neutral signals and the price resting on support, there are numerous two-way trades to consider in the FTSE 100 contract.
9360 is the level to watch in the short term, coinciding with the high set on August 22. Since being established, it has provided resistance

FTSE corrective pullback supported at 9365The FTSE remains in a bullish trend, with recent price action showing signs of a breakout within the broader uptrend.
Support Zone: 9365 – a key level from previous consolidation. Price is currently testing or approaching this level.
A bullish rebound from 9365 would confirm ongoing upside momentu

Trendline break The price has broken out of a bearish trendline which was a consolidation as the price is still in a bullish trend, the price now looks to make a small pullback then, we expect a bullish impulse
WE ONLY TRADE PULLBACKS
Comment your thoughts

INTRADAY ascendinc triangle Monday close in break out, tuesday ascending triangle build in 3 session

FTSE 100 (UKX) | Targeting 17K → 23K → 50K The British Bull Awakens 🏴📈 | The British Bull Awakens 🏴📈 | The British Bull Awakens 🏴📈
Macro Wave 3 of SuperCycle 3 in full motion — 17K next, then 23K before Wave 4 reset and grand finale 50K .
The FTSE 100 is mid-way through its most powerful Elliott Wave phase in decades — Macro

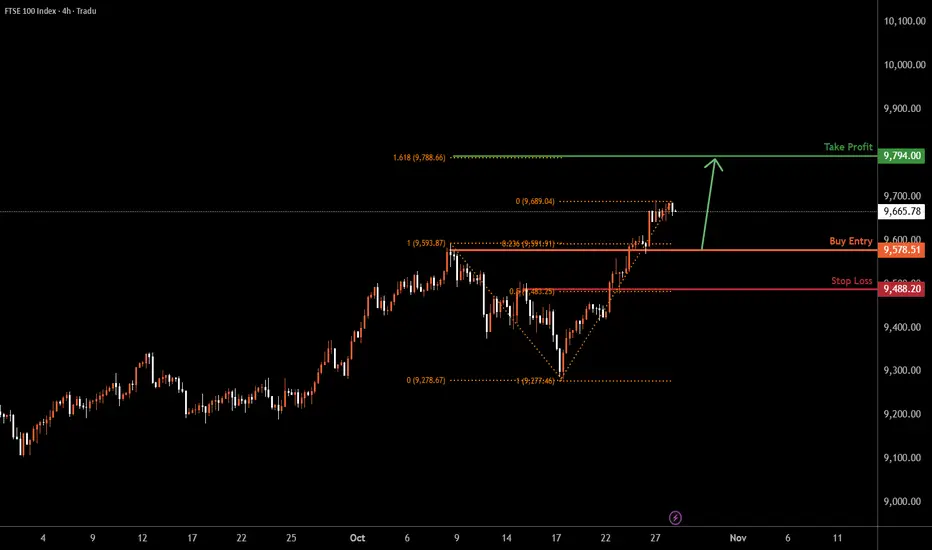
UK100 H4 | ullish Bounce off Pullback SupportUK100 is falling towards the buy entry, which is a pullback support that lines up with the 23.6% Fibonacci retracement and could bounce from this level to the upside.
Buy entry is at 9,578.51, which is a pullback support that aligns with the 23.6% Fibonacci retracement.
Stop loss is at 9,488.20, w
See all ideas
Displays a symbol's price movements over previous years to identify recurring trends.
Frequently Asked Questions
FTSE 100 Cash (£10) reached its highest quote on Oct 24, 2025 — 9,656.9 GBP. See more data on the FTSE 100 Cash (£10) chart.
The lowest ever quote of FTSE 100 Cash (£10) is 2,949.4 GBP. It was reached on Jan 23, 1995. See more data on the FTSE 100 Cash (£10) chart.
FTSE 100 Cash (£10) is just a number that lets you track performance of the instruments comprising the index, so you can't invest in it directly. But you can buy FTSE 100 Cash (£10) futures or funds or invest in its components.