Up Up Up... Nothing Can Stop NAS From RisingLet's take a look at the big picture in the NASDAQ: Do you see how nicely the spring crash landed on the 50% retracement of the upward movement since fall 2022?
Now that we've crossed the old ATH, the targets are clear, and they're way up in the NASDAQ.
The summer correction is therefore likely to fail and probably turn into a listless sideways slide. By September at the latest, however, the NAS should pick up speed again and head for targets between 25,000 and 26,000 - at the very least.
Clear skies!
NASDAQ trade ideas

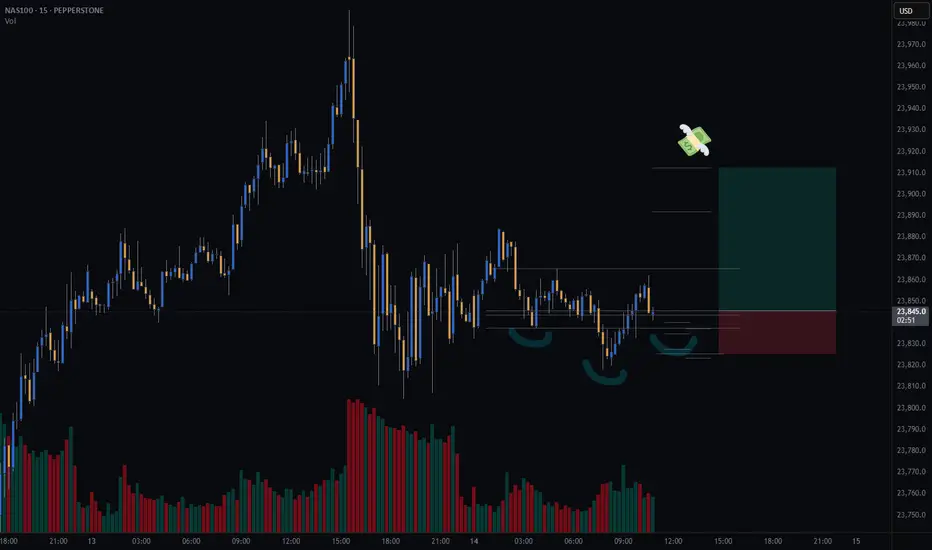
Update on the Nasdaq trade idea I shared last night.An update on the trade idea of NASDAQ last night where I was anticipating a buy from the marked zone with other possible Point Of Interested marked out aswell.
Price behaved exactly the way I was anticipating, even though it hasn't went really far as of yet.
NAS100 – Potential Short Setup After Sharp RallyOn the 5-minute chart, NAS100 has made a strong upward move following a sharp drop earlier in the session.
Price is now approaching a potential exhaustion point near 23,940–23,960. I expect a reversal from this zone, followed by a move back toward 23,725 and possibly lower.
Trade Plan:
Sell Entry: 23,940–23,960 zone after confirmation
Stop-Loss: Above 23,960
Take-Profit: 23,725 initial target; further downside possible if momentum continues
Notes:
Watch for reversal candlestick patterns or break of short-term structure before entering.
This setup is based on intraday momentum and may require fast execution.

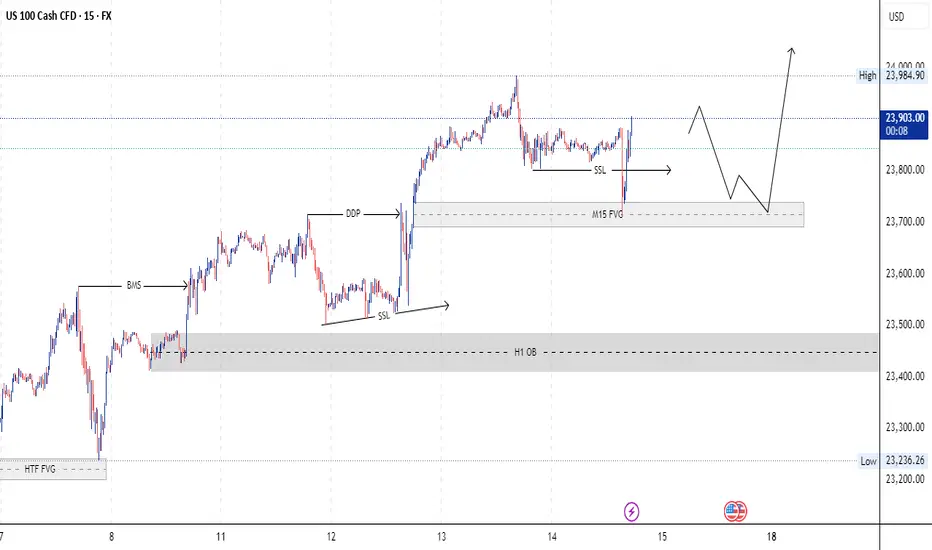
Potential inverse head and shoulders on NASDAQ (CASH100) - 15minI’m watching the Cash100 for a potential long setup.
On the 15min chart, an inverse head and shoulders pattern appears to be forming — potentially a continuation pattern following this week’s strong upward move.
I’m still waiting for confirmation of key variables, which will be assessed at 11:30am (GMT+1).
Trade Details:
📊 Risk/Reward: 2.4
🎯 Entry: 23 845
🛑 Stop Loss: 23 825
💰 Take Profit 1 (50%): 23 891
💰 Take Profit 2 (50%): 23 912
#GTradingMethod Tip: Lower volume on the right shoulder vs. the left shoulder strengthens the setup.
Please note: This is not financial advice. This content is to track my trading journey and for educational purposes only.
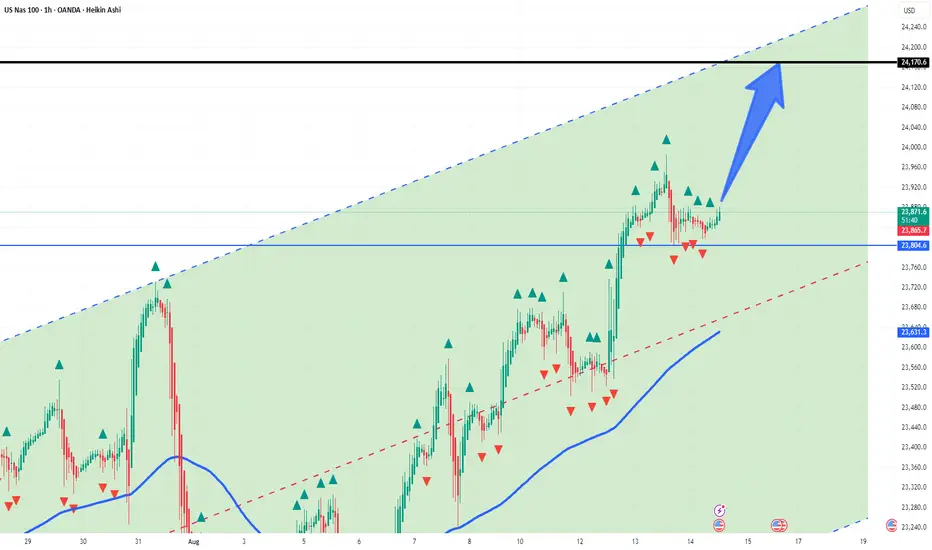
NAS100 — Nasdaq 100 Index Holds Ascending ChannelMarket Overview:
On the 1H chart, NAS100 continues to move within an ascending channel, holding support at 23,804. EMA144 (23,631) remains the key dynamic support. The upside target is the upper channel boundary near 24,170.
Technical Signals & Patterns:
Ascending channel;
EMA144 as dynamic support;
Series of higher lows;
Steady hold above 23,804 level.
Key Levels:
Support: 23,804, 23,631
Resistance: 24,170
Scenario:
Primary: holding above 23,804 could lead to growth toward 24,170.
Alternative: a break below 23,804 and EMA144 may trigger a decline to 23,631.
USNAS100 | Holding Above ATH – Key Pivot at 23870USNAS100 at Record Highs on Fed Rate Cut Hopes
Nasdaq indexes held at record highs on Wednesday, supported by growing confidence that the Federal Reserve could restart its monetary policy easing cycle next month.
Technical Outlook:
The price has stabilized in a bullish trend after breaking its all-time high, with a 4H candle closing above it on strong volume.
As long as it trades above 23870, the bullish trend remains intact toward 24090.
To turn bearish, the price would need to close at least 1H below 23870, targeting 23690.
Resistance: 24090, 24190
Support: 23690, 23430

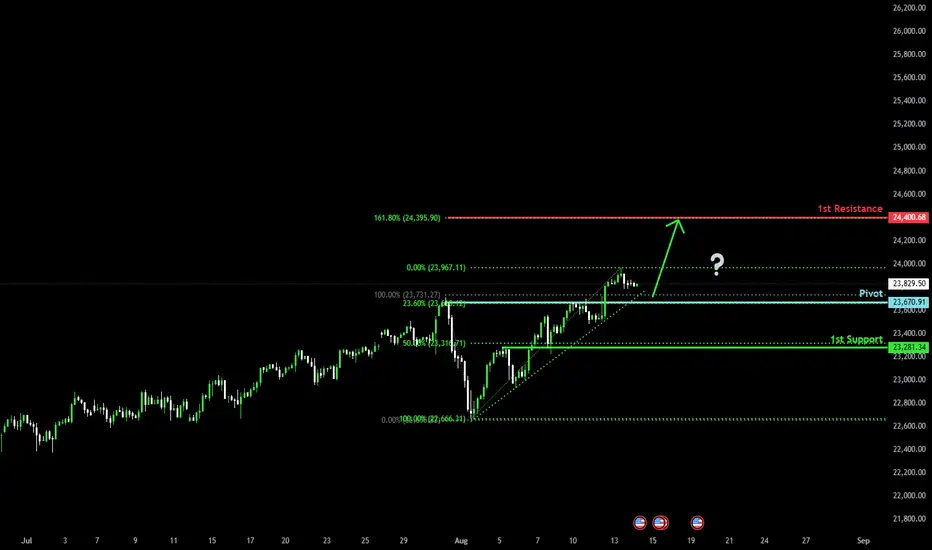
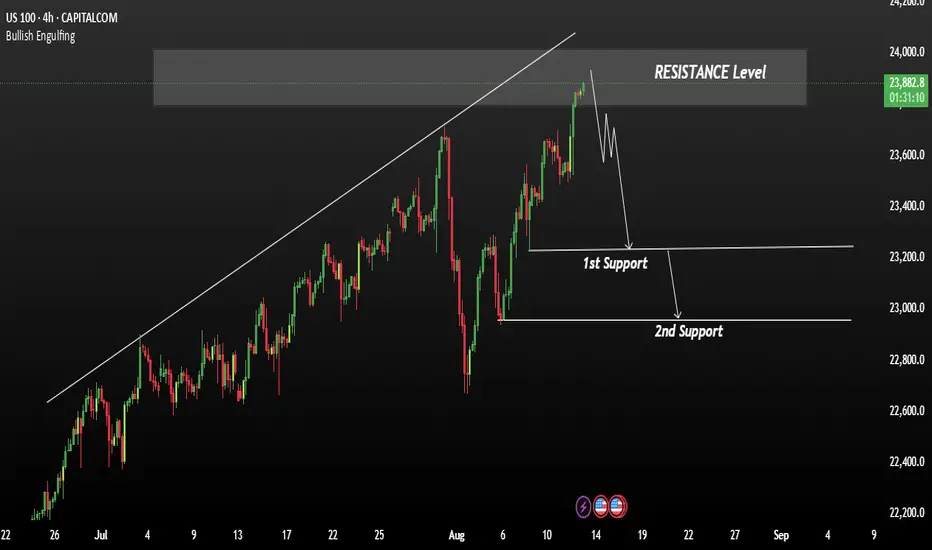
Bullish continuation?USTEC is falling towards the pivot which has been identified as a pullback support and could bounce to the 1st resistance.
Pivot: 23,670.91
1st Support: 23,281.34
1st Resistance: 24,400.68
Risk Warning:
Trading Forex and CFDs carries a high level of risk to your capital and you should only trade with money you can afford to lose. Trading Forex and CFDs may not be suitable for all investors, so please ensure that you fully understand the risks involved and seek independent advice if necessary.
Disclaimer:
The above opinions given constitute general market commentary, and do not constitute the opinion or advice of IC Markets or any form of personal or investment advice.
Any opinions, news, research, analyses, prices, other information, or links to third-party sites contained on this website are provided on an "as-is" basis, are intended only to be informative, is not an advice nor a recommendation, nor research, or a record of our trading prices, or an offer of, or solicitation for a transaction in any financial instrument and thus should not be treated as such. The information provided does not involve any specific investment objectives, financial situation and needs of any specific person who may receive it. Please be aware, that past performance is not a reliable indicator of future performance and/or results. Past Performance or Forward-looking scenarios based upon the reasonable beliefs of the third-party provider are not a guarantee of future performance. Actual results may differ materially from those anticipated in forward-looking or past performance statements. IC Markets makes no representation or warranty and assumes no liability as to the accuracy or completeness of the information provided, nor any loss arising from any investment based on a recommendation, forecast or any information supplied by any third-party.
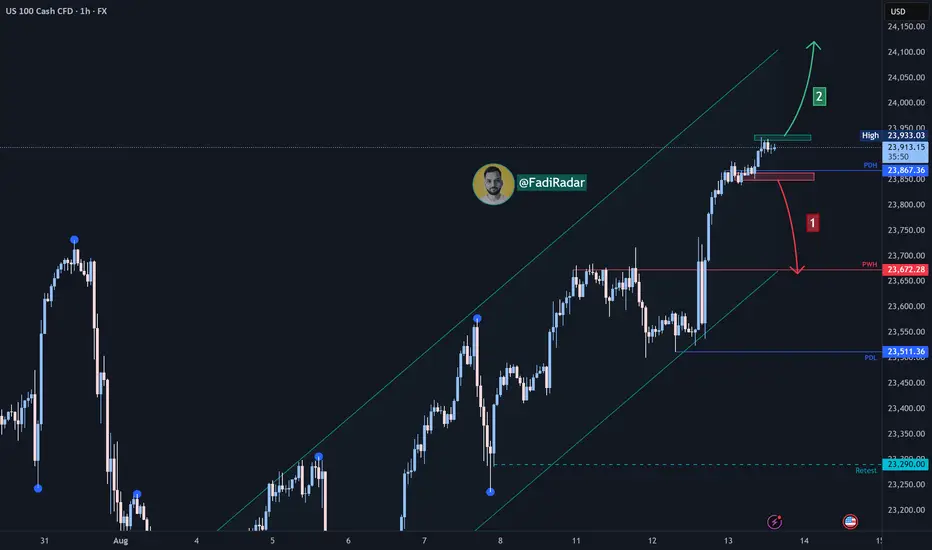
NASDAQ H1 BUYING CHANNEL Buy Nasdaq Channel ?
Buy Gold At Nasdaq FVG
Buying Structre #NASDAQ
Buy At FVG

NAS100 - Potentiatl TargetsDear Friends in Trading,
How I see it,
Stocks are roaring with the cooling inflation report.
September "IR CUT" certainty driving markets at this time.
I sincerely hope my point of view offers a valued insight
Thank you for taking the time study my analysis.

NAS100 SELL ANALYSISThis is an idea of the sale given that we have Reversal confirmed by structure and FIb measurements, looking for short sells to the Daily Fib then will look for Buys for a possible reversal to the Upside.

Nasdaq Trade IdeaAnticipating for longs on this one. Looking at the overall direction of Market Makers, looks like they might still push up considering other factors reviewed also.
US100 A Waiting Reject from resistanceThe market is currently watching for a rejection from the top resistance zone. Sentiment improved after the US and China extended their tariff truce until November 10, avoiding triple-digit duties on each other’s goods.
2.8% or higher reading likely supports a bearish move toward 23,250 and then 23,950mBelow 2.8% reading → could fuel bullish momentum toward a new ATH at 23,900.
You may find more details in the chart.
Trade wisely best of Luck Buddies.
Ps; Support wit like and comments for better analysis Thanks.
BUY EVERY BIG TECH, BUY AND HOLD UNTIL OCTOBERBuy the pivot level. hold for the last 7-month bull run until October 2025.
Price and time cycles suggest that price will peak in October 2025 and a second swing high in March 2026 for the midcycle correction. We would look for the top at 26k
Buy every big tech, buy the major stocks, buy, buy......
The 7-month cycle from March to October 2025 will be the second largest swing within the 5-year bull run from 2020 crash low
Trade safe, good luck.

US100 Trade Idea – Risking 1% for Potential 5% Gain 13/8/2025
I trade with a fixed 1:5 risk–reward ratio, focusing on setups that offer asymmetric profit potential. My approach emphasizes precise entries, strict risk management, and the patience to let trades reach their full potential.
This method allows me to risk small while aiming for meaningful gains, keeping my results consistent and sustainable over time. Trading, for me, is as much about mindset as it is about method — staying calm, following the plan, and letting probabilities work in my favor.
Disclaimer: This is purely an idea shared for educational purposes. I take no responsibility for any financial decisions you make. Please assess it carefully and adapt it to your own trading plan before acting.

NASDAQ (CASH100) is Approaching KEY ResistanceSince 15 May, the Cash100 has been trading within an upward channel.
It’s now approaching diagonal resistance — will it hold, or break higher?
On the chart, I have marked every time NAS has tested the diagonal resistance and failed to break through.
I’ll be watching this area closely for shorts.
What do you think: will NAS continue climbing, or is a reversal coming?


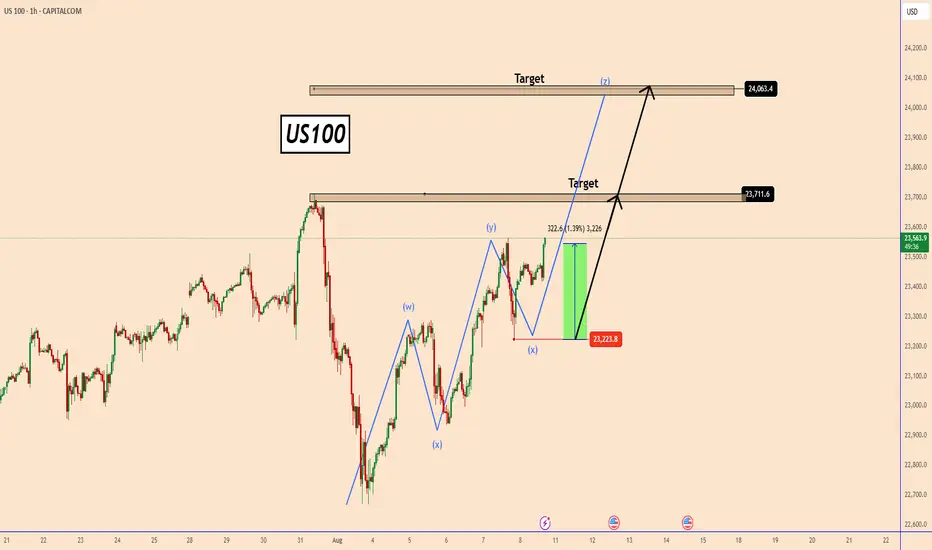
US100 Builds Momentum Toward New HighsUS100 Builds Momentum Toward New Highs
Since yesterday, the US100 has climbed by nearly 1.4%, rising from 23,223 to 23,550.
The bullish trend is strong, and it looks like US100 is preparing for a bigger upward move—possibly aiming to set a new all-time high.
Before continuing higher, US100 may first test the top of the current structure near 23,710, and then push toward 24,000.
The rally comes after weaker-than-expected NFP data, which has increased expectations for a 25 basis point rate cut by the Fed in September.
J.P. Morgan now forecasts a 25 bps rate cut, citing signs of a slowing labor market and uncertainty surrounding President Donald Trump's latest Fed nomination.
You may find more details in the chart!
Thank you and Good Luck!
PS: Please support with a like or comment if you find this analysis useful for your trading day
NASDAQ Index Analysis (US100 / NASDAQ)The index is moving within an upward channel in the broader trend and is currently trading near the 23,900 zone.
🔻 Bearish Scenario:
If the price breaks below 23,850, a corrective wave may begin, testing the 23,700 area. A break below this level could open the door for further downside corrections.
🔺 Bullish Scenario:
If the price manages to break and hold above 23,900, this could support a continuation of the uptrend toward a new high at 24,000.
NSDQ100 rally on rate cuts expectation US equities rallied, with the S&P 500 hitting a new high (+1.13%) after July CPI matched expectations, keeping hopes alive for a September Fed rate cut. Headline CPI was +0.2% MoM / +2.7% YoY, helped by falling gasoline prices, while core CPI rose +0.32% MoM, lifting the YoY rate to 3.1% — the highest core reading in six months. Markets shrugged off the stickier services inflation, focusing instead on the relief that inflation wasn’t hotter. Treasury Secretary Bessent backed the idea of a 50bp cut, further boosting rate-cut bets. Geopolitical headlines — including Putin–Trump summit plans and ongoing Ukraine tensions — were largely ignored by risk assets.
Conclusion for Nasdaq 100 trading
The inflation data reinforced expectations for Fed easing, keeping risk appetite strong and likely supporting further upside in the Nasdaq 100 in the near term. However, the hotter core services figure is a reminder that any sharp rally could face headwinds if upcoming data challenge the rate-cut narrative.
Key Support and Resistance Levels
Resistance Level 1: 23965
Resistance Level 2: 24120
Resistance Level 3: 24290
Support Level 1: 23665
Support Level 2: 23533
Support Level 3: 23422
This communication is for informational purposes only and should not be viewed as any form of recommendation as to a particular course of action or as investment advice. It is not intended as an offer or solicitation for the purchase or sale of any financial instrument or as an official confirmation of any transaction. Opinions, estimates and assumptions expressed herein are made as of the date of this communication and are subject to change without notice. This communication has been prepared based upon information, including market prices, data and other information, believed to be reliable; however, Trade Nation does not warrant its completeness or accuracy. All market prices and market data contained in or attached to this communication are indicative and subject to change without notice.

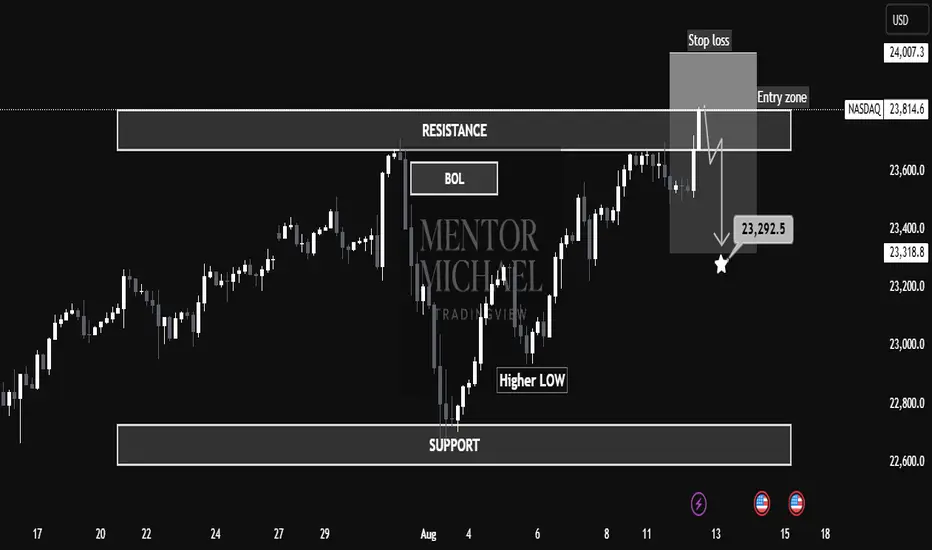
NASDAQ at Make-or-Break Resistance – Is a Sharp Drop to 23,292 "📉 NASDAQ at Make-or-Break Resistance – Is a Sharp Drop to 23,292 Next?"
📊 NASDAQ is currently trading within a well-defined resistance zone (23,812 – 24,007) after a recent rally from the support base near 22,800. The structure suggests a potential sell-side setup if price respects the resistance and fails to break higher.
🧐 Market Structure Analysis
Support Zone: Around 22,800, where buyers previously stepped in, forming a Higher Low and initiating the last bullish leg.
Resistance Zone: 23,812 – 24,007, marked by previous rejections and a Break of Liquidity (BOL).
Price has tapped into the entry zone just below resistance, hinting at possible exhaustion from buyers.
The chart indicates a bearish bias from this zone, aiming for a move toward 23,292.5 (marked target).
🎯 Educational Trade Example
Entry Zone: 23,812 – 24,007
Stop Loss: Above 24,007 to protect against breakout rallies.
Target: 23,292.5 (aligned with previous structural support).
Rationale:
Trading against strong resistance offers asymmetric R:R if momentum shifts bearish.
The Higher Low before resistance can act as liquidity fuel for sellers once demand weakens.
Clear invalidation point keeps risk defined.
⚠ Invalidation Scenarios
A strong breakout and close above 24,007 with follow-through volume would invalidate the short idea and potentially signal continuation toward 24,200+.
💡 Key Takeaways for Students
Zone-to-Zone Trading: Always define both entry and exit zones before execution.
Structure Before Strategy: The market’s reaction to resistance is the clue — confirmation comes before position sizing.
Risk Management is Non-Negotiable: Even high-probability setups require strict stop placement.
Dip-buying on the Nasdaq?The Stock market rallied following the July US CPI inflation data, with the Nasdaq 100 climbing to an all-time high of 23,849. Overlooking the economic picture for now, price action has exhibited a clear uptrend since early April this year. This is evident from the price, which has chalked up a series of higher highs and higher lows, trading above the 200-day simple moving average at 21,100, and with the dynamic value pointing higher.
Traders seldom attempt to buy at record highs; they tend to buy into retracements from support levels. Therefore, support levels of note right now include 23,347 (1W), 22,990 (1W), and 22,592 (1M).
Written by the FP Markets Research Team

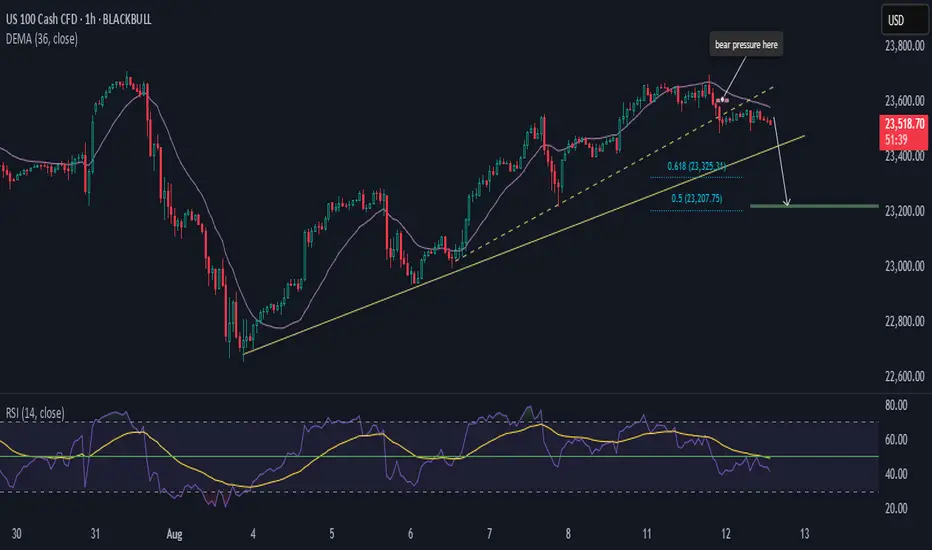
NAS100 Building Up On Bearish PressureHi there,
NAS100 has been very surprising for us recently, with increased bullishness that appears to be giving a bearish bias.
🦉 We'll use RSI and DEMA to coordinate price movements.
🎙️The price is bearish from the 23,600 area and has broken a minor dashed trendline. As long as the price remains below the purple 36 DEMA, below the RSI 50 level, and below the yellow RSI EMA, we remain bearish toward the solid trendline. This outlook points to two target support areas: 23,325 and 23,207.
🧩 Note: the bearish momentum is driven by the 3-hour chart. If it changes there, the setup will be invalidated.
Happy Trading,
K.
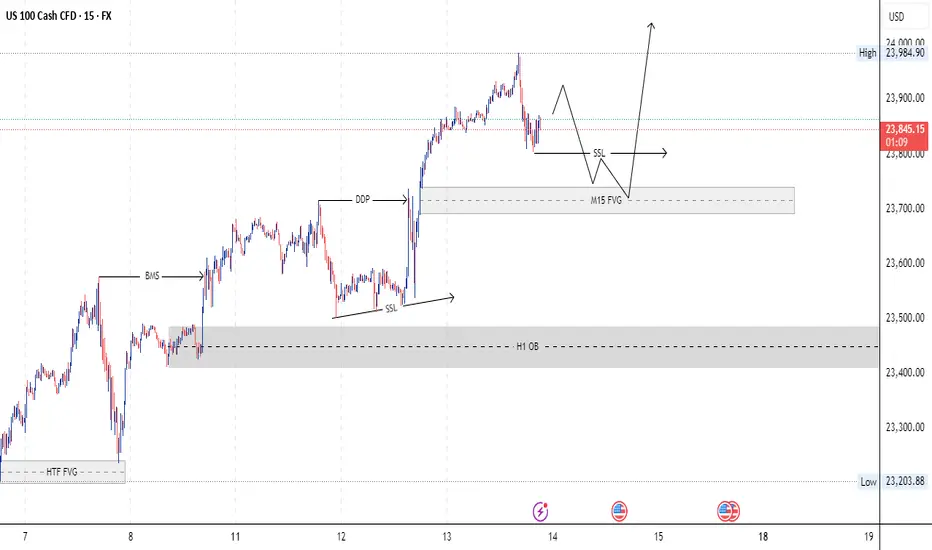
NASDAQ 100| Bullish OutlookHTF (4H)
Price has broken major external structure highs, currently trading near the 23,712 zone with strong bullish momentum. My focus is on buying opportunities after a clean pullback — ideally sweeping sell-side liquidity into the 4H OB. Price action is being monitored closely for confirmation.
LTF (30M/5M)
Structure remains clean and respected. I’m watching for a liquidity sweep into the 23,444 – 23,399 OB zone.
Execution Plan
Targeting 5M highs for intraday delivery or 30M highs if momentum extends. Trade will be managed in alignment with internal framework structure and market delivery behavior.
