Nasdaq 100 Bearish Divergence Signals Potential 30% down ?Chart Analysis (Monthly):
The Nasdaq 100 (NDX) is showing a significant bearish divergence on the monthly chart with RSI, which historically has been a strong reversal signal. While the price has recently made a new high, the RSI has failed to confirm this move, forming lower highs. This divergence typically precedes major corrections in the index. Similar patters have been observed on S&P 500 and FANG+ Index.
Historical Context:
In past instances (highlighted on the chart), similar divergences led to substantial declines:
2018: ~23% drop
2022: ~37% drop
Currently, if history repeats, the NDX could potentially correct by ~30% from recent highs, bringing it closer to the 16,000–17,000 zone, aligning with the previous demand zone and the 100-month moving average.
Fundamental Backdrop – Tariff Issues:
Adding to the technical weakness, renewed concerns over U.S. trade tariffs under Trump's policy stance are resurfacing. Potential escalation in tariffs could weigh heavily on mega-cap tech stocks, which dominate NDX, impacting global supply chains and margins. Historically, tariff-related uncertainty has triggered volatility in growth-heavy sectors.
Watchlist Action:
Closely monitor upcoming U.S. trade policy announcements and tariff discussions.
Hedge long positions or consider selective short opportunities if bearish confirmation patterns appear on weekly/daily timeframes.
📌 Disclaimer: This analysis is for educational purposes only and does not constitute financial advice.
NASDAQ trade ideas

NAS100 - Stock Market Heading Down?!The index is trading in its medium-term ascending channel on the four-hour timeframe between the EMA200 and EMA50. However, if the index corrects upward towards the specified supply zone, it is possible to sell Nasdaq with better risk-reward.
In recent days and weeks, the Nasdaq Composite Index once again approached its historic highs, even setting a new all-time record. However, following the latest jobs data and the Federal Reserve meeting, the index experienced a price correction.
Unlike many previous bullish phases that were driven largely by short-term momentum or emotional reactions, the current upward trend in the Nasdaq reflects structural maturity and market stabilization. Institutional capital inflows and strong corporate earnings have together painted a picture of a more stable and predictable future for this index.
According to recent financial data, U.S. equity funds received over $6.3 billion in net inflows during the final week of July—marking the first positive inflow after three consecutive weeks of outflows.
The key engine behind this growth continues to be the robust performance of tech companies. Firms such as Meta, Microsoft, and AI-oriented companies like Nvidia and Broadcom posted exceptionally strong earnings reports. These results not only exceeded analysts’ expectations but also fueled significant gains in their stock prices, contributing to the Nasdaq’s momentum. Despite some sector-specific concerns—for instance, regarding Qualcomm in the semiconductor space—the broader tech sector has sustained its upward trajectory and even extended that momentum to adjacent industries, especially those involved in cloud and AI supply chains.
Meanwhile, advisors to Donald Trump revealed that he plans sweeping reforms at the U.S. Bureau of Labor Statistics (BLS). This announcement followed the July jobs report, which showed only 73,000 new jobs and sharp downward revisions to prior months’ figures.
On Truth Social, Trump accused the current BLS Commissioner, Erica McEnturfer, of politically manipulating employment data and ordered her immediate removal. Secretary of Labor Lori Chavez-DeRemer subsequently announced that Deputy Commissioner William Witrofsky would serve as acting head. Trump emphasized that economic data must be accurate, impartial, and trustworthy—and not politically skewed.
Following this leadership change, a broader debate has emerged around how employment statistics are collected and reported. While statistical revisions have long been a routine, non-political process since 1979, there are now growing questions about whether a better system for gathering and publishing this critical data could be developed.
As a nonpartisan branch of the Department of Labor, the BLS publishes its monthly employment report at 8:30 AM Eastern on the first Friday of each month. The data is gathered from surveys of around 629,000 business establishments.
Analysts have cited several reasons for the frequent need for revisions:
• Late responses from firms
• Delays from large corporations that distort preliminary figures
• Recalculations due to seasonal adjustments (e.g., holidays or weather)
• Demographic shifts impacted by immigration or deportation
• Annual revisions based on finalized tax records
With a relatively light economic calendar in the U.S. this week, traders have turned their focus to the latest developments in trade negotiations—particularly talks with countries that have yet to finalize trade agreements with Washington.
Although the U.S. has reached deals with key partners including the UK, EU, Japan, and South Korea, no formal agreement has yet been made with China to extend the current trade truce, which is set to expire on August 12.
The new U.S. tariff plan proposes a baseline 10% rate for most countries, but some—like India and Switzerland—face much higher rates of 25% and 39%, respectively. However, since implementation of the tariffs has been postponed until August 7, there’s still time for further negotiations and possible rate reductions. Sources close to the White House suggest the administration is eager to continue talks.
What’s now becoming clear is the sheer magnitude of the proposed tariff shifts—far beyond pre-trade-war averages. These changes could have more severe consequences than previously estimated, potentially pushing up U.S. inflation while simultaneously threatening global growth. As such, markets may be entering a fresh wave of volatility.
Compounding these concerns is the U.S. Treasury’s upcoming bond issuance schedule, which could add to market instability.
Also on the radar is the ISM Services PMI for July, due Tuesday. Its results will be closely watched for signs on the U.S. dollar’s direction and the Fed’s potential actions at its September meeting.
Notably, as of July 18, 2025, the widely-followed Buffett Indicator—measuring the ratio of market capitalization to GDP—was 2.3 standard deviations above its historical average. This level surpasses even the dot-com bubble era of the early 2000s. The indicator is now firmly in the “overvalued” zone, which often precedes market corrections or even crashes. For context, during the 2008 financial crisis, it was roughly 1.5 standard deviations below the historical norm.

NAS100: Bullish Reversal from Key Support ZoneFirstly, our Algo-based indicators are used to create this analysis:
This 1-hour chart for NAS100 highlights a strong bullish reversal from a critical support level, suggesting a potential move back towards recent highs.
Analysis:
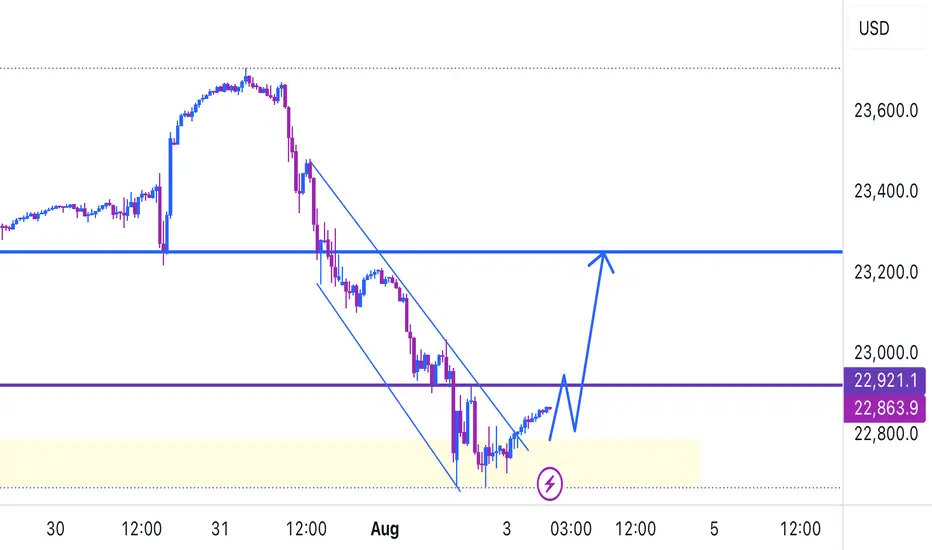
Support Bounce: The index experienced a sharp sell-off but found significant buying pressure within a key support zone marked between 22,677 and 22,829. This area, labeled "LSQB" (Liquidity Sweep Order Block) and including the "Daily Open," acted as a strong floor, triggering a V-shaped recovery.
Momentum Shift: The oscillator at the bottom of the chart confirms this shift in momentum. After dipping into the oversold "BUY" zone, the indicator has sharply reversed and is trending upwards with conviction, as indicated by the projected black arrow. This suggests that buyers have taken control in the short term.
Moving Averages: The price has decisively reclaimed the EMA 200 (the main green line), a key indicator often used to gauge the longer-term trend on a given timeframe. Holding above this level is a strong bullish sign.
Price Projection: The drawn black line illustrates the expected price path—a continued rally from the current level back towards the red resistance zone near the recent high of approximately 23,700.
Strategy:
Position: Long (Buy)
Entry: The bounce from the support zone has already been confirmed. Current levels could be seen as an entry, or traders might look for a minor pullback that holds above the EMA 200.
Target: The primary target is the red resistance zone around the 23,700 level.
Conclusion:
With the price reacting strongly to a key liquidity zone and momentum indicators confirming a bullish reversal, the path of least resistance for NAS100 appears to be upwards. The immediate target for this recovery is the recent high near 23,700.
Disclaimer: This analysis is for educational purposes only and should not be considered financial advice. Always conduct your own research and manage risk appropriately.

Us100 a strong buyUs100 broke out of your trendline, waiting for the market to retrace to your demand zone, and we can buy from there
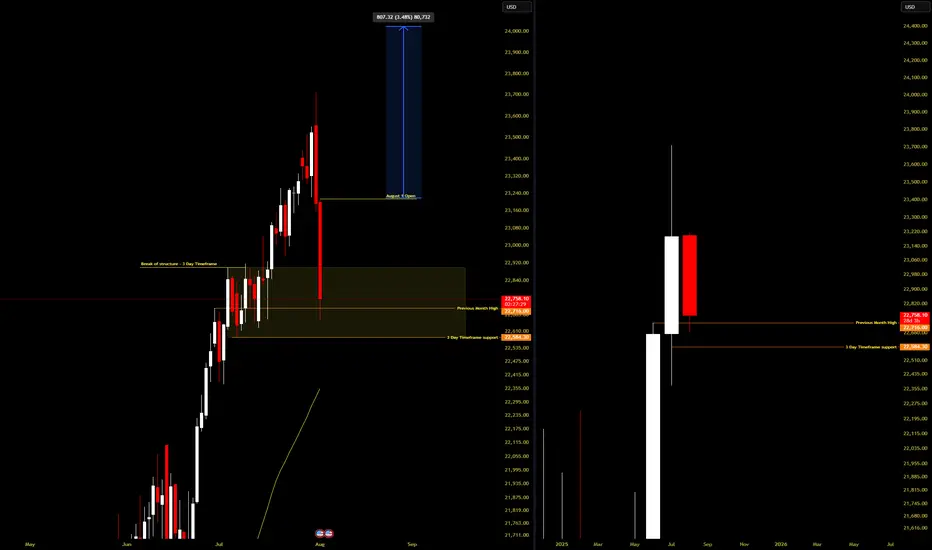
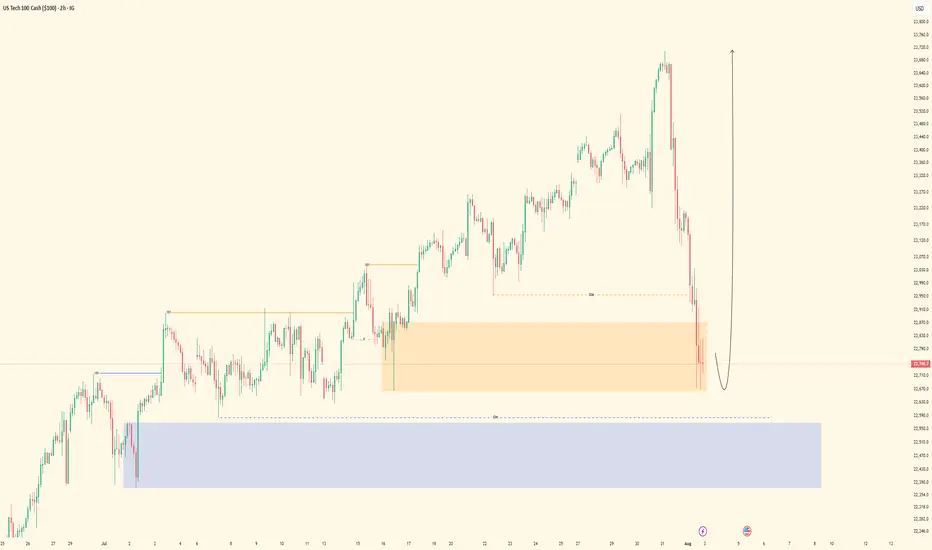
SWING TRADE NASDAQIs this another case of Trump moving the markets so his buddies can get better entries? 👀
Not saying anything... but July candles were way too friendly in that yellow box. Institutions were loading up like it was Black Friday.
I jumped in too—snagged a clean 10RR 😎📈
Now, with seasonality (August 3.5% average past 10 years) + Commitment of traders data backing me up( July COT is heavy longs), I’m risking light for a tiny 27RR setup.
Will it work? No clue.
Will I be dramatic about it? Absolutely. 🎭📉📈
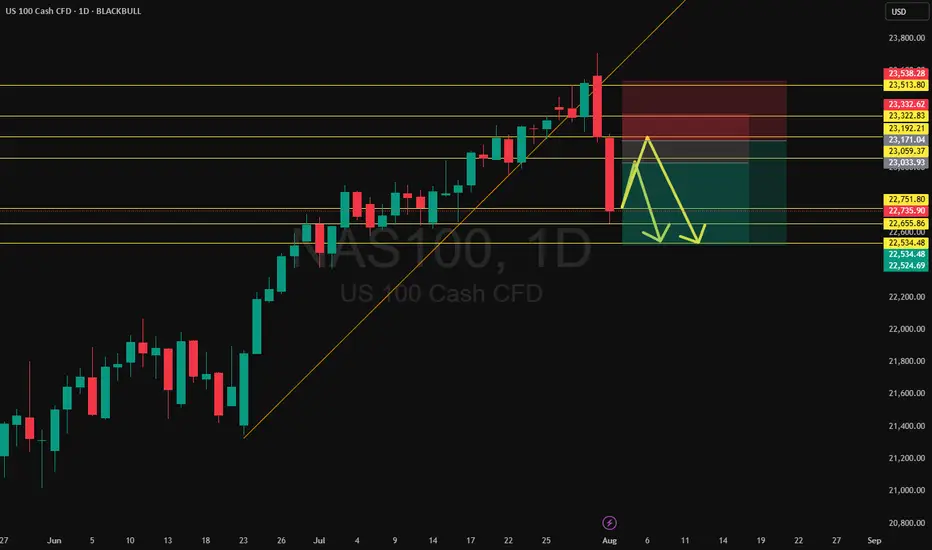
NASDAQ technical analyse.📉 NAS100 Technical Analysis – Potential Reversal Zone Identified (4H Chart)
Price has seen a strong bearish move, breaking through multiple support levels. Currently, it is approaching a key demand zone between 22,600 – 22,420, which previously acted as strong support in early July.
I'm watching two potential scenarios from this level:
🔹 Scenario A (Blue Path): A bullish reversal from the current zone, targeting the 23,400 area. This would require confirmation with bullish candlestick patterns or momentum divergence.
🔸 Scenario B (Red Path): A deeper dip into the demand zone (towards 22,420), followed by a stronger bounce. This could offer a better risk-to-reward long entry if bullish structure forms.
🔻 Invalid if price closes decisively below 22,400, breaking structure and invalidating the reversal setup.
Let me know your thoughts. Are you going long or still waiting for confirmation?

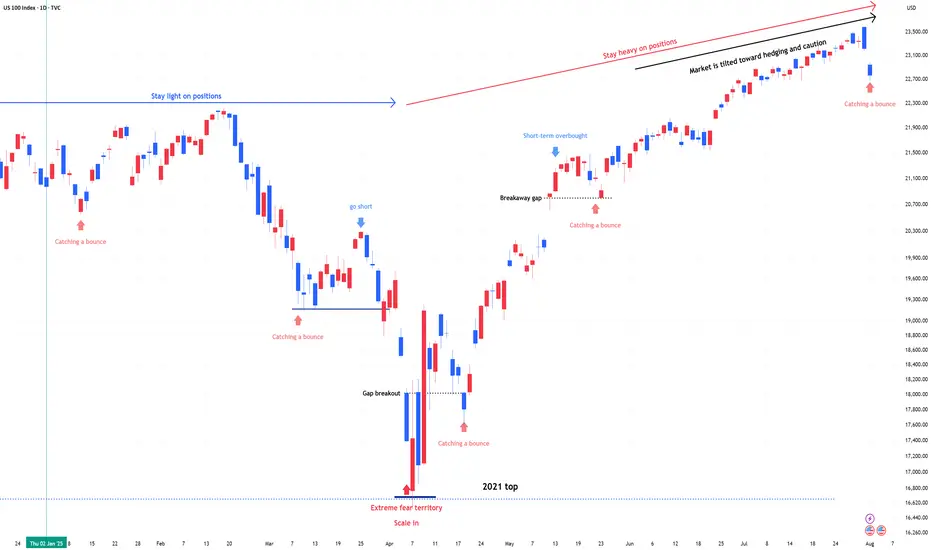
NDX & SPX , Stay heavy on positionsNDX & SPX , Stay heavy on positions (QLD, TQQQ)
Despite downside volatility, the trend remains intact. I’m maintaining the same view as before—this is still a zone to stay heavy.
NAS100 Hits Monthly Level - Retrace or Reload?After a sharp leg down, NAS100 remains in a broader uptrend but is now reacting off a key monthly level. Expect a short-term retracement with the potential for a second leg lower. If bullish momentum returns, watch for an attempt to reclaim the level. Momentum is strong enough to challenge it again—traders should be ready for either a deep retrace or continuation move.
NASDAQ: Bears In Control! Sell it!Welcome back to the Weekly Forex Forecast for the week of Aug 4 - 8th.
In this video, we will analyze the following FX market:
NASDAQ (NQ1!) NAS100
The NAS 100 was weakened by bad job numbers, mixed earnings reports, and tariff wars. In the short term, it is bearish. Sell it down to the Weekly/daily +FVG for high probability buys from those levels.
Buying at current levels is not advised. Wait for a valid market structure shift to the upside before going long.
Enjoy!
May profits be upon you.
Leave any questions or comments in the comment section.
I appreciate any feedback from my viewers!
Like and/or subscribe if you want more accurate analysis.
Thank you so much!
Disclaimer:
I do not provide personal investment advice and I am not a qualified licensed investment advisor.
All information found here, including any ideas, opinions, views, predictions, forecasts, commentaries, suggestions, expressed or implied herein, are for informational, entertainment or educational purposes only and should not be construed as personal investment advice. While the information provided is believed to be accurate, it may include errors or inaccuracies.
I will not and cannot be held liable for any actions you take as a result of anything you read here.
Conduct your own due diligence, or consult a licensed financial advisor or broker before making any and all investment decisions. Any investments, trades, speculations, or decisions made on the basis of any information found on this channel, expressed or implied herein, are committed at your own risk, financial or otherwise.

Nasdaq| Bullish Intent Maintained| Refined OB Reaction In Motion(Refined & Structured):
• Pair: Nasdaq (US100)
• Bias: Bullish / Buy
• 4H Overview: Bullish structure remains intact. Despite the congestion and noise, price maintained its upward trajectory. I refined the drop to mid timeframes for precision and clarity.
• 30M Structure: Refined bullish structure with clear intent. Price has mitigated a clean OB, setting the stage for further continuation.
• Entry Zone: Watching lower timeframes for confirmation to ride the wave higher.
• Targets: 5M to 30M structural highs depending on how price delivers.
• Mindset Note: Noise is just noise until structure filters it out. Precision comes from refining—this setup proves that. Stay focused, stay clean, let intent guide you.
UPDATEFriday we closed on the breakeven after that the price reached our 50% level of the trade, so our TP was raised to the breakeven.
Follow for more trades to catch up the next week!

US100 makes a slight drop from ATH!Price dropped from the all time high of 23,703 we’re beginning to see a pullback in price. We’d be monitoring a time price will shift from intraday bearish to bullish. This is to help us position ourselves for a buy opportunity.
NAS100 - Potential Targets this WeekDear Friends in Trading,
How I see it,
(My week is building up; I'm using the DATA we have thus far)
Keynotes:
510k orders stacked at the current demand area.
If sellers push through Daily support decisively, it will become a strong resistance.
The real battlefield between sellers and buyer lies between 23250 - 23500.
Remember with stocks, Imbalances can remain unfilled for very long periods.
I sincerely hope my point of view offers a valued insight
Thank you for taking the time study my analysis.

Sunday Premarket AnalysisWe will likely hit the 4H FVG not too far above where price left off on Friday.
Then head all the way down take July's low and hit the area below that
because there is a BIG FAT juicy MONTHLY, WEEKLY && DAILY FVG
sitting directly under the July monthly low. We will likely hit all three or maybe just 2
of these FVG's and then head up for super big push, bullish into at least the first week of September. Keep in mind Jackson Hole Symposium is mid month-ish also.

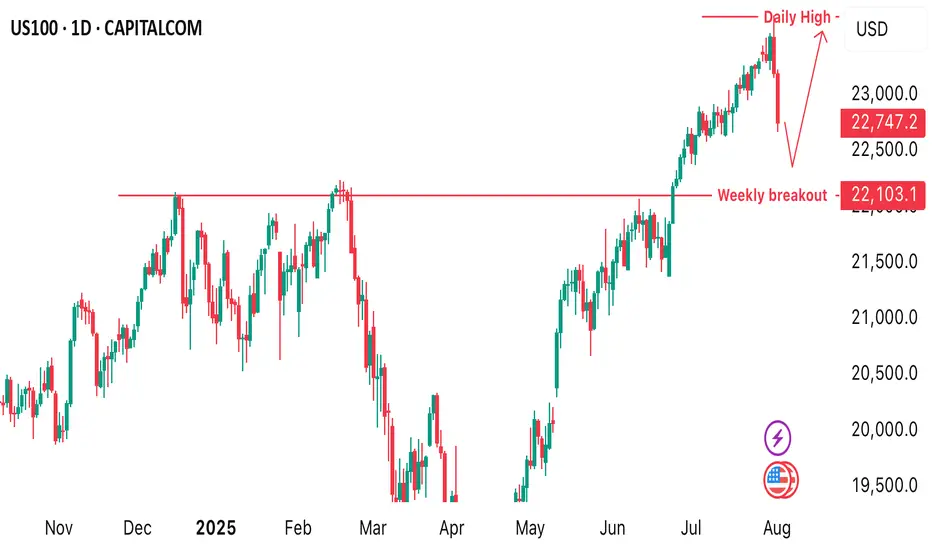
US100The US100, also known as the Nasdaq 100 Index, tracks the performance of the 100 largest non-financial companies listed on the Nasdaq Stock Exchange, primarily in the technology, consumer services, and healthcare sectors. It is a market-capitalization-weighted index and includes major corporations such as Apple, Microsoft, Amazon, NVIDIA, Meta, and Alphabet. As a tech-heavy index, the US100 is highly sensitive to changes in interest rates, innovation cycles, investor sentiment, and macroeconomic indicators, especially those related to inflation, employment, and monetary policy.
Over the past two decades, the Nasdaq 100 has experienced strong long-term growth, driven by the expansion of the digital economy, cloud computing, artificial intelligence, and e-commerce. After a steep correction in 2022 caused by inflation concerns and aggressive rate hikes by the Federal Reserve, the index rebounded in 2023 and 2024, supported by improving macroeconomic conditions, a stabilization in interest rates, and renewed investor confidence in tech and growth stocks. AI-driven investments, semiconductor breakthroughs, and tech-led productivity gains have further fueled its momentum.
As of August 2025, the US100 is trading at 22,747, marking a new historical high. This reflects strong earnings performance from major tech companies, continued innovation in AI and automation, and a more dovish outlook from the Federal Reserve, which has helped reduce pressure on growth equities. Despite its gains, the index remains vulnerable to volatility stemming from inflation surprises, geopolitical risks, and shifts in central bank policy. The Nasdaq 100 continues to be a key benchmark for growth-oriented investors and a barometer for the health of the global tech sector.

NSDQ100 The Week Ahead Key Support and Resistance Levels
Resistance Level 1: 23050
Resistance Level 2: 43190
Resistance Level 3: 43430
Support Level 1: 22500
Support Level 2: 22333
Support Level 3: 22080
This communication is for informational purposes only and should not be viewed as any form of recommendation as to a particular course of action or as investment advice. It is not intended as an offer or solicitation for the purchase or sale of any financial instrument or as an official confirmation of any transaction. Opinions, estimates and assumptions expressed herein are made as of the date of this communication and are subject to change without notice. This communication has been prepared based upon information, including market prices, data and other information, believed to be reliable; however, Trade Nation does not warrant its completeness or accuracy. All market prices and market data contained in or attached to this communication are indicative and subject to change without notice.

NAS100 - The Stench of Insider Trading on Colossal Scale!!Dear Friends in Trading,
How I see it,
This is just my observation on 12HR TF.
I need Monday's Pre-NYSE data to give a more detailed analysis on smaller TF.
The BEAR signal arrived, and what a monster it is!
Keynote:
Fundamentally something was very off, specifically regarding stocks.
Even though - yes, tariff uncertainty, massively overbought technically.
It had the aroma of serious insider trading profit taking pre-NFP!
I can't help but feel it was a massive exactly timed profit grab
Stocks hardly moved on the event itself...think about it
Also, I believe the labor figures was seriously cooked!!!
I sincerely hope my point of view offers a valued insight
Thank you for taking the time study my analysis.

NASDAQ | BEARISHNASDAQ has retraced after hitting its top.A parabolic downward shift and an obvious bearish trend tend to print a LH.It may form an ABCD pattern and a sell stop order may be placed at the breakout of LL.

Nasdaq is retracing to lower channal line.Nasdaq is retracing to lower channal line. This fall is attributed to Tarrif war.

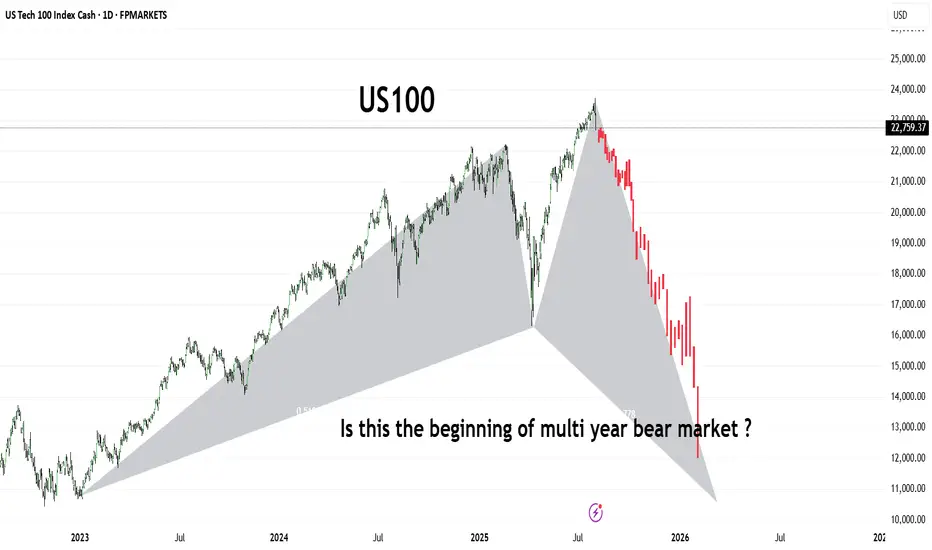
US100The US100 (Nasdaq 100) has shown a dramatic shift in trend, forming what appears to be a large-scale bearish harmonic pattern or potential M-top structure. After reaching its peak in mid-2025, the index has entered a sharp downward trajectory, shedding significant value in a short span.
This chart raises a critical question for long-term investors and traders:
Are we witnessing the early phase of a prolonged bear market that could stretch into 2026 and beyond?
🔻 Key Observations:
Bearish structure developing with aggressive selling pressure.
Potential breakdown from long-term support trendlines.
Momentum suggests institutional risk-off behavior.
Stay alert for macroeconomic cues, interest rate policy, and earnings season signals. A break below 13,000 could confirm a deeper bear cycle
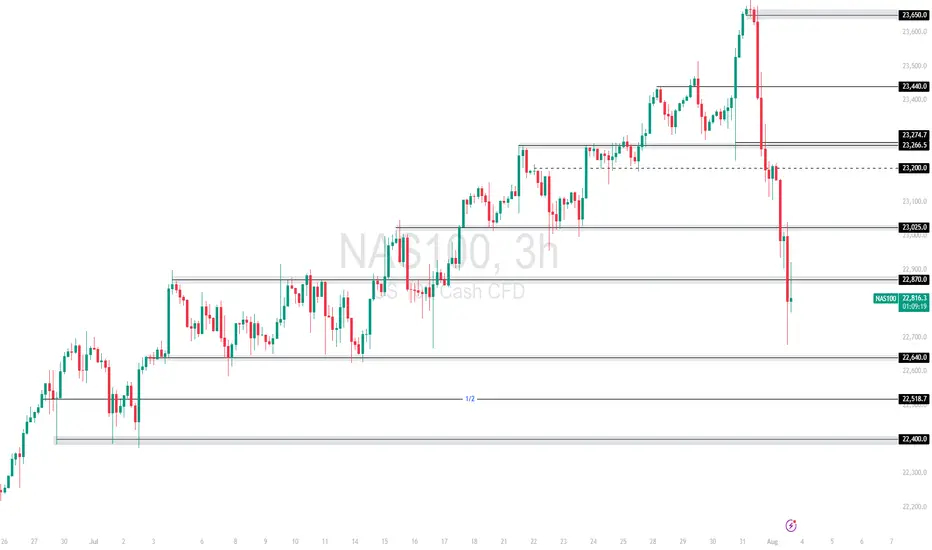
NAS100 – Sharp Breakdown After Tariffs & Jobs Data MissAfter a macro-driven selloff, NAS100 broke decisively below 23,025.0, taking out prior structure and confirming bearish pressure. The drop followed two key catalysts:
📉 Jobs Report Miss: Only 73K jobs added in July vs 200K+ expected — signals a slowing economy.
📛 Tariff Shock: President Trump imposed new tariffs on 90+ countries, up to 41%, rattling global sentiment.
Support at: 22,870.0 🔽 & 22,640.0
Resistance at: 23,025.0 🔼 & 23,200.0
🔎 Bias:
🔼 Bullish: Sustained strength above 22,870 with momentum could aim for 23,025 retest.
🔽 Bearish: Rejection below 23,025 or break under 22,870 opens space to 22,640 and possibly 22,518.
🎯 Let the dust settle – market could still be digesting the shock.
📛 Disclaimer: Not financial advice. Trade responsibly.
Nasdaq US100 Wave 3 Expansion Toward 31,606 in PlayNasdaq US100 has completed a significant wave cycle with a confirmed wave 1 in the broader Elliott Wave structure. Following this, price underwent a corrective wave 2 that extended from the $22,237 supply zone down to $16,334, marking the conclusion of the previous cycle’s correction. This structure now signals the initiation of a fresh upward impulse, setting the stage for a powerful wave 3 advance.
The emergence of wave 3 will gain full confirmation once price successfully breaks above the external supply zone, reclaiming $22,237. If this breakout occurs with sustained momentum, the wave 3 projection targets an expansion toward $31,606, which aligns with the 161.8% Fibonacci extension from the prior cycle. This forthcoming rally is anticipated to unfold in a five-subwave format, indicative of a high-momentum bullish leg.
As long as price action remains above the key support at $16,334, the bullish cycle remains valid. All eyes should now be on the breakout structure and volume profile around $22,237, as it represents the gateway to a much broader impulsive move.

OUR TRADE TODAY ON NASDAQBeen a while since I last posted here, today I’m sharing with you our trade we took 15min ago with an RR of 3
Follow for more
