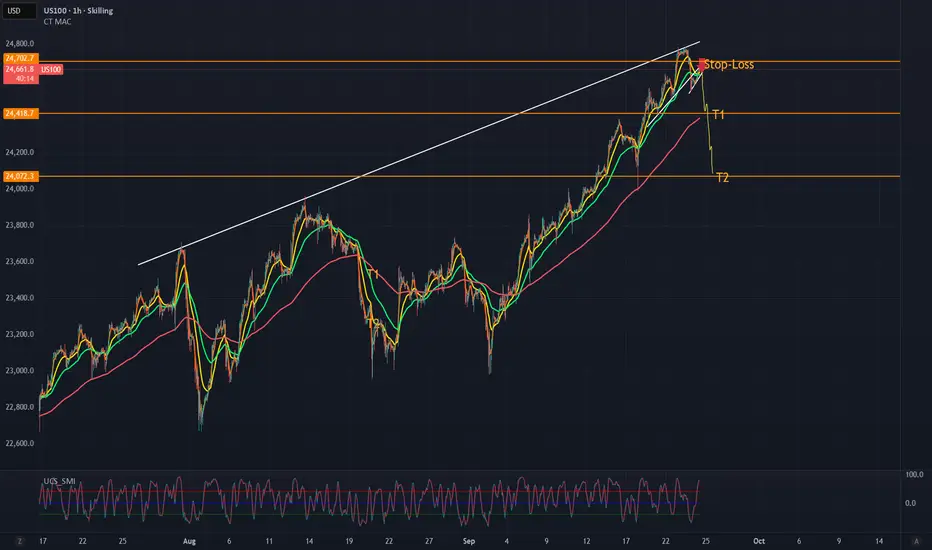
US100 Swing trade Sell position
Bearish pattern formed at the top.
Take-profit (TP) is defined on the chart.
If you wish to hold further, move stop-loss (SL) to breakeven.
NASDAQ trade ideas

NasdaqNasdaq breaking 24500 pulled back to the 2-day average and returned below this level, we can see a sharper drop to the support region 24100 and 24200

NAS still charging HighsEverything explained in video, please let me know if I may have missed any details!

USTEC - Trading Edge TodayDear Friends in Trading,
🎯Trading Edge:
Tech leading breakout momentum with institutional accumulation above POC
Key Level: 24,800 (volume gap fill)
Pivot: 24,650 – 24,700
Bias: Bullish above pivot
Bull target: 24,800 → 25,000
Bear target: 24,600 → 24,400
Correlation: +88% with US30, +52% with Gold (Fed trade)
Risk Assets Alignment:
GOLD🔄USTEC🔄US30
✅Gold + USTEC + US30 all bullish above pivots = Fed dovish trade confirmed
✅Unusual Gold/equity positive correlation suggests monetary policy driving both higher
Assets Overbought:
🔴USTEC - 4HR Overbought Divergence Detected
I sincerely hope my point of view offers a valued insight.
Thank you for taking the time study my analysis.

3rd Short term trade with NASDAQAfter two consecutive profits on the NASDAQ, I hope this third trade will also yield satisfactory result. A good risk-reward ratio is crucial in trading.

Nasdaq 100 Eyes 24,550–25,050 if Fed Signals Dovish ToneUSNAS100 – Technical Overview
The Nasdaq remains in focus as traders await the Federal Reserve’s rate decision later this week.
Markets largely expect a 25 bps cut, but the key driver will be Chair Powell’s tone on inflation, labor-market weakness, and tariff risks.
Earlier record highs across U.S. indexes were fueled by tech strength and optimism over U.S.–China trade talks, while gold’s surge to new highs underscores strong safe-haven demand.
Technical Outlook
📉 Correction phase
Price is expected to retest 24,240 → 24,115 before attempting another bullish leg.
A sustained drop below 24,110 would expose deeper support at 23,870.
📈 Bullish continuation
Holding above 24,240 – 24,115 keeps the broader uptrend intact.
Once consolidation is complete, a renewed rally targets 24,550 → 24,800, with a potential extension to 25,050 if the Fed delivers a more dovish message.
Key Levels
Pivot: 24,380
Resistance: 24,550 – 24,800 – 25,050
Support: 24,240 – 24,115 – 23,870
📌 Market Context:
A 25 bps Fed cut may offer moderate support for tech-heavy indices, while a more aggressive 50 bps cut could accelerate the next breakout toward fresh ATHs. Conversely, a hawkish tone from Powell could trigger a deeper correction before the next leg higher.

NasdaqNasdaq consolidated another support level at 24740 in today's session. If the price remains above this support, buyers remain in control, and we could reach 25000, an important level that could signal the end of the bullish rally. An H1 candlestick closing above 24800 could confirm continuation.

Here we go again, the 4th trade idea for NASDAQ.Trade what you see, not what you feel. After three consecutive wins on NASDAQ, let's see if this will be the fourth? I don't intend to show off here, but I want to learn to be more disciplined with my trading and increase my confidence. And who knows, this might also be useful for others.

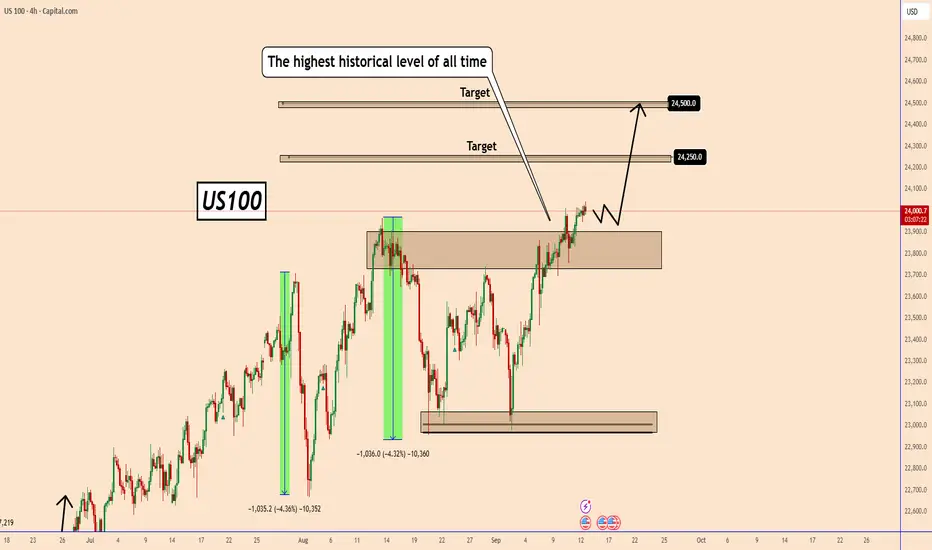
US100 Hits All-Time HighUS100 Hits All-Time High
Yesterday, US100 reached a new record high at 24040, confirming the strength of its bullish trend.
With U.S. inflation cooling, the market is now expecting the Federal Reserve to cut interest rates, possibly starting this cycle and continuing in the months ahead.
Lower rates tend to support stocks and indices, giving the economy room to breathe after a long period of tight monetary policy.
I expect US100 to continue rising toward 24500, with intermediate targets at 24250 and 24500 in the coming week.
You may find more details in the chart!
Thank you and Good Luck!
❤️PS: Please support with a like or comment if you find this analysis useful for your trading day❤️
same stratlooking for first 1m resistance in this order block.
short it back to thsi main support zone
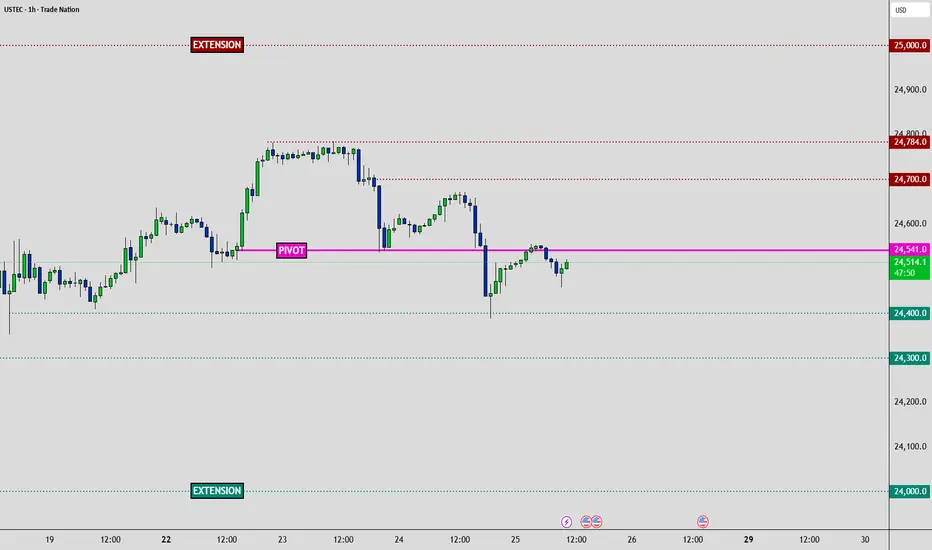
NAS100 Technical Forecast: Key Levels & Traps🚀 NAS100 Technical Forecast: Key Levels & Traps 🐻
*Analysis as of Sept 20, 2025 (12:50 AM UTC+4)*
📊 Overall Market Context:
Price: 24,610. Geopolitical events remain a key volatility driver. Current price action suggests a cautious market seeking direction after recent moves.
🔍 Key Technical Indicators:
• RSI (14): Neutral zone (~50). No strong overbought/oversold signal.
• Bollinger Bands (20): Price near the middle band, indicating balanced volatility.
• Moving Averages: Watching for a potential bearish crossover on the 4H chart. Key resistance at the 50-EMA.
• VWAP: Current price trading around the session's VWAP; a break above signals intraday bullish bias.
🎯 Critical Support & Resistance:
• Immediate Resistance: 24,800 -> 25,000 (Psychological)
• Strong Resistance: 25,250 (Previous High)
• Immediate Support: 24,500 -> 24,300
• Strong Support: 24,000 (Key Level)
⚠️ Pattern Watch:
• Bull Trap Risk: A false breakout above 24,800 could lure buyers before a drop.
• Bear Trap Risk: A sharp rejection from 24,300 could trap sellers before a rally.
• No clear Harmonic or Elliott Wave pattern on lower timeframes; monitoring for setup.
📈 Intraday Trading (5M-1H Charts):
• BUY (Long): Above 24,650, targeting 24,800. Stop Loss: 24,550.
• SELL (Short): Below 24,500, targeting 24,300. Stop Loss: 24,650.
*Confirmation: Use 5-min RSI divergence and volume spikes.*
📉 Swing Trading (4H-Daily Charts):
• BUY Swing: On a bullish reversal candle at 24,300 support, target 25,000+. SL below 24,000.
• SELL Swing: On a rejection at 24,800 resistance, target 24,000. SL above 25,100.
*Wait for a 4H close above/below key levels for confirmation.*
🎲 Risk Management:
Always use a 1:2 Risk/Reward ratio. Protect your capital.
For individuals seeking to enhance their trading abilities based on the analyses provided, I recommend exploring the mentoring program offered by Shunya Trade. (Website: shunya dot trade)
I would appreciate your feedback on this analysis, as it will serve as a valuable resource for future endeavors.
Sincerely,
Shunya.Trade
Website: shunya dot trade
📝 TRADING CHECKLIST
Before entering any position:
- ✅ Confirm volume supports move
- ✅ Check RSI for divergences
- ✅ Verify multiple timeframe alignment
- ✅ Set stop loss before entry
- ✅ Calculate position size
- ✅ Review correlation with DXY/SPX
- ✅ Check economic calendar
- ✅ Assess market sentiment
⚠️Disclaimer: This post is intended solely for educational purposes and does not constitute investment advice, financial advice, or trading recommendations. The views expressed herein are derived from technical analysis and are shared for informational purposes only. The stock market inherently carries risks, including the potential for capital loss. Therefore, readers are strongly advised to exercise prudent judgment before making any investment decisions. We assume no liability for any actions taken based on this content. For personalized guidance, it is recommended to consult a certified financial advisor.

USTEC - 2 Day Traders Edge📈Technical:
MARKET BIAS: Neutral (consolidating at HVN pivot, high-rate sensitivity)
PIVOT ZONE: 24,541 (Exact HVN level)
🥇 Traders Edge - Actionable & Tactical
TRADE SETUPS:
🟧 Risk Warning: Core PCE surprise = 200+ point moves
🟧 Special Risk: High beta to rate moves via PCE
↕️ Bias Flip: Break below 24,400 (bearish) | above 24,700 (bullish)
🟢Long Setup:
• Entry above Pivot | Stop 24,450 | TP: 24,650 | 24,750 | 24,850 - Extended Breakout
🔴Short Setup:
• Entry below 24,400| Stop Above Pivot | TP: 24,300 | 24,000 - Extended Breakdown
🎯KEY LEVELS:
• Strong Resistance: 24,700 | 24,784
• Strong Support: 24,400 | 24,300 | 24,100 | 24,000
🎯PRICE TARGETS:
• Bullish Path: 24,700 → 24,784 → 25,000 (Extended breakout)
• Bearish Path: 24,400 → 24,300 → 24,000 (Extended breakdown)
🚨HIGH-IMPACT EVENTS (48H): (NY Time Zone)
• Sep 25 | 08:30 GDP Q2 Final: 3.3% vs -0.5% → Growth supports tech multiples
• Sep 26 | 08:30 Core PCE MoM: 0.2% vs 0.3% → TECH RATE SENSITIVITY
• Sep 26 | 08:30 Personal Spending: 0.5% vs 0.5% → Tech demand proxy
• Sep 26 | 10:00 Michigan Sentiment: 55.4 → Growth stock appetite
🛑 MASTER RISK EVENT
🟧Friday September 26 | 08:30 (NY Time Zone)
🟧 Core PCE Price Index (MoM) - Forecast: 0.2% vs Previous: 0.3%
🟧 Critical Impact: Fed's preferred inflation gauge determines rate path and USD strength
• Gold: Collapse risk if hot print
• Equities: Rate repricing volatility
• Sectors: Tech rotation sensitivity
⚠️ RISK MANAGEMENT PROTOCOL
• Reduce position sizes before Friday 08:30 EDT
• USD strength reversals impact Gold heavily
• Tech high beta to rate repricing
• Month-end flows amplify volatility
________________________________________
Analysis based on Session Volume POC clusters and HVN methodology
Shall Nasdaq keep going with correction phase?US100 index being in correction phase, shall it continue? Share your idea trader!
US100 Trend Watch – Critical LevelsUS100 Update
On the low time frame, US100 is consolidating around the 24,603 – 24,655 zone after rejecting higher levels.
Key levels:
24,655 – 24,603 → short-term resistance zone. A breakout and hold above would confirm bullish continuation.
24,158 → main trend support. As long as this level holds, the broader bullish structure remains intact.
Upside scenario: If price breaks and sustains above 24,655, momentum could extend further to test 25,000+.
Downside risk: If price falls below 24,603 and especially under 24,158, risk increases for a deeper pullback toward 23,800 – 23,400.
📌 Summary
Above 24,655 → bullish continuation toward new highs.
Hold above 24,158 → uptrend structure remains safe.
Below 24,158 → deeper correction risk, next support at 23,400.

NASDAQ (US100) - ShortNasdaq (US100) currently trading at 24662.
We reached a high at 24767 and from there got a rejection. Multiple reasons here now for a continuation to the down side.
Entry: In rising channel at current levels.
Stop Loss: 24702
T1: 24418
T2: 24072
I'm expecting to see a break of this rising channel soon, may get some retest of the upper line till then which are great entry points.
No trading advise, just my opinion. Have fun.
NAS100Scenario 1: If, after taking that liquidity, the price returns to 24,722.00, we could find a support area there from which the market may continue its upward move.
Scenario 2: If that previously mentioned zone doesn’t hold, the price could retrace back to the origin of the impulse, and then continue structurally without significantly compromising the underlying level (Flip Zone Box).
👉 In both cases, the targets remain those boxes above.

NAS100 Short SetupTrend: Bullish
Divergence: Bearish
Continuation Pattern : None
Reversal Pattern: Double Top
Bias: Bearish
Scenario: Sell Stop at Neckline breakout
Trade Plan
Stop Loss 24750
Entry Level 24400
TP1 24230

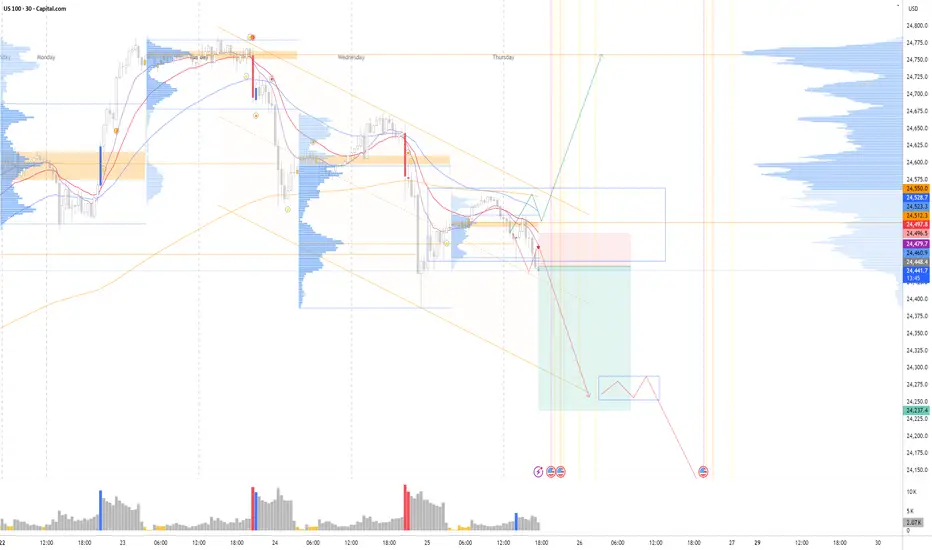
Nas100 Trade Set Up Sep 23 2025Price has created a big 4h FVG so if price closes under SSL at London lows i will target 50% of the 4h FVG but if price sweeps SSL and closes above i will look for an 1m IFVG to take buys higher
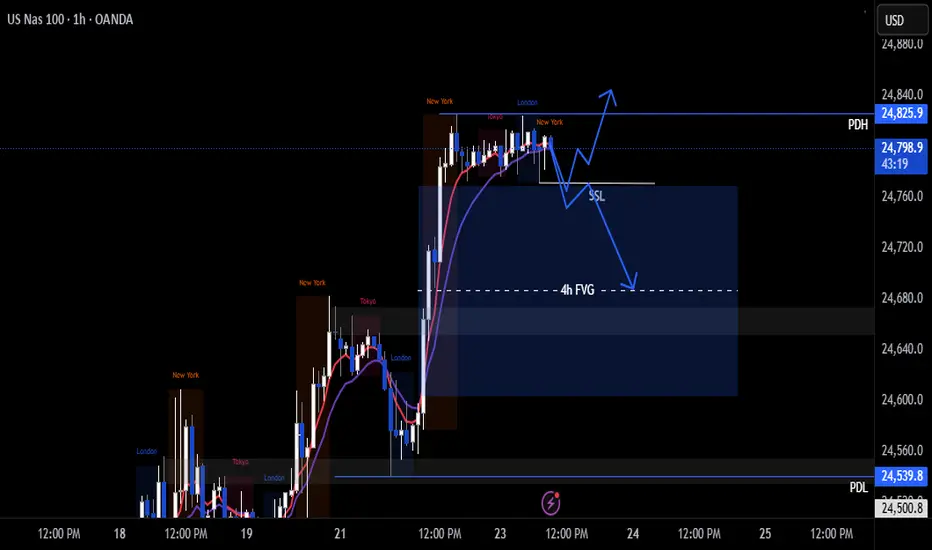
Nas100 Trade Set Up Sep 22 2025www.tradingview.com
Price is trading in between PDH/PDL and is approaching a 4h FVG so if it respects it i will look for internal bearish structure IFVG on the 1m to take sells to SSL levels

NAS100 longits broke weekly resistance and i think its going to go up from this current price, since its the stockmarket the tp is high cause of how it moves. long term swing.

Nasdaq slipped as investors balanced Fed signalsThe Nasdaq 100 (-0.87%) fell as tech stocks weakened. Uncertainty around Nvidia’s $100bn OpenAI deal led the reversal after Monday’s gains.
Powell’s comments added to caution: he repeated that risks remain on both inflation and jobs, but also admitted to “meaningful weakness” in the labour market. This helped bonds rally, but not equities.
Extra pressure came from US government shutdown concerns, while gold hit a record high ($3,764/oz) as investors shifted to a defensive.
Tech momentum cooled, and the Nasdaq slipped as investors balanced Fed signals, policy risks, and stretched valuations.
Key Support and Resistance Levels
Resistance Level 1: 24830
Resistance Level 2: 24950
Resistance Level 3: 25055
Support Level 1: 24412
Support Level 2: 24300
Support Level 3: 24190
This communication is for informational purposes only and should not be viewed as any form of recommendation as to a particular course of action or as investment advice. It is not intended as an offer or solicitation for the purchase or sale of any financial instrument or as an official confirmation of any transaction. Opinions, estimates and assumptions expressed herein are made as of the date of this communication and are subject to change without notice. This communication has been prepared based upon information, including market prices, data and other information, believed to be reliable; however, Trade Nation does not warrant its completeness or accuracy. All market prices and market data contained in or attached to this communication are indicative and subject to change without notice.

Buy Nas100Nas is bullish and will continue buying. There are two possible buy entries, being the demand zone, or the liquidity grab zone. Do not enter a trade on the demand zone unless there is another confirmation on lower time frames. Remember it is Friday tomorrow, and the market can be very manipulative on Friday. Do not force trades, there is nothing wrong with not having a trading day. Trade what you see, and not what you feel.

NAS100USD Technical AnalysisThe NAS100 has been in a strong bullish structure, creating higher highs and higher lows. After recently tapping 24,800.0 resistance, price rejected and is now pulling back toward the 24,583.1 area, which is acting as short-term support.
Support at: 24,583.1 🔽 / 24,393.3 🔽 / 24,099.2 🔽
Resistance at: 24,800.0 🔼
🔎 Bias:
🔼 Bullish: If buyers defend 24,583.1 and push price back toward 24,800.0, a breakout could open the way for continuation higher.
🔽 Bearish: A clean break below 24,583.1 exposes 24,393.3, and failure there could invite a deeper correction toward 24,099.2.
📛 Disclaimer: This is not financial advice. Trade at your own risk.
