NASDAQ trade ideas
Nas100: Trading Zones at Record HighsKey Zones in Focus
Zone 1 – All-time high area:
This zone marks the current all-time high and therefore acts as immediate resistance. Price has already tested this area, and sellers may attempt to defend it, leading to potential rejection or short-term pullbacks. A clean breakout and sustained hold above this level would confirm bullish continuation into uncharted territory, opening the door for further upside momentum.
Zone 2 – Demand zone:
This zone represents a recent consolidation cluster where both buyers and sellers were actively positioning. As the breakout unfolded, this area shifted from resistance to support. Short-term buyers are likely to step in here to defend the trend. A decisive break back below this zone, however, would weaken bullish conviction and could trigger a deeper retracement toward lower levels.
The sentiment around the US100 has turned more optimistic following last week’s Federal Reserve meeting, where the central bank cut interest rates by 25 basis points — the first rate cut since December 2024. This concrete policy move has reinforced investor confidence that monetary conditions are shifting toward a more supportive stance. At the same time, strong momentum in the technology sector, highlighted by new AI-focused partnerships and improving trade signals between the U.S. and China, has further boosted risk appetite. While some caution remains regarding the pace of future cuts and macroeconomic headwinds, the overall market tone is positive, with traders viewing the recent policy shift as a catalyst for continued strength in the Nasdaq-100.

NASQAD Weekly NASQAD 📊 Weekly Market Outlook
On this pair, we see a strong confluence forming on the Weekly timeframe:
✔️ Weekly Fair Value Gap (FVG)
✔️ Strong Weekly Order Block
✔️ Fibonacci retracement alignment
This zone is a high-probability area to watch. If price taps into this level, we’ll look for confirmation on lower timeframes before executing a buy setup.
Smart traders wait for price action to confirm before entering patience here can make all the difference.

Nasdaq-100 (NDX) Weekly Chart 2025 Chart Context
This weekly timeframe analysis of the Nasdaq-100 Index (NDX) forms a key pillar in our 2025 macro analysis series. Following the breakout structure seen in TOTAL, TOTAL2, BTC.D, and US10Y, this chart utilizes 2 Fibonacci tools (1 trend-based extensions and 1 retracement) to project potential corrective and expansion scenarios.
Fibonacci Tools Used:
Fibonacci Retracement : Applies to the recent smaller swing to determine micro retracement zones and cluster supports.
0=20674 and 100=10504
Trend-Based Fibonacci Extension: Drawn using a three-leg structure (point A= 3993 to B=16724 to C10504) to forecast upside targets beyond ATH.
All take-profit (TP) levels: TP1 (~23,400), TP2 (~26,700), and TP3 (~30,344.49)—are located at confluence zones where Fibonacci levels from different tools align, reinforcing their validity and strength.
There is a 4TP above all the Visible TPs
Key price references:
0% retracement: ~20,674.71
Next Resistance ~23,400 (confluence of extensions and psychological resistance)
Projected TPs:
1TP=~23,400,
2TP=~26,700,
3TP=~30,344.49,
4TP=44000
Support/Resistance:
Red zone: ~16,700–18,300 (historical S/R and correction target and Fib Confluences)
Resistance zone: ~23,000–23,400 ,
22000(ATH area)
Key Technical Observations:
Fibonacci Retracement from ~20674 to ~15732 marks the initial corrective range.
Trend-Based Extensions forecast:
TP1 (~23,400): First breakout resistance
TP2 (~26,700): Medium-term expansion zone
TP3 (~30,344): Long-term target if macro tailwinds persist
Scenario Pathways:
Bullish Continuation: Breaks above ATH to reach TP2/TP3
Healthy Correction: Pullback to ~20,600 or deeper ~18,300 before resumption
Deep Correction: Revisits ~16,700 zone if macro environment deteriorates
Fundamental Context:
Tech Stocks & Economic Sentiment: NDX is often the first to move during liquidity expansions. Its performance signals risk-on behavior across global equity markets.
Rate Cuts in 2025: With anticipated Fed rate cuts, tech stocks are primed for inflows. Forward earnings valuations rise, justifying extended upside in high-beta tech.
AI Boom & Earnings Growth: Nasdaq is heavily weighted toward AI, cloud, and semiconductors—sectors expected to lead earnings surprises.
NDX Influence on Gold and Crypto
When NDX rallies:
Crypto: Risk appetite improves. Capital rotation flows into altcoins and layer-1 assets.
Bitcoin: Often sees parallel inflows, especially during strong tech rallies (e.g., 2020).
TOTAL & TOTAL3: Begin breakout patterns if NDX continues to surge.
Gold: May stall or correct as investors favor risk assets. However, gold still holds due to macro hedging and real yield pressures.
When NDX corrects:
Crypto: Volatility spikes. Altcoins bleed faster.
Bitcoin: Short-term dip but may decouple if viewed as digital gold.
Gold: Benefits from flight-to-safety behavior.
US10Y: Often reacts inversely to NDX moves—used for confirmation.
Search Highlights (2024–2025):
Institutions view NDX correction as signal to rotate into commodities (incl. gold).
Cross-market correlations show NDX peaks often precede crypto mini-rallies.
De-risking from NDX often triggers gold strength, especially in geopolitical or inflationary backdrops.
Bias & Strategy Implication
Primary Bias: Bullish
Expecting upside continuation to 26,700–30,000 zone
Multiple correction opportunities are present even during rally
Strategic Actions:
Monitor for correction to yellow/red zones for accumulation
Use NDX behavior as leading macro signal for crypto rotations
Watch resistance at 23,400 closely; breakout confirms trend extension
Time Horizon
Short-Term (1–2 months): Watch for breakout or correction to ~20,600–18,300
Mid-Term (3–6 months): Probable test of ~26,700
Long-Term (6–12 months): Potential expansion to ~30,344.49

Who find this 3monthly candle trend line fascinating?short term 26665 long term 30030
26665 Oct 2025 if not 27958 Jan 2026 if not then April 2026
s3.tradingview.com

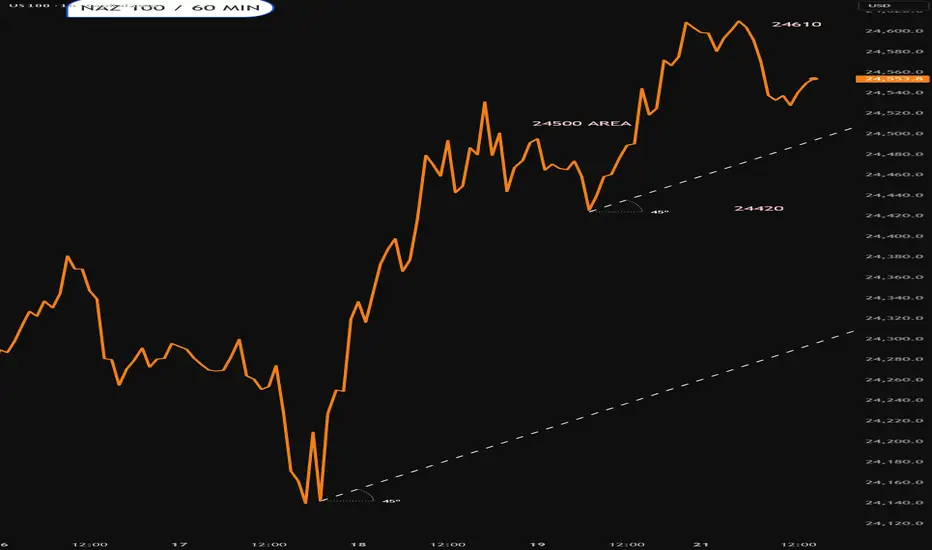
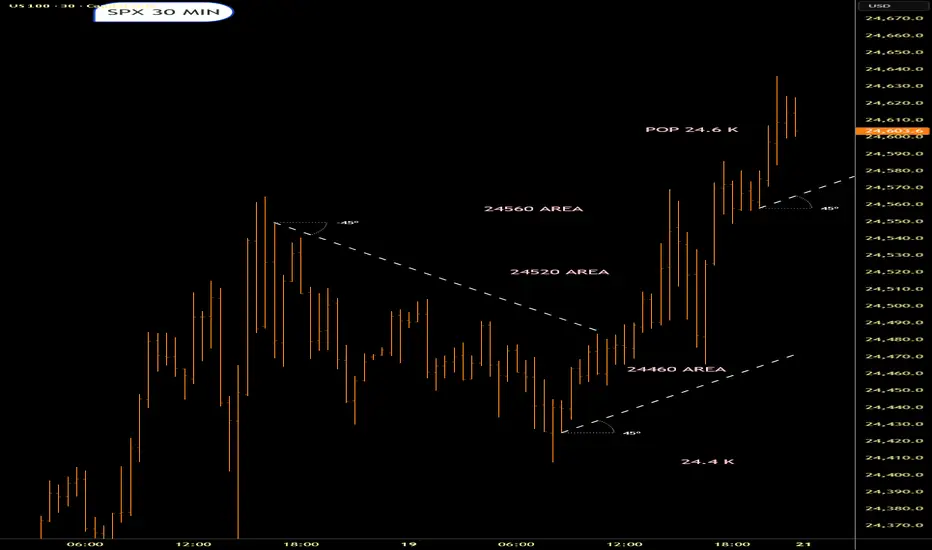
Naz 100 into the new weekWe either pop 24.6K or test those lower poss supp areas.Lets see what happens

nas100 4hTrading Perspectives for the Upcoming Week
In this series of analyses, we have reviewed short-term trading perspectives and outlooks.
As can be seen, in each analysis there is a significant support/resistance zone near the current asset price. The market’s reaction to or break of this level will determine the future price trend up to the next specified levels.
Important Note: The purpose of these trading perspectives is to examine key price levels and the market’s potential reactions to them. The analyses provided are by no means trading signals!

Buy Opportunity Nas100Nas100 is bullish, therefore, this coming week we still looking for buys.
A lot of buyers will step into the market on the 3rd touch of the trend line, but the market will take those buyers out because there is a demand zone and liquidity below the trend line.
I believe the market will break the trend line, go towards the demand zone, and grab liquidity below that demand zone before continuing in its bullish momentum. It might even go towards the daily key level at 23900 before continuing up. Therefore, once we reach the demand zone, it is important that we drop to lower time frames and look for buying opportunities, being mindful of the liquidity zone. Do not take an aggressive entry, look for change of character on lower time frames before taking a buy position.

NAS100 HL's to HH's...Guaranteed 2With the fiasco of volatility driven trading days of the FOMC interest rate decision behind us, it is time to refocus our attention on the business at hand and it is the retracement to formulate the next HL to complete another #guaranteed ATH.
We are not bearish and we are not trading sells...only waiting for the next HL to continue the buys.
You would have noticed that last Wednesday when the volatility hour of 2:00pm - 3:00pm subsided that all we ended with was increased volatility, blown accounts and a host of news-driven traders wondering what just happened and questioning why the markets are not falling.
For this week, we will continue to see the market making HL's to HH's:
1. Our first trade will be a HL formed on the H1 or higher timeframe.
2. Our TP's will be on the HH or a LH if the market get's caught in some early consolidation cycle.
3. Then we will wait and repeat the process again and again and again
Have a great week guys.
Remember:
There is only #oneauberstrategy
Often imitated...
Often criticized...
But never duplicated
We are unapologetically bullish
HL's to HH's are always #guaranteed on the largest timeframe
#aubernation
#oneauberstrategy

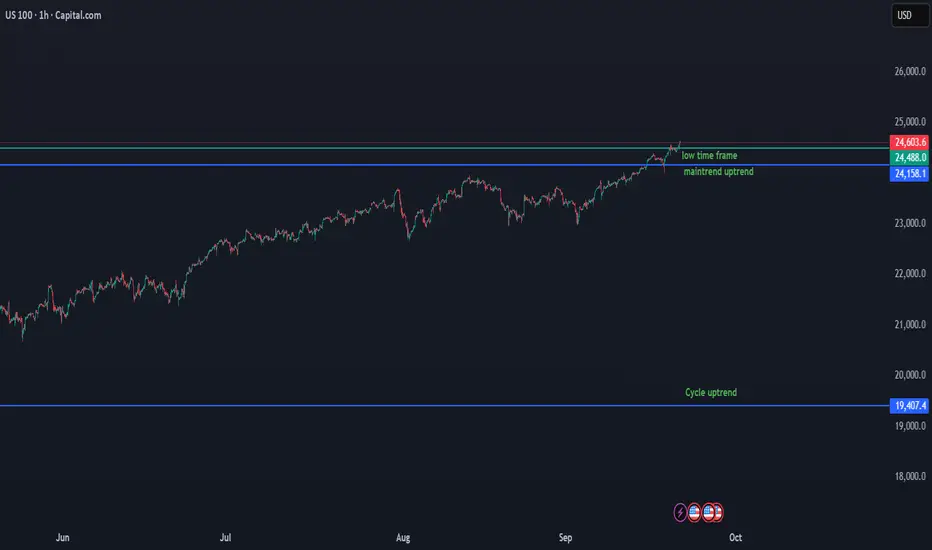
US100 Key Levels & Trend OutlookUS100 Update
We use advanced data that counts the start of the cycle and all important key levels.
On the low time frame, Nasdaq is consolidating just above the 24,516 – 24,488 support zone, which now acts as the key base for continuation.
Key levels:
24,516 – 24,488 → critical short-term support. Holding above confirms continuation of the uptrend.
24,603+ → current resistance. A clean breakout and hold above this level would extend bullish momentum and push toward new highs.
Downside risk: If price breaks back below 24,488, the next support sits around 24,158. A deeper breakdown from there could open a correction toward 23,404.
Cycle support: 19,407 is the major cycle uptrend level. Nasdaq must stay above this to keep the long-term bullish structure intact.
📌 Summary
Above 24,516 – 24,488 → bullish continuation in play.
Break & hold above 24,603 → signals further upside.
Below 24,488 → correction risk, first support at 24,158, then 23,404.
19,407 → cycle-level support for the long-term trend.
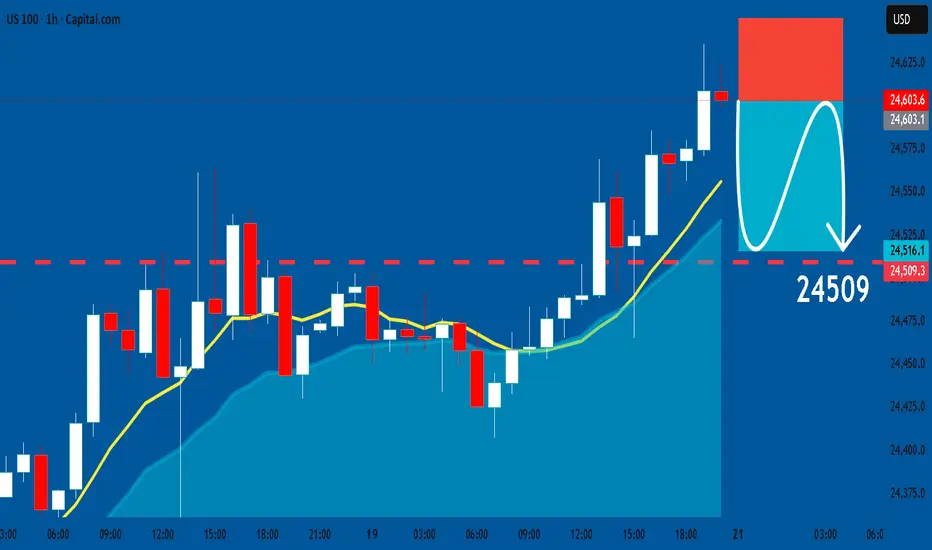
US100: Short Signal with Entry/SL/TP
US100
- Classic bearish formation
- Our team expects fall
SUGGESTED TRADE:
Swing Trade
Sell US100
Entry Level - 24603
Sl - 24651
Tp - 24509
Our Risk - 1%
Start protection of your profits from lower levels
Disclosure: I am part of Trade Nation's Influencer program and receive a monthly fee for using their TradingView charts in my analysis.
❤️ Please, support our work with like & comment! ❤️
3 CANDLE PUSH?Will this be a three candle push higher before we retrace to the order block below with a FVG, or will we immediately take the highs of the current daily candle and then draw back below? Only Monday can tell I envy those that will be here to witness it all

NasdaqNasdaq After breaking through 24500, it broke through 24550 with a pullback confirming consolidated support. Buying pressure continues; we can wait for the resistance at 24600 to break and reach 24750.

NasdaqNasdaq has just broken through the 24500 level. Candlestick wicks have shown selling interest at this level, but buyers are still in control. This will soon become consolidated support, and we could reach 24750.

17.09.2025 US100 H1 Long
Good morning, everyone,
U100 H1 Long
Only tradable on HTF in my opinion. BP, why waste time and energy on small counter trades when it can be so easy?
Yes, it can go wrong, of course... but the trend is your friend.
Today's news is therefore only tradable in my opinion; everything else is too risky for me.

Again, with short term NAS 100 idea.Risk Reward ratio is one of the most important things in trading, never forget to apply safety measures to every trading plan you have.

NAS100 H4 | Bullish continuation in playUS100 has bounced off the buy entry at 23,984.23, which is a pullback support and could rise from this level to the upside.
Stop loss is at 23,721.86, which is an overlap support.
Take profit is at 24,853.60, which aligns with the 61.8% Fibonacci projection.
High Risk Investment Warning
Trading Forex/CFDs on margin carries a high level of risk and may not be suitable for all investors. Leverage can work against you.
Stratos Markets Limited (tradu.com ):
CFDs are complex instruments and come with a high risk of losing money rapidly due to leverage. 65% of retail investor accounts lose money when trading CFDs with this provider. You should consider whether you understand how CFDs work and whether you can afford to take the high risk of losing your money.
Stratos Europe Ltd (tradu.com ):
CFDs are complex instruments and come with a high risk of losing money rapidly due to leverage. 66% of retail investor accounts lose money when trading CFDs with this provider. You should consider whether you understand how CFDs work and whether you can afford to take the high risk of losing your money.
Stratos Global LLC (tradu.com ):
Losses can exceed deposits.
Please be advised that the information presented on TradingView is provided to Tradu (‘Company’, ‘we’) by a third-party provider (‘TFA Global Pte Ltd’). Please be reminded that you are solely responsible for the trading decisions on your account. There is a very high degree of risk involved in trading. Any information and/or content is intended entirely for research, educational and informational purposes only and does not constitute investment or consultation advice or investment strategy. The information is not tailored to the investment needs of any specific person and therefore does not involve a consideration of any of the investment objectives, financial situation or needs of any viewer that may receive it. Kindly also note that past performance is not a reliable indicator of future results. Actual results may differ materially from those anticipated in forward-looking or past performance statements. We assume no liability as to the accuracy or completeness of any of the information and/or content provided herein and the Company cannot be held responsible for any omission, mistake nor for any loss or damage including without limitation to any loss of profit which may arise from reliance on any information supplied by TFA Global Pte Ltd.
The speaker(s) is neither an employee, agent nor representative of Tradu and is therefore acting independently. The opinions given are their own, constitute general market commentary, and do not constitute the opinion or advice of Tradu or any form of personal or investment advice. Tradu neither endorses nor guarantees offerings of third-party speakers, nor is Tradu responsible for the content, veracity or opinions of third-party speakers, presenters or participants.

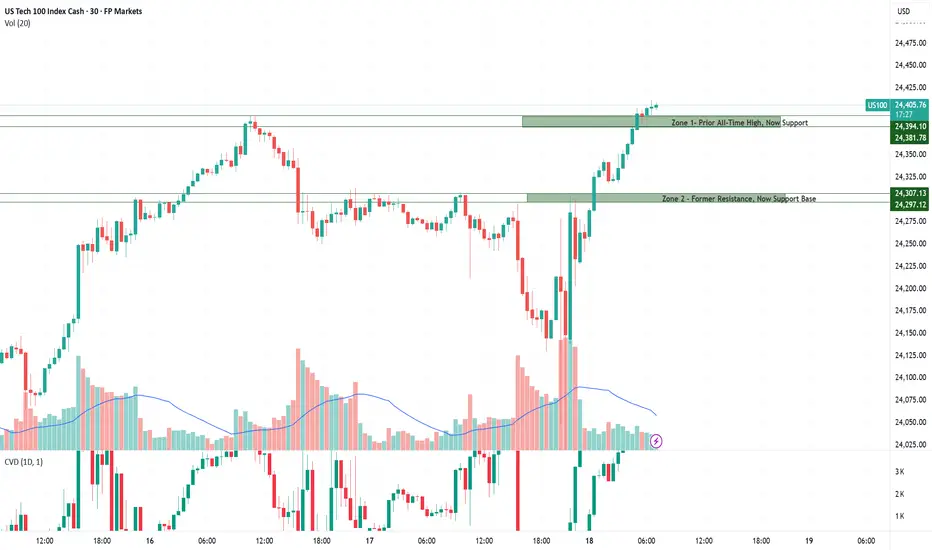
Nas100 - Trading zones at all time highWith price pushing into fresh all-time highs, reliable technical zones become harder to define due to the lack of historical data. This increases uncertainty and makes it essential to treat the zones as guidance rather than fixed buy or sell levels. Volatility tends to rise around record territory, so traders should remain cautious.
Zone 1 – Prior All-Time High, Now Support:
Yesterday’s all-time high has now turned into a support zone after being broken to the upside. This level may hold as a launchpad for further bullish continuation, but traders should remain cautious — if price drops back below, it could trigger a sharp reversal.
Zone 2 – Former Resistance, Now Support Base:
This area has been tested multiple times, making it a high-activity zone. Yesterday it acted as resistance, but after being broken, it now serves as support. Buyers may defend this area on a retest, but if it fails, momentum could shift quickly to the downside.
This area has been tested multiple times, making it a high-activity zone. Yesterday it acted as resistance, but after being broken, it now serves as support. Buyers may defend this area on a retest, but if it fails, momentum could shift quickly to the downside.
Market sentiment turned cautiously optimistic after the Fed delivered its first 25bp rate cut of the year, lowering the policy rate to 4.00–4.25%. Hopes for further easing later in 2025 are supportive for growth stocks and the Nasdaq-100, yet Powell’s remarks highlighted lingering risks from both inflation and a cooling labor market. As a result, volatility remains elevated, and while the bias is tilted higher, confidence in sustained momentum is still fragile.
Nas100 Trade Set Up Sep 17 2025www.tradingview.com
Price swept PDL already and has come up but there is a 1h FVG that it will need to invert to go any higher to PDH or price will push lower, target SSL before possibly coming back up


Naz 100 .Bulls are there.Rez is loomingTrend is up.No sign of a turn as yet.Could quite easily pop higher

Nas100 – Today's Trading Zones Analysis 17 sep.Trading Zones
As price trades around all-time highs, the amount of historical data to build strong zones is limited. This makes the current levels less reliable, and traders should approach them primarily as guidance rather than decisive turning points.
Zone 1 – All-Time High / Yesterday’s High:
This area marks the recent record peak. While it can act as resistance in the short term, its strength is uncertain due to limited data. Price reactions here may be volatile and driven more by sentiment than structure.
Zone 2 – Yesterday’s Low:
A lighter support level that can provide intraday reactions but lacks deep structural confirmation. Best used as a reference point rather than a major decision area.
Zone 3 – Strong Support / High Profitability for Momentum:
This is the most significant zone on the chart, where strong buyers have previously stepped in. It carries a higher probability of triggering a strong reaction. That reaction could unfold as a bounce higher if demand holds, or as a sharp move lower if the zone breaks decisively.
All eyes are on today’s Fed meeting , where markets widely expect a 25bp rate cut. While the move is largely priced in, the real focus will be on Powell’s tone and the updated dot plot, which will guide expectations for the pace of easing ahead. Sentiment in the US100 remains cautiously optimistic, supported by strong tech momentum and softer inflation data, but with price trading at record highs, volatility is likely to spike if the Fed delivers any surprises.
