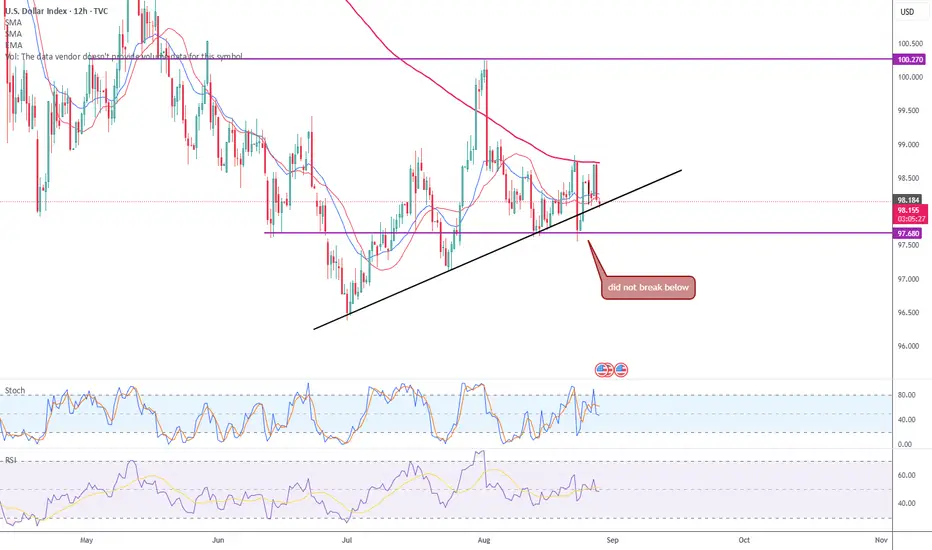
DXY Back to Monday Start low after price just comfirmed today our weekly cot that bullish momentum for this week so we can expect more bullish momentum moving forward. As we rejected to break below for change of structure from bullish to bearish.
DXY trade ideas

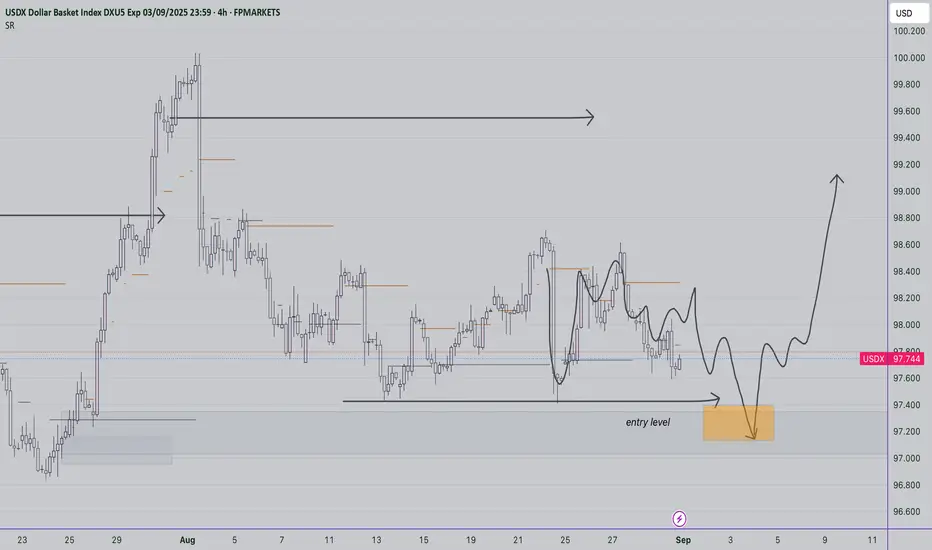
DXY 4HTrading Outlook for Major Currency Pairs and Indices, Especially Gold and Silver, in the Upcoming Week
In this series of analyses, we have reviewed short-term trading perspectives and market outlooks.
As can be seen, each analysis highlights a key support or resistance area near the current price of the asset. The market’s reaction to or break of these levels will determine the subsequent price trend up to the next specified levels.
Important Note: The purpose of these trading outlooks is to identify key price levels and potential market reactions, and the analyses provided should not be considered as trading signals.

USD/CAD, GBP/USD, EUR/USD Video of my trades last week.My 3rd video explaining my trades for last week 25-29nd August and the week ended with a nice profit of 2.58%.
If you have any questions send me a message here or on X and enjoy the weekend.

DXY WILL GO UP|LONG|
✅DXY fell again to retest
The support of 97.600
But it is a strong key level
So I think that there is a high chance
That we will see a bullish
Rebound and a move up
LONG🚀
✅Like and subscribe to never miss a new idea!✅

idea for us dollarSimple structural follow up D (the general macro trend is short) ; tp at 99.5 to then let's see what he does to us
Possible entry on the zone
Supply + liquidity hunt = breakout failure1.This breakout failed because it lacked consolidation strength and ran directly into a strong supply/FVG zone.
2.Liquidity above the trendline was hunted, trapping breakout buyers.
3.Momentum was weak, with no strong volume or follow-through.
4.The higher timeframe bias was still bearish, limiting upside potential.
Without retest and acceptance above resistance, the move couldn’t sustain.
⚡ Key Points
📝Trendline break without consolidation.
📝Rejection from FVG / supply zone.
📝Liquidity grab above highs.
📝Weak momentum and no follow-through.

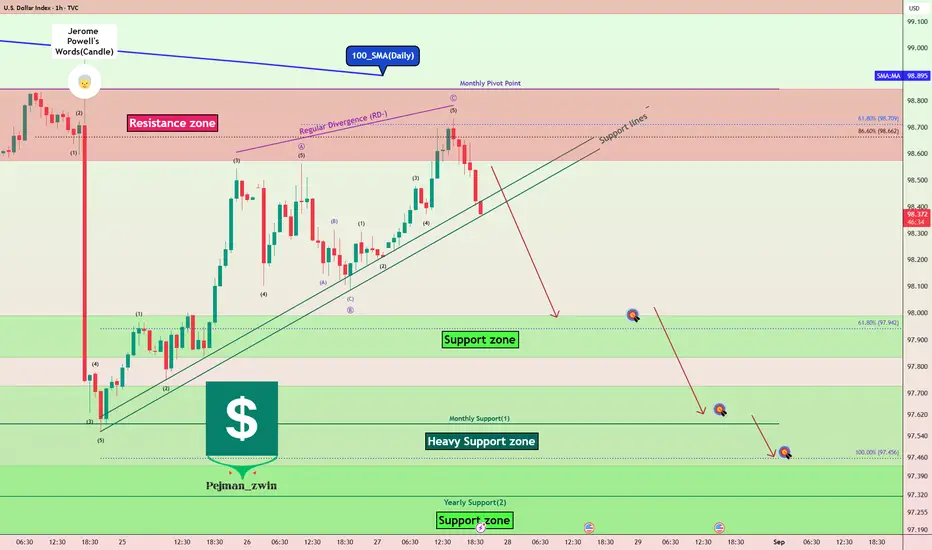
DXY Analysis: Resistances Holding Strong, Is the Downtrend Back?Today, I want to analyze one of the important indices of the financial markets , the U.S. Dollar Index ( TVC:DXY ), for you, which can be a guide for taking short-long positions in the Forex , Futures , and even Crypto markets.
The DXY index fell by about -1.2% after Jerome Powell began talking about the possibility of a rate cut in September , but as the new week began, the DXY index started to rise again.
If we look at the DXY Index chart on the 1-hour time frame , we can see that the DXY Index reacted well to the Resistances and started to decline.
The Resistances for the DXY Index include:
Resistance zone($98.843-$98.575)
Monthly Pivot Point
100_SMA(Daily)
In terms of Elliott Wave theory , it seems that this increase in the DXY Index over the last two days has been in the form of corrective waves . The structure of the corrective waves is Zigzag Correction(ABC/5-3-5). By breaking the Support lines , we can confirm the end of the corrective waves .
Also, we can see the Regular Divergence(RD-) between Consecutive Peaks .
I expect the DXY Index to decline to at least the Support zone($97.989-$97.834) AFTER breaking the Support lines .
Second Target: $97.650
Third Target: $97.450
Stop Loss(SL): $99.000
Note: With the DXY Index declining, we can expect more hope for a weakening of the U.S Dollar's strength in the major Forex pairs .
Please respect each other's ideas and express them politely if you agree or disagree.
U.S. Dollar Index Analyze (DXYUSD), 1-hour time frame.
Be sure to follow the updated ideas.
Do not forget to put a Stop loss for your positions (For every position you want to open).
Please follow your strategy and updates; this is just my Idea, and I will gladly see your ideas in this post.
Please do not forget the ✅' like '✅ button 🙏😊 & Share it with your friends; thanks, and Trade safe.
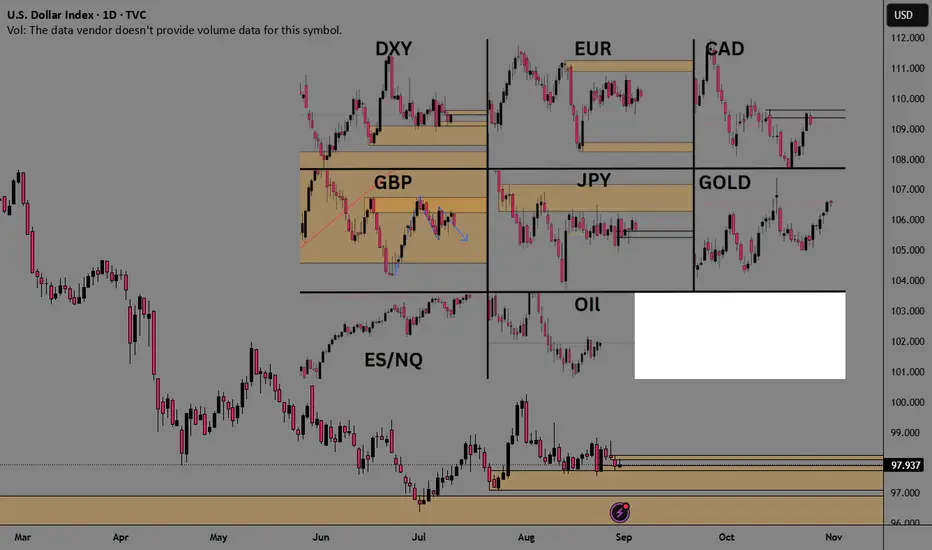
Current Price Action All MarketsWanted to share a picture of the daily TF price action of the major markets.
1) August has been a very slow market for forex. Nothing but chop... Especially over the last 3 weeks.,
2)Stocks and gold have seen a slow grinding uptrend.,
Each market is unique in its own right and benefits not only different types of traders, but also different setups perform better during specific market conditions. It's essential to trade various types of market conditions to suit your style, as well as when you perform at your best and worst.
DXY | Major Cycle Peak – Is the Dollar Losing Its Grip?The U.S. Dollar Index (DXY) appears to be following a well-defined historical cycle, marking major peaks approximately every 15–20 years. If history repeats, the 2022 peak near 114 could signal the beginning of a multi-year dollar decline, impacting global markets, commodities, and currency pairs like EUR/USD.
Historical Peaks & Reversals
Examining past DXY cycles, we see:
969 Peak (~120): Followed by a prolonged decline into the 1970s.
1985 Peak (~165): Marked by the Plaza Accord, triggering a sharp dollar downtrend.
2001 Peak (~120): Led to a multi-year decline as the Fed shifted policies.
2022 Peak (~114): The most recent high—could it mark the next major reversal?
Each peak historically aligns with aggressive Fed tightening cycles, followed by a shift towards easing policies, leading to a weaker dollar. With U.S. interest rates expected to plateau or decline, this pattern suggests a potential long-term bearish trend for the dollar.
Implications of a Weaker Dollar
Bullish for EUR/USD – A declining DXY typically strengthens the euro.
Boost for Commodities – Gold, oil, and other dollar-denominated assets could rally.
Stronger Emerging Markets – A softer dollar eases financial conditions globally.
With DXY showing signs of a historical cycle peak, investors and traders should watch for confirmation of a multi-year downtrend, potentially reshaping global markets.

$DXY: Dollar Strength or Dollar Dip?(1/9)
Good afternoon, everyone! 🌞 DXY: Dollar Strength or Dollar Dip?
With the DXY at 103.732, is the dollar flexing its muscles or ready to stumble? Let’s break it down! 🔍
(2/9) – PRICE PERFORMANCE 📊
• Current Price: 103.732 as of Mar 14, 2025 💰
• Recent Move: Near recent levels, down from 110.18 peak (web data) 📏
• Sector Trend: Forex markets volatile, with trade and policy shifts 🌟
It’s a wild ride—dollar’s dancing on the edge! ⚙️
(3/9) – MARKET POSITION 📈
• Role: Measures USD vs. euro, yen, pound, and more 🏆
• Influence: Drives forex and commodity prices globally ⏰
• Trend: Balancing U.S. policy and global demand, per data 🎯
King of currencies, but not without challengers! 🚀
(4/9) – KEY DEVELOPMENTS 🔑
• Trade Tensions: U.S.-China tariff talks ongoing, per data 🌍
• Rate Cut Bets: Markets eyeing Fed moves, per posts on X 📋
• Market Reaction: Holding steady at 103.732 amid mixed signals 💡
Navigating a storm of global pressures! 🛳️
(5/9) – RISKS IN FOCUS ⚡
• Rate Cuts: Could weaken dollar if Fed acts, per X sentiment 🔍
• Trade Wars: Tariffs disrupting supply chains, per data 📉
• Global Growth: Slowdowns hitting demand for USD ❄️
It’s a tightrope—risks aplenty! 🛑
(6/9) – SWOT: STRENGTHS 💪
• Reserve Status: USD’s global dominance holds firm 🥇
• U.S. Economy: Still a powerhouse, supporting dollar value 📊
• Safe Haven: Attracts flows in uncertain times, per trends 🔧
Got muscle to flex when it counts! 🏦
(7/9) – SWOT: WEAKNESSES & OPPORTUNITIES ⚖️
• Weaknesses: Vulnerable to rate cuts, trade spats 📉
• Opportunities: Strong U.S. data could lift it higher, per outlook 📈
Can it hold the line or break out? 🤔
(8/9) – POLL TIME! 📢
DXY at 103.732—your take? 🗳️
• Bullish: 105+ soon, dollar rallies 🐂
• Neutral: Steady, risks balance out ⚖️
• Bearish: 100 looms, dollar dips 🐻
Chime in below! 👇
(9/9) – FINAL TAKEAWAY 🎯
The DXY’s 103.732 shows it’s steady but tested 📈. Trade wars and Fed moves could swing it either way—dips are our DCA gold 💰. Buy low, ride high—time’s the key! Gem or bust?

All eyes on the PCE todayWatching the US dollar reaction carefully today.
TVC:DXY
MARKETSCOM:DOLLARINDEX
Let us know what you think in the comments below.
Thank you.
75.2% of retail investor accounts lose money when trading CFDs with this provider. You should consider whether you understand how CFDs work and whether you can afford to take the high risk of losing your money. Past performance is not necessarily indicative of future results. The value of investments may fall as well as rise and the investor may not get back the amount initially invested. This content is not intended for nor applicable to residents of the UK. Cryptocurrency CFDs and spread bets are restricted in the UK for all retail clients.


How and why Silver May Overshoot Well Beyond 50 by 2026A description of silver price anomalies. Info is in video-only thing to add is we are going onour 6th consecutive year of silver structural demand deficits. The odds of a massive upside move intensify exponentially day to day at this point.
Do your own research

DXY TECHNICAL VIEWA bullish outlook before the drop. We react based on price reactions to related pairs

DXYDXY (US Dollar Index) Analysis
• Daily Timeframe:
The price is moving within a range and currently trading near the support zone.
• 1H Timeframe:
A clear Dow Theory structure is forming as the market continues to make Lower Highs (LHs) and Lower Lows (LLs).
• Expectation:
There is a high probability that the price may continue downward to test the support level.
Trading Idea:
You can look for a short-term sell entry towards the support area with a 1:1 risk-to-reward ratio
Conclusion: If the support breaks, further bearish continuation is likely. However, if the support holds, a potential reversal can be expected.

DXY INDEX SELL OFFThe Dollar Index may plunge to 89.21 by March of 2026 or lower. Based on W.D. Gann 60 week cycle it has been dropping since January of 2025. In my opinion if the Dollar Index is dropping maybe this is why the precious metals like Gold, Silver and Platinum are starting to make new highs.

Bullish DXYThis is a follow-up analysis that i did sometime in June, DXY still looking bullish from monthly timeframe, now confirmation by inverted Head and shoulder pattern

DXY BullishDollar index was showing some downward trend but now there is bullish divergence and we can take buy entry for some good gains keeping the last low as stop loss.

EURUSD and DXY - Reading Instituitonal Order FlowHi there,
It's been a while since my last post. Just catching up on my favourite pair, the EURUSD, and of course not missing out on the DXY for comparative analysis as it is heavily tied to the strength of the EURUSD.
For those new, these are ICT Concepts, with my own touches in it. Hope you enjoy
Happy trading!
- R2F Trading

Change in TrendIt seems the DXY is presenting an inverse H&S pattern. Let's give it few weeks to unfold and reveal itself.

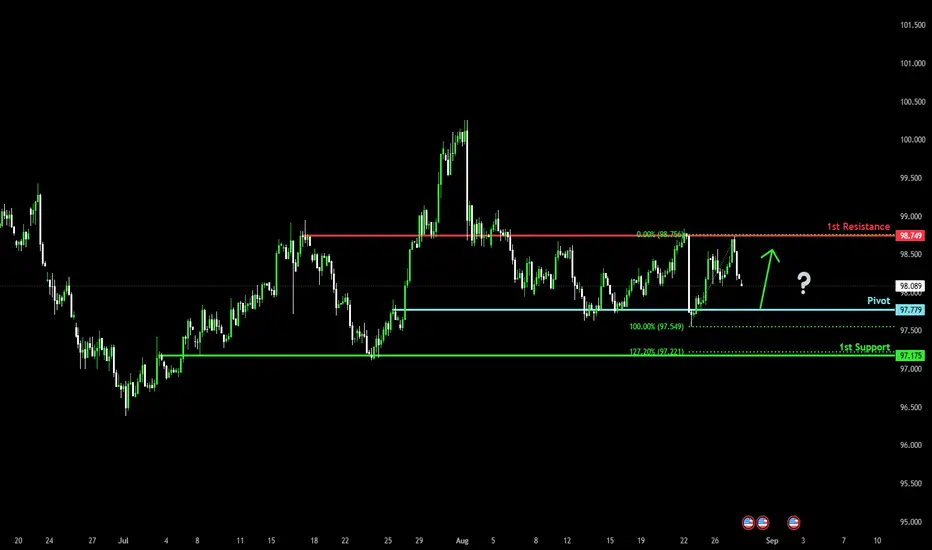
Bullish Bounce off Key Support?US Dollar Index (DXY) is falling towards the pivot and oculd bounce to the 1st resistance.
Pivot: 97.77
1st Support: 97.17
1st Resistance: 98.74
Risk Warning:
Trading Forex and CFDs carries a high level of risk to your capital and you should only trade with money you can afford to lose. Trading Forex and CFDs may not be suitable for all investors, so please ensure that you fully understand the risks involved and seek independent advice if necessary.
Disclaimer:
The above opinions given constitute general market commentary, and do not constitute the opinion or advice of IC Markets or any form of personal or investment advice.
Any opinions, news, research, analyses, prices, other information, or links to third-party sites contained on this website are provided on an "as-is" basis, are intended only to be informative, is not an advice nor a recommendation, nor research, or a record of our trading prices, or an offer of, or solicitation for a transaction in any financial instrument and thus should not be treated as such. The information provided does not involve any specific investment objectives, financial situation and needs of any specific person who may receive it. Please be aware, that past performance is not a reliable indicator of future performance and/or results. Past Performance or Forward-looking scenarios based upon the reasonable beliefs of the third-party provider are not a guarantee of future performance. Actual results may differ materially from those anticipated in forward-looking or past performance statements. IC Markets makes no representation or warranty and assumes no liability as to the accuracy or completeness of the information provided, nor any loss arising from any investment based on a recommendation, forecast or any information supplied by any third-party.
DOLLAR INDEX (DXY)DXY (WEEKLY CHART)
DOLLAR INDEX:
Current rates are clear now in the US. Rates are very close to fair value on the US Treasury market. I’m in the waiting books on this one, another long term year(s) to invest here. Technicals show, there is some sellside liquidity to sweep.
- C.N Skolo
(Journal FX Charts)
