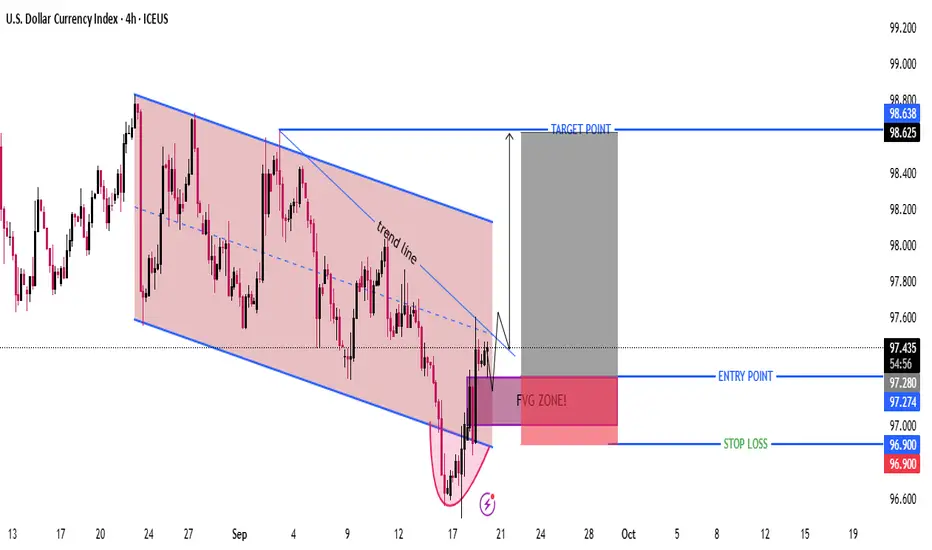
DXY 4H – Bullish Reversal Setup from FVG Zone | Target 98.63Technical Analysis
Downtrend Channel (Bearish Structure)
Price has been moving inside a descending channel (highlighted in red).
Recently, it touched the lower boundary and formed a rounded bottom pattern (possible reversal signal).
Trendline Breakout
A short-term downtrend line has been broken to the upside.
This suggests momentum is shifting from bearish to bullish.
Fair Value Gap (FVG Zone)
Price is currently testing an FVG zone around 97.00–97.28.
This zone acts as a potential entry area for long trades.
Entry, Stop Loss, and Target
Entry Point: 97.28 – 97.27
Stop Loss: 96.90 (below FVG zone support)
Target Point: 98.63
Risk–Reward Ratio: Approximately 1:3 → good setup.
Potential Scenario
If price holds above the FVG zone and doesn’t break below 96.90, we may see a bullish move toward 98.63.
But if the FVG fails and price closes below 96.90, it could resume the downtrend.
✅ Summary:
Market structure shows a possible bullish reversal after a prolonged downtrend.
A clean long setup is planned: Buy near 97.27 → Stop 96.90 → Target 98.63.
Confirmation needed: Strong bullish candle closing above the FVG zone
DXY trade ideas
DOLLAR/GOLD/RATESDXY is sitting at a key monthly support.
Gold is getting extremely hot.
is it time for a flip? majority sentiment feels like gold is going up forever (i agree to an extent, but im not against some pullback/higher lows first)
FED mentioned inflation was a bit sticky.
sharing purely to see how she ages
GOLD = red
DXY = BLUE/BLACK

DXY: The Market Is Looking Down! Short!
My dear friends,
Today we will analyse DXY together☺️
The recent price action suggests a shift in mid-term momentum. A break below the current local range around 96.755 will confirm the new direction downwards with the target being the next key level of 96.629 and a reconvened placement of a stop-loss beyond the range.
❤️Sending you lots of Love and Hugs❤️
The dollar making fresh yearly lows for the FedThe dollar making fresh yearly lows yesterday for the Fed decision. 95 looks close. At some point the dollar will be on sale. Last time Trump was elected the dollar went on sale in early 2018 after a year of selling off. Will the dollar be on sale next year?
US Dollar Index - Looking To Sell Pullbacks In The Short TermM15 - Strong bearish move.
No opposite signs.
Currently it looks like a pullback is happening.
Expecting bearish continuation until the two Fibonacci resistance zones hold.
If you enjoy this idea, don’t forget to LIKE 👍, FOLLOW ✅, SHARE 🙌, and COMMENT ✍! Drop your thoughts and charts below to keep the discussion going. Your support helps keep this content free and reach more people! 🚀
-------------------------------------------------------------------------------------------------------------------

Weekly Review: Dollar Weakness, Equities Rally, Crypto at resis'Abstract
This week’s market action painted a consistent story: the dollar fell hard, global yields softened, and equities rallied toward resistance.
Meanwhile, commodities (oil, gold, copper) strengthened, supporting a reflationary tone. The main caution flag: volatility gauges (VIX & VVIX) are rising, hinting that this risk‑on rally might not be bullet‑proof.
In crypto, BTC and ETH tested overhead resistance with weak volume — optimism is there, but conviction is not.
🚨 Special Focus: September 17th Fed Cut
The Federal Reserve’s September 17th policy decision is the most important catalyst this week. A rate cut at 2 PM EST has direct and immediate implications for all the moves outlined below:
Dollar Impact: Cuts weaken the dollar further, amplifying this week’s oversold DXY.
Yields: A cut locks in the recent fall in bond yields, making equities and gold more attractive.
Equities: Would justify current rallies but also risks looking like “policy panic”, which can spur volatility.
Commodities: Oil and Gold respond positively to looser policy → reflation + hedging.
Crypto: Historically benefits from Fed easing, but watch if BTC can actually break resistance when liquidity improves.
Interpretation: September 17th could either validate the risk‑on rally, or reverse it sharply if markets fear the Fed is cutting because economic weakness is worse than expected. Traders should mark 2 PM EST as a volatility event across Dollar, Yields, Equities, Commodities, and Crypto.
👉 Chart reference: US10Y
1. Dollar & FX: Oversold Break
DXY dropped to ~96.6, oversold on RSI (26) after repeated breaks of structure.
EURUSD surged past 1.18, entering overbought momentum.
USDJPY and USDCAD both slipped lower, aligning with dollar weakness.
USDINR weakened to 88.0 → 87.85 POI, showing INR strength matched with NIFTY breakout.
Interpretation: The dollar is oversold and losing momentum — normally bullish for risk assets. But extreme RSI means a technical bounce is possible.
👉 Chart here: DXY / EURUSD
2. Yields: Relief for Equities
US10Y at 4.03%, US30Y at 4.65% — both off highs, easing pressure on stocks.
CA10Y fell to 3.16%, tailwind for CAD and TSX.
IN10Y steady ~6.49%, supportive backdrop for India.
Interpretation: Lower yields = fresh air for equities. Bonds validating a mild risk‑on bias.
👉 Chart here: US10Y / Global Yields
3. U.S. Equities: Bulls in Control
S&P 500 at 6607, up ~2.9% this week, testing resistance.
Nasdaq 100 jumped 3.5%, now overbought on RSI.
Dow Jones up 1.7%, steady breadth support.
Interpretation: U.S. indices are riding the yield drop, but now pressing major resistance zones. Easy money for bulls is fading — the next leg requires stronger conviction.
👉 Chart here: SPX (NDX and DJI showing similar characteristic on their respective charts)
4. Global Equities: India & Canada Stand Out
NIFTY broke to 25,239, clean resistance breakout, INR strength aligned.
TSX surged 3.7% with oil, CAD, and yields falling in sync.
EuroStoxx (SX5E) consolidated flat — showing Europe still lagging.
Interpretation: The best relative strength came from India and Canada. Europe lagged, lacking energy leverage.
👉 Chart here: NIFTY / TSX
5. Commodities: Reflation Pulse
Oil climbed to $64.6, breaking resistance.
Gold at $3695 (+2.6%), safe‑haven demand still alive.
Copper to $4.70, break higher supportive for growth assets.
Interpretation: Energy and metals are supporting the equity rally. Gold rising alongside = investors hedging tail risk too.
👉 Chart here: Oil / Gold
6. Volatility: Under the Hood
VIX back up to 16.4, rising after being crushed.
VVIX surged to 104, volatility of vol is warning of unstable positioning.
IndiaVIX collapsed below 11, reflecting too much complacency locally.
Interpretation: While equities scream “bull!”, vol warns risk management is key. This is not free money.
👉 Chart here: VIX
7. Crypto: Resistance Check
BTC at 116.6k and ETH at 4.5k: both testing resistance with weak volumes.
BNB surged +5.7%, outperformed majors.
SOL held above 228–236, neutral bias.
XRP stuck near 3.0, chopping sideways.
Interpretation: Trend is up in sympathy with equities, but risk of rejection at resistance is very real. Without stronger volumes, crypto remains a “show me” trade.
👉 Chart here: BTC
💡 Big Picture Takeaway
Dollar tanking = equity and commodity rally fuel.
Yields easing = confirms risk‑on conditions.
Equities at resistance with rising vol = bulls in control, but fragility building.
Crypto is lagging in volume — it benefits from macro tailwind but not leading.
Best relative strength: NIFTY, TSX, Oil, Gold.
Fed rate cut on Sep 17 = the true decision point for trend continuation or reversal.
🎯 Conclusion — Risk‑On, But Fed Holds the Key
Markets rewarded risk this week as the dollar collapsed and yields faded. But overbought equities, crypto resistances, and rising volatility gauges warn that the move is not bullet‑proof.
The September 17th Fed cut at 2 PM is the ultimate test. If the cut is seen as proactive stimulus, the rally has room to extend. If it’s read as a panic signal, what looks like risk‑on could swiftly unwind.
✅ Bias for the coming week: constructive risk‑on until the Fed cut, then stand ready for sharp volatility.
📌 For traders: Buy dips in leaders (NIFTY, TSX, commodities) before the Fed — reduce leverage into decision. For investors: Stay allocated with hedges in vol and gold.
ICEUS:DXY FX_IDC:USDINR CMCMARKETS:USDCAD CMCMARKETS:EURUSD TVC:US10Y CBOE:SPX NASDAQ:NDX DJ:DJI NSE:NIFTY TSX:TSX TVC:SX5E NYMEX:CL1! OANDA:XAUUSD TVC:VIX CRYPTO:BTCUSD
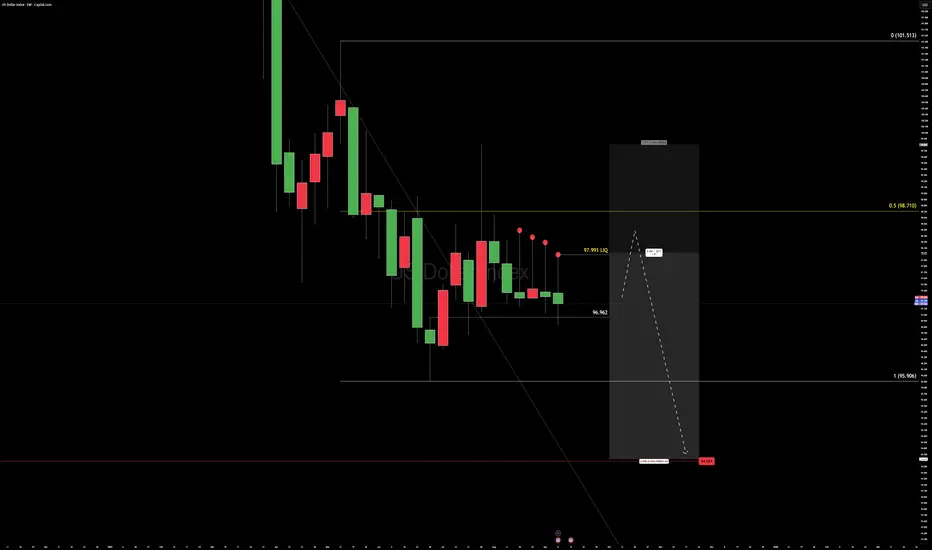
LIQUIDITY SWEEP ON DXY BEFORE FALLINGIn this weekend dollar index analysis presentation, my thesis is sideways liquidity sweep before a daily bear flag breakout to the downside. Momentum and RSI on the higher timeframe are still to downside suggesting more selling. Price is still trapped below all our moving averages confirming our trend bias. On the weekly time frame we have a couple of inverted candles at a fib 0.618 support zone suggesting a likely reversal from a higher low but I think these inverted candles are liquidity sweeps from the 0.382 fib retrace resistance level. The daily chart has a strong shooting star which initiated selling pressure to the current trendline support level at 97.432 where our last daily candle was a doji indecision or pause.
In the coming first trading week of September, I will be watching for clear break of the trendline on the daily chart and a confirmed breakout of the fib 0.618 support zone at 97.187 for an initial target of 96.702 and final target of 96.155.
Thank you and have a great profitable trading new month. Cheers!!

USD Index to fall fast - Mar-a-largo AccordUSD Index to fall fast - Mar-a-largo Accord
Dr Stephen Miran (Whitehouse Chief Economic advisor) set the plan for a weaker USD going forward and vast tariffs to rebalance the US trade deficit.
Yellow arrow indicates the start of 2025 and the trade tariffs. Red arrow indicates likely downward breakout of the long-term Uptrend support line.

Hmmm, DXYThere is something quite telling about the DXY that has me rubbing my chin. If the DXY continues it's downtrend this year and even next year, what would it mean for assets against the dollar, especially crypto currencies, mainly Bitcoin? Typically, Bitcoin's 4 year cycle is bearish on the 4th year but that was for the last 15 or so years when the dollar was in an uptrend. What would happen on the fourth year for Bitcoin during a crashing DXY? Is it safe to hold crypto currencies this end of cycle? I have a feeling that if the DXY continues to fall, crypto will continue to rise even during the 4th year when the bears usually take over. The take over may happen, but with a minor correction (32.8 possibly) that whiplashes a bit more than it trends, before it trends again. Stay tuned!

DXY Bearish The DXY is expected to remain bearish until it reaches the 94.00–92.00 levels, with the possibility of dropping even further below those levels

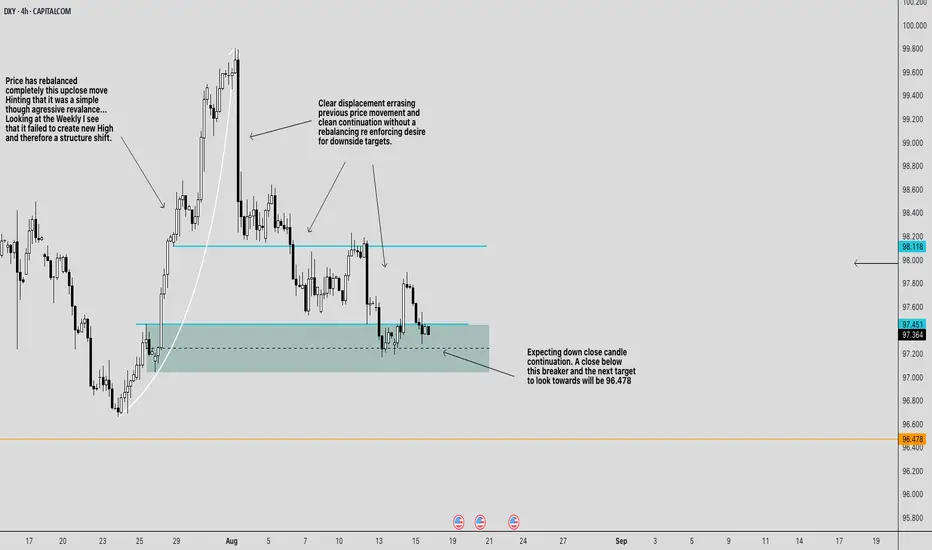
BEARISH CONTINUATION FOR DXYBearish Bias for CAPITALCOM:DXY
Weekly context:
The last up-move failed to print a new weekly high. Failing to create a shift in structure , so rallies are suspect.
4H structure:
We had a hard bearish displacement (large down candles) that erased prior price action and kept going without delivering a “full” rebalance. That usually means the price target remains lower .
The key zones on chart
Breaker / sell zone: \~ 97.45–97.75 (teal box). This is the prior bullish OB that failed (now acting as resistance).
Line in the sand: \~ 97.35–97.40 (dashed line through the teal). A decisive 4H close below here signals continuation.
Upside cap / invalidation area: 98.12 (cyan line) up to \~ 98.20 . Above this, the bearish sentiment weakens.
Primary downside draw: 96.478 (orange line). That’s the next obvious liquidity/inefficiency magnet on your chart.
Trade plan
Idea A — Rejection short from the breaker (preferred):
Entry: look for a rejection setup inside 97.45–97.75 (e.g., 15m/1h bearish shift after a sweep).
Stop: above the breaker and the cyan line ⇒ 98.12 (conservative) or 98.20 (safer).
Targets:
T1: 96.84 (take partials; pay yourself)
T2: 96.47.00
Idea B — Continuation after the break (confirmation play):
Trigger: a 4H close below \~97.35 .
Entry: sell the first clean pullback into 97.35–97.45 .
Stop: above 97.85–98.00 (back inside the breaker); conservative stop 98.12 .
Target: 96.478
Management & invalidation
If price rebalances deeper and closes 4H above 98.12–98.20 , the breaker is failing. Flatten shorts; reassess (potential squeeze toward 98.60–99.00 is then on deck).
If price hesitates at 97.00 , trail above the last 1H swing high to protect realized PnL while aiming for 96.478 .
News risk: Your chart flags upcoming US data (icons). Expect wicks; use hard stops and consider sizing down around releases.
Why this makes sense
* The strong displacement leg sets the draw lower.
* The teal box is a bearish breaker created by a failed bullish structure—ideal for “sell on rally.”
* The market rebalanced the prior up-close leg already; the lack of a symmetrical rebalance on the down-leg favors continuation to the next target ( 96.478 ).
One-liner: Bearish while 4H stays under 98.12 ; sell rallies into 97.45–97.75 or sell a 4H close-and-pullback below 97.35 ; scale out 97.20 → 97.00 → 96.80 → 96.478 ; hard stop above 98.12–98.20 .
*Not financial advice. Size appropriately and stick to your stop.*
PLEASE PUA!
DXY Neutral -BearishCAPITALCOM:DXY
Quick read / bias
Near-term neutral → biased bearish.
Price has failed to produce a clean reversal from the large consolidation at the top, shows a series of lower-highs and liquidity hunts (marked ellipses / Imbalance repairs on the chart), and a visible “downside pressure” supply region above. The path of least resistance is down unless price reclaims the supply/consolidation zone above ~98.6–99.2.
------------------------------------------------
Key levels (from the chart)
Major consolidation / supply: ~99.2 – 99.8 (big-picture resistance).
Downside pressure / mid supply: ~98.5 – 98.8 (area to sell into).
Recent micro highs: 98.39, 98.19, 97.99 (loci for liquidity).
Current price (chart right): ~97.18.
Recent local low/liquidity grab: 96.834.
Weekly void / structural bottom to watch: 96.478 (labelled on chart).
Invalidation for bearish thesis: close/hold above 99.2 (reclaim of consolidation).
------------------------------------------------
How I read the structure (step-by-step)
Price spent time in a higher consolidation zone and then failed to reverse higher — that is a distribution / supply footprint rather than demand.
The chart shows several short liquidity hunts above swing highs (grey ellipses) and subsequent strong selling — classic stop-hunts into supply then continuation lower.
Imbalances / small supply boxes on the chart mark places the market tends to retest before continuing — these are high-probability sell zones on rallies.
The sequence of lower highs and a recent push down to ~96.83 (buyer defence) gives a local support but not yet a valid reversal signal. Until price chops through the weekly void (96.478) or reclaims the supply, expect range/biased-down behavior.
------------------------------------------------
Trade setups (actionable — use your 5-min/1-min workflow)
I’ll give two primary setups: a higher-probability short (sell the rally) and a contrarian long (mean-reversion). Use 5-min to identify displacement into the zone and 1-min for the exact micro reversal entry.
------------------------------------------------
Setup A — Primary: Short on rally into supply (preferred)
Why: Market structure + downside pressure + Imbalance above make rallies into supply favourable.
Area to enter (limit or wait for 1-min reversal): 98.00 – 98.20 (ideal limit ~98.10).
Stop loss: 98.45 (just above the 98.39 / structure swing and above the Imbalance top).
Targets (scale):
T1: 97.00 — first logical demand and psychological level.
T2: 96.50 — deeper swing support / mid structural level.
T3: 96.478 — weekly void bottom (big target if momentum continues).
Risk / reward (example entry 98.10 → stop 98.45):
Risk = 0.35 index points.
R:T1 ≈ 1.10 / 0.35 ≈ 3.14:1.
R:T2 ≈ 1.60 / 0.35 ≈ 4.57:1.
R:T3 ≈ 1.622 / 0.35 ≈ 4.63:1.
Trigger: 5-min displacement into the 98.0–98.2 zone, then 1-min rejection pattern (pin bar / engulf / two-bar reversal) and ideally a filled Imbalance or wick extension that fails. Enter limit at Imbalance top or use a short after 1-min confirmation.
------------------------------------------------
Setup B — Secondary: Mean-reversion long (countertrend)
Why: Buyers defended the 96.83 area previously; a clean, verified micro reversal at lower support can produce a quick retrace. This is lower probability vs the sell-the-rally plan and should be sized smaller.
Area to enter (limit/1-min confirmation): 96.75 – 96.95 (example limit 96.85).
Stop loss: 96.45 (below the 96.48 weekly void and the local wick).
Targets (scale):
T1: 97.40 (near recent chop / first structure).
T2: 97.99 (previous micro high).
T3: 98.39 (if momentum shifts to reclaim structure).
Risk / reward (example entry 96.85 → stop 96.45):
Risk = 0.40.
R:T1 ≈ 0.55 / 0.40 ≈ 1.38:1.
R:T2 ≈ 1.14 / 0.40 ≈ 2.85:1.
R:T3 ≈ 1.54 / 0.40 ≈ 3.85:1.
Trigger: Look for a 5-min exhaustion and 1-min clean micro reversal (two-bar bullish rejection) ideally with buy volume or a wick that holds. Keep size smaller than on shorts.
------------------------------------------------
Intraday scalp idea (quick)
Long scalp on a 1-min reversal after a displacement down to ~96.83 with tight stop under the wick (e.g. 5–8 ticks) and target 97.20–97.40. Use only if price shows clean microstructure and momentum.
Trade management rules
Positioning: Risk a fixed % per trade (e.g., 0.5–1% of account) and size accordingly. The short setup has high RR — size to risk tolerance.
Partial take: Take ~50% at T1, move stop to breakeven, let remainder run to T2/T3.
If price stalls at T1: tighten stop to lock profit or exit if structure shows weakness.
If price breaks and holds above 98.60 / 99.2: exit shorts and flip to neutral/bullish plan — the initial bearish thesis is invalidated.
Use your timeframe combo: identify the displacement on 5-min, execute 1-min entry confirmation.
------------------------------------------------
Invalidation / alternative scenario
Bearish invalidation: clean, sustained close above 98.6–99.2 (consolidation re-claim) — if that happens, the market likely shifts to bullish and short ideas should be abandoned.
Bullish trigger: rally above 99.2 with follow-through and a higher low -> targets back toward 99.8.
------------------------------------------------
Final prediction
Over the next sessions I expect failed rallies into 98.0–98.6 to be sold, which should gravitate price toward 97.00 → 96.50 → 96.48 if momentum confirms. Countertrend longs are possible as scalps/swing trades off 96.8–96.48, but they should be treated as lower-probability and sized smaller. If price instead reclaims and holds >99.2, the bearish bias is invalidated.

DXY Bearish Breakout! Sell!
Hello,Traders!
DXY is trading in a
Downtrend and the
Index made a bearish
Breakout of the key
Horizontal level of 97.200
So we are bearish biased
And we think that a
Further price decline is
Likely to happen
Sell!
Comment and subscribe to help us grow!
Check out other forecasts below too!
Disclosure: I am part of Trade Nation's Influencer program and receive a monthly fee for using their TradingView charts in my analysis.

DXY on 13 year support....Either we break down here, which will inevitably lead to a continuation of the rally in equities, or it's time to start hedging short. Either way it's decision time. I see more downside to the DXY personally, which fits the narrative of a blowoff top.
Famous last words.

First day of the week and Dollar dropWith the market opening, the Dollar Index continued its decline and reached a key support level. However, I think it could bounce from this area and move up toward the middle of the range. We’ll have to see how long this level can hold the price, since the Dollar Index has been bearish for quite some time. ✅
DXY: Next Move Is Up! Long!
My dear friends,
Today we will analyse DXY together☺️
The recent price action suggests a shift in mid-term momentum. A break above the current local range around 96.860 will confirm the new direction upwards with the target being the next key level of 96.957 and a reconvened placement of a stop-loss beyond the range.
❤️Sending you lots of Love and Hugs❤️

Pre-FOMC Crossfire US DOLLAR INDEXPre-FOMC Dollar War Map
The weekly chart just printed a fourth straight lower high—
a slow grind down while Friday’s close stayed red.
Liquidity is stacked behind us, perfect fuel if the desks want to run stops before the Fed.
Order flow shows massive resting bids around 96.962, the last structural block.
If that line cracks, expect the move to be fast and brutal.
Cross-markets are whispering the opposite:
equities, metals, and crypto are coiled to run if the dollar slips.
The headlines will call it a surprise.
It isn’t. The map was drawn weeks ago.
Focus on levels, not noise.
Trade the reaction, not the prediction.
DXY 4HTrading Outlooks for the Week Ahead
In this series of analyses, we review short-term trading outlooks and perspectives.
As can be seen, in each analysis there is a key support/resistance zone close to the current price of the asset. The market’s reaction to or breakout from these levels will determine the next price movement toward the specified targets.
Important Note: The purpose of these trading outlooks is to highlight critical price levels ahead and the market’s potential reactions to them. The analyses provided are by no means trading signals!

The Buck’s Getting Bucked“Rule #1: Respect Bitcoin.
Rule #2: When you think you’ve respected it enough…double it.
Big players like BlackRock manage trillions of dollars.
They usually keep their money in things like U.S. dollars and government bonds because that’s been the “safe spot” forever.
But the dollar keeps losing buying power and the U.S. keeps adding debt.
So these big funds are starting to put a small slice of their cash into Bitcoin—a digital money that nobody can print more of.
It’s not that the dollar is disappearing tomorrow.
They just want a backup that can’t be inflated away.
When companies with that much money start buying, it makes Bitcoin look less like a fad and more like the next big “store of value.”

DXY: Target Is Down! Short!
My dear friends,
Today we will analyse DXY together☺️
The recent price action suggests a shift in mid-term momentum. A break below the current local range around 97.216 will confirm the new direction downwards with the target being the next key level of 97.160 and a reconvened placement of a stop-loss beyond the range.
❤️Sending you lots of Love and Hugs❤️
WILL THE BEARS CONTINUE TO BREAK THE BULLS' BACKS ???DXY ANALYSIS (Weekly Timeframe) (Chart 2)
Looking at higher times, weekly and monthly. We see that price created a long-term bullish support. We have seen the first several touches of the support line between the 28th of April 2011 and the 29th of August 2011, a total of 10 touches. We have also seen the second touches on the trendline between the 6th of January 2021 and 7nth of May 2021, about 12 touches. We are currently witnessing the third touches on the trendline. Price has already touched once the trendline on the 30th of June 2025. We are still expecting more touches and a breakthrough into the trendline. Should bulls remain weak, we will see price retest and breakaway from the trendline.
#SabaliCapital
#TechnicalAnnalysis
#DXY

WILL THE BEARS CONTINUE TO BREAK THE BULLS' BACKS ???DXY ANALYSIS (Daily Timeframe).
On the 1st of July 2025 price began printing a sideways correction, wherein minute wave (a) terminated on the 1st of August 2025. Price is currently printing a minute wave (b) before a minute wave (c) to complete minor wave 4. Minute wave (c) may not take out the 100.257 levels due to the strength of the Bears.
Looking at higher times, weekly and monthly. We see that price created a long term bullish support. We have seen the first several touches of the support line between the 28th of April 2011 and the 29th of August 2011, a total of 10 touches. We have also seen the second touches on the trendline between the 6th of January 2021 and 7nth of May 2021, about 12 touches. We are currently witnessing the third touches on the trendline. Price has already touched once the trendline on the 30th of June 2025. We are still expecting more touches and a breakthrough into the trendline. Should bulls remain weak, we will see price retest and breakaway from the trendline.
#SabaliCapital
#TechnicalAnnalysis
#DXY

DXY Correction to the UpsideThe much-anticipated pullback to the upside has started.
Remember, even though the overall trend is still bearish as seen by the bigger picture Head and Shoulders pattern I mapped out on H4 TF, we still projected this upside move as a retest of that main pattern.
Confirmations to long as seen on the H1 TF are this inverted Head and Shoulders and a break out and retest of the falling wedge.
Apply correlation to your dollar pairs and Gold.
