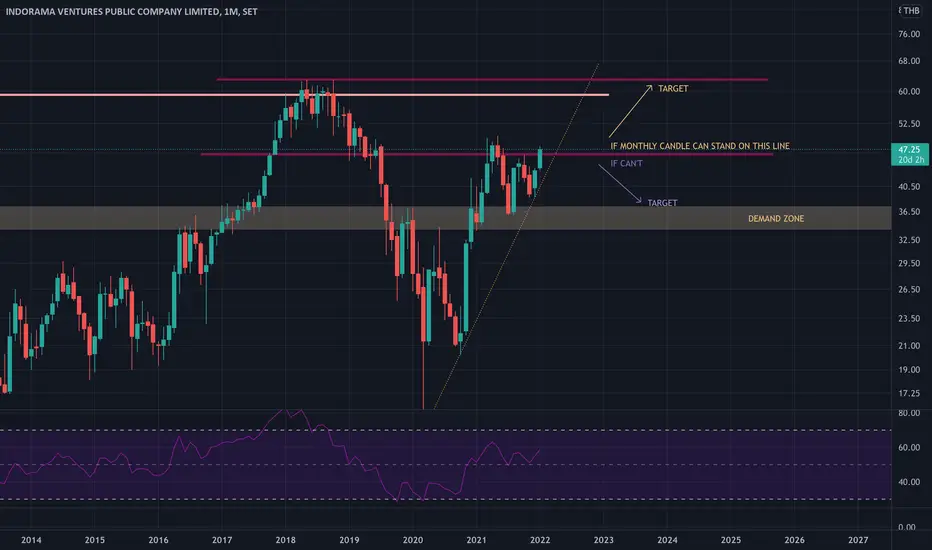
Indorama Ventures PCL ( IVL ) cooling off after big gainsMonstrous rally off of an inverted head and shoulders support. Banking a +- 70 % gain over a 3-4 month period.
Stock seems to be cooling off now, which might indicate some profit taking in order to protect those gains.
No position, with a neutral view. I'll be Watching for downside pressure and
Indorama Ventures Public Company Limited
No trades
−0.14 USD
−579.93 M USD
15.35 B USD
About Indorama Ventures Public Co. Ltd.
Sector
Industry
CEO
Aloke Lohia
Website
Headquarters
Bangkok
Founded
1994
IPO date
Sep 25, 2009
Identifiers
3
ISIN US45579X1037
Indorama Ventures Public Co. Ltd. is a holding company, which engages in the manufacture and distribution of Polyethylene Terephthalate (PET), Purified Terephthalic Acid (PTA), Paraxylene (PX), recycling, Purified Isophthalic Acid (PIA), Naphthalene Dicarboxylate (NDC), PET preforms and packaging, Integrated EG, Integrated purified EO, PO/MTBE, Integrated Surfactants comprising EOA, LAB and others, Fibers including Polyester, Rayon, Nylon, Polypropylene, composites and worsted wool fibers products. It operates through the following segments: Combined PET, Integrated Oxides and Derivatives, and Fibers. The Combined PET segment manufactures and distributes PET value chain, specialty chemicals, and PET preforms and packaging. The Integrated Oxides and Derivatives segment produces integrated EG, purified EO, PO/MBTE, and surfactants. The Fibers segment manufactures and distributes polyester, rayon, nylon, polypropylene, composites, and worsted wool fibers. The company was founded by Aloke Lohia on February 21, 2003 and is headquartered in Bangkok, Thailand.
Related stocks

TRADING BUY $IVLSYMBOL : SET:IVL
POSITION SIZING : 12%
ACCOUNT RISK : 0.5%
STOP LOSS TIGHT : 6% (24.10 THB)
ENTRY : ATO 4/4/2024
Exit strategy : Judgment
Expect to hold : 3 month
Catalyst : Indorama Ventures raises US$255 million through Ninja loan as part of refinancing program

IVL | Ascending Triangle | Bull Trap - Limited UpsideIVL | Thailand SET Index | Petro Sector | Chart Pattern Trading
> Ascending Triangle continuation pattern - Bullish Trap with limited upside
> Price Action: Wait for tighter candlestick consolidation - Entry @ Demand Support Line Zone only
> RSI - bullish trap signal
> MACD - Bearish Divergence
DP

IVL [ Reversal in soon ]
IVL possible revesal on next week
on A B C Flat Pattern
the last resistant is 23.0 is can not stand should be limit loss!!!

Elliott wave 1 Elliott wave 1 Flat graph by Nantich The traingle
Turtle and rabbit
One day a rabbit was boasting about how fast he could run. He was laughing at the turtle for being so slow. Much to the rabbit’s surprise, the turtle challenged him to a race. The rabbit thought this was a good joke and accepted the

IVLSET:IVL
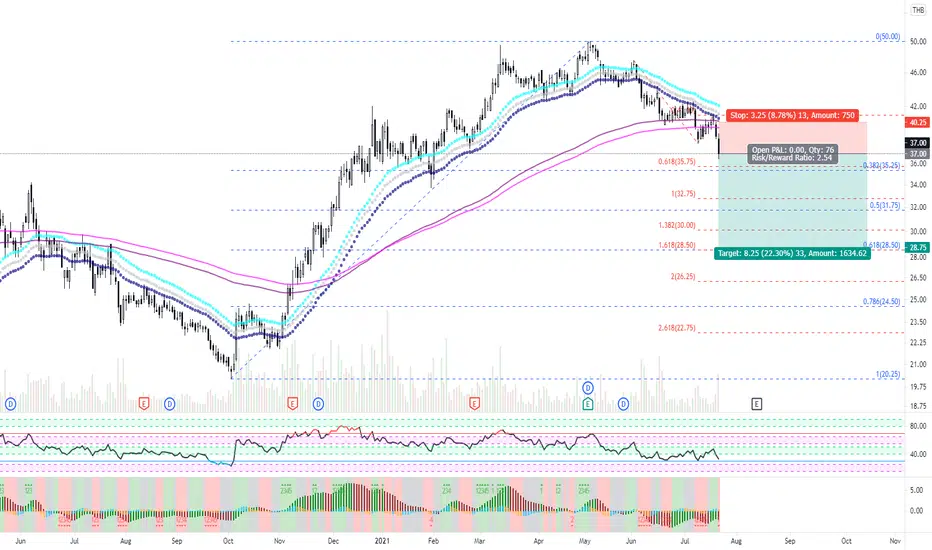
- Retrace 50% and rebound significantly
- Target - at least previous all time high
- Stop out - previous low (at 50% retracement)

IVL : (SET INDEX)Everything is on the chart
Feel free to comment / feedback
Trade safe, always place the stop loss
TY
Mil

IVL (TH) - Elliot Wave AnalysisNon-standard Correction (ABCXABC)
- As shown in the chart we are approaching the second correction of a non-standard correction.

IVL and WTZ2 in downtrendIVL and WTZ2 in downtrend. Consider risk reward ratio and position sizing before trading.
See all ideas
Summarizing what the indicators are suggesting.
Oscillators
Neutral
SellBuy
Strong sellStrong buy
Strong sellSellNeutralBuyStrong buy
Oscillators
Neutral
SellBuy
Strong sellStrong buy
Strong sellSellNeutralBuyStrong buy
Summary
Neutral
SellBuy
Strong sellStrong buy
Strong sellSellNeutralBuyStrong buy
Summary
Neutral
SellBuy
Strong sellStrong buy
Strong sellSellNeutralBuyStrong buy
Summary
Neutral
SellBuy
Strong sellStrong buy
Strong sellSellNeutralBuyStrong buy
Moving Averages
Neutral
SellBuy
Strong sellStrong buy
Strong sellSellNeutralBuyStrong buy
Moving Averages
Neutral
SellBuy
Strong sellStrong buy
Strong sellSellNeutralBuyStrong buy
Displays a symbol's price movements over previous years to identify recurring trends.