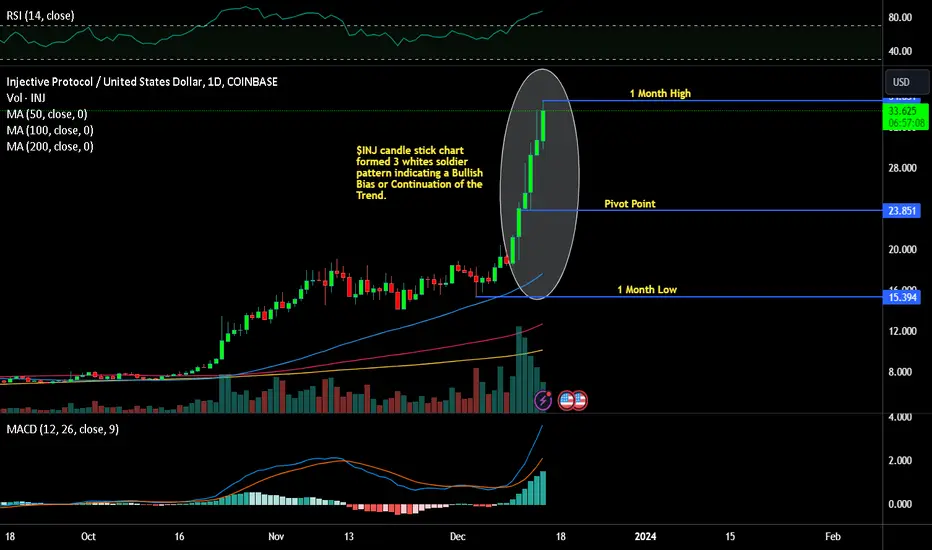
Injective (INJ) Integral 350% Increase from October to December
In 2023, INJ has seen an impressive 2000% growth, with a significant 350% increase from October to December. It recently reached a new all-time high of $33.4, and the buying momentum doesn't seem to be waning.
Maintaining the upward trajectory of Injective is key at the moment. Despite never having breached the $32.1-$33.4 resistance zone before, buyers might aim for new levels at $35 and $38, assuming BTC stabilizes above $42,000.
Any correction in INJ is likely to correlate with BTC's potential downturn. If BTC starts a downward trend, Injective could revisit its support zones at $28.5-$29.8, $26.6, and $23.6-$25.
INJUSD.P trade ideas
INJUSD Has bottomed and is targeting 33.000Injective is on very stable technicals on the 1D timeframe (RSI = 61.927, MACD = 0.959, ADX = 21.734) as it resumed the rise, keeping clear of the 1D MA50, which remains the Support since since September 29th.
The 1D RSI shows that the market is replicating the early 2023 price action on a fractal which after reclaiming the 1D MA50, it rallied to the 1.5 Fibonacci extension. We therefore turn bullish again, aiming at the 1.5 Fib (TP = 33.000).
## If you like our free content follow our profile to get more daily ideas. ##
## Comments and likes are greatly appreciated. ##

INJ possible set-upINJ has been holding up strongly. 16.4 needs to hold in order to continue the positive trend and reach 18. A break of the the 100 SMA would break the trend and bring the price down to 15.3 or 14.1.

$INJ, downside and upside targets Looking to enter this trade on a final retest of support at $6.44 and then exit up in the $18-19 range.

INJ and Total Market Cap = GO TIME. LT3Inj is ready to go man. Now is time to get in where you fit in….

INJ Injective Levels & Lines to Keep An Eye OnIt's funny, i sometimes get some flack for the simplicity (and admittedly ugliness) of my charts. But the truth is, the KISS mentality works especially well in crypto, and with sensible reason behind it. If a trend or support/resistance level is clear to you as a human, you can be sure there are tons of bots playing off it as well.
Anyways, CRYPTOCAP:INJ has had an amazing run up in the past couple months, and many people who are long or holding should REALLY be thinking about getting out, or at least tasking some profit.
Look at it's all time MARKET CAP, not price. imgur.com Also compare its current market cap to other metrics like FDV and TVL, and you'll see we need a pullback soon. But when?
Hopefully this chart can help you make that decision by following along as price plays out.
The Yellow lines are the big picture fib retrace. Will post a zoomed out view in the comments below

INJUSD: Giant Cup and Handle targeting 16.50 before correctionInjective crossed over the 6 month Resistance turned overbought on the 1D timeframe but is still balanced on the 1W (RSI = 68.170, MACD = 0.883, ADX = 23.993), which is where we should be looking at as this is a bullish breakout on the higher timeframes. Technically this can keep rising until the 1W RSI hits well within the 80.000 level. We use this breakout buy signal to target the R1 level (TP = 16.500). This is potentially a giant Cup and Handle pattern that can even go as high as the R2 level (25.500) before pilling back. After that, it will turn into a buy opportunity again when it hits the 1W MA50.
## If you like our free content follow our profile to get more daily ideas. ##
## Comments and likes are greatly appreciated. ##

INJ - Stubborn Wave 4
My primary count in the daily timeframe still holds, but blue wave 4 is insisting in taking forever to wrap up (5 months already).
We already have the conditions to consider that a regular flat is finished, and the last leg down gave us RSI divergence.
Target for Wave 5 is $10


INJUSD Short-term buy opportunityInjective (INJUSD) is on the 2nd straight green 1D candle, following a rebound for the 1D RSI exactly on the 30.00 oversold barrier. With the 1D MACD close to forming a Bullish Cross, this is a short-term buy opportunity. The previous such rebound below the 1D MA50 (blue trend-line) was on the May 12 bottom and it made a rise just below the 0.618 Fibonacci retracement level. As a result, we take this opportunity to long and target 8.7000.
-------------------------------------------------------------------------------
** Please LIKE 👍, FOLLOW ✅, SHARE 🙌 and COMMENT ✍ if you enjoy this idea! Also share your ideas and charts in the comments section below! **
-------------------------------------------------------------------------------
💸💸💸💸💸💸
👇 👇 👇 👇 👇 👇

INJ potential hidden bullish divergenceDaily hidden bullish divergences are no joke. I see this potentially playing out in the next week. I think we drop to 7$ zone and stay there for couple days before going up rather quickly.

Keeping an eye on #INJ/USDT resistance zone in 4-Hour TF!Keeping an eye on #INJ/USDT resistance zone in 4-Hour TF!
We can open Short on retest again. Expecting $6-$7 in coming days.

INJ - Aiming $10
Blue wave 5 is well on its way, as shown in my previous post. First target is $10.
In the 4H timerame, I´m considering we´re currently in green wave IV correction. The correction could be over, but I usually like to see at least a 38.2% pullback to have a bigger confidence in continuation trades.

[UPDATE INJ] Nothing to say...below 5$ is game over. I will start buying it at1.5$ in Q4 2023.
Now are are at mid range..
Will increase my short position if we see any short squeeze around 7 - 7.5$ (if).
Bye.

INJ - Bullish Wave CountI´m currently using a bullish primary count for INJ. Unless invalidated, we should have another push to the upside, with targets above $10.00.
Break of the purple line invalidates this count.
Price action is still not favorable to consider the upside has begun, so I´m not taking any trades yet.

✴️ Injective | Stronger Than Most AltcoinsI know it is pretty obvious but Injective (INJUSD) is doing much better than most of the Altcoins.
First, many pairs completed their initial bullish wave right back in January, some continued to move through February but that is about it for the majority of Altcoins. Looking at INJUSD, we can see that it grew all the way through April.
Another variation in the pattern is the correction. After hitting a low in May is has been consolidating up. The chart looks pretty good and overall supports additional growth, with a long-term strength bias.
The 12-May low can be a good support level if one is looking to trade. The rest is up.
Namaste.

INJUSD Channel Up continuation, buy opportunity.INJUSD maintains the Channel Up pattern that started on the January 1st bottom.
The MA100 (1d) has been its clear Support since January 21st.
Trading Plan:
1. Buy on the current market price.
2. Sell if it breaks under the MA50 (1d).
Targets:
1. 14.95000 (Resistance 2).
2. 5.0000 (expected contact with the MA200 1d).
Tips:
1. The RSI (1d) is trading inside a Triangle. If it hits its top before the price reaches 14.9500, then close the buy regardless. Use the Triangle's tops and bottoms to your advantage for sell / buy entries.
Please like, follow and comment!!

INJ Cup & Handle ☕️Looks pretty textbook, something to keep an eye on over the next few days. A lot resting on ETH & BTC next steps.

why not?The form of the ascent that occurred is the ascent of three waves and ended the ascent with the Sea Leading Daegonol wave
Note 1:There is a previous analysis of mine regarding the currency, but it is one of the few analyzes that did not succeed because I rushed to identify the wave and it did not finish its temporary rise
Note 2: The analysis fails to close up 10 usdt

INJUSD Buy break-out confirmation if it closes above the 1D MA50Injective (INJUSD) is trading within a Channel Up pattern since the start of the year. For the past 8 days it has settled at the bottom of the pattern, below the 1D MA50 (blue trend-line). If it closes a 1D candle above it, we will have the bullish break-out confirmation for a long-term buy towards the top of the Channel. The Lower Highs and Higher Lows trend-lines of the 1D RSI can offer additional insight. Our long-term target is 23.000 (+310% from the Low, similar to the April 17 High).
-------------------------------------------------------------------------------
** Please LIKE 👍, FOLLOW ✅, SHARE 🙌 and COMMENT ✍ if you enjoy this idea! Also share your ideas and charts in the comments section below! **
-------------------------------------------------------------------------------
💸💸💸💸💸💸
👇 👇 👇 👇 👇 👇

Momentum Cryptocurrency: Injective ProtocolINJUSD represents the cryptocurrency pair of the Injective Protocol token (INJ) and the US Dollar (USD). Injective Protocol is a decentralized exchange (DEX) that runs on the Ethereum network. It has been designed to facilitate peer-to-peer (P2P) trading using a high-speed, low-cost infrastructure. The platform is fully decentralized, meaning it allows traders to operate in a permissionless and censorship-resistant manner, a key advantage over traditional, centralized exchanges.
Potential Appeal to Investors
Investors may find INJUSD appealing due to the unique characteristics of the Injective Protocol. With its focus on decentralization, speed, and low costs, Injective Protocol is uniquely positioned in the growing field of DeFi. By leveraging the advantages of blockchain technology, Injective Protocol offers a level of accessibility and transparency that is typically lacking in traditional financial systems.
Price Performance
The INJUSD pair has seen substantial growth in recent times. Its 6-month growth rate is a staggering 289.96%, with an even more impressive year-to-date change of 423.74%. The 1-year stands at 325.71% illustrating a strong long-term growth trend. Despite the past month's decrease of -22.98%, the overall bullish trend could potentially signify a promising investment.
It has had a pull back to below a previous support area and if it breaks back up above this it could be a positive sign.
Market Capitalization and Trading Volume
Injective Protocol (INJ) has a notable market capitalization of 531.317 million USD, with a fully diluted market cap of 664.1 million USD. The substantial trading volume over the past 24 hours, around 58.016 million USD, suggests robust market activity and liquidity for the INJUSD pair.
Technical Indicators
The Relative Strength Index (RSI) at 47.815 suggests the asset is currently neither overbought nor oversold. Meanwhile, the MACD Level of -0.218 signals that bearish sentiment may currently dominate.
However, the overall picture from the moving averages is more positive. The Exponential Moving Averages (EMA) and Simple Moving Averages (SMA) for 10, 20, 30, 50, 100, and 200 days all show that the current price is above these averages. This is typically seen as a bullish sign.
Outlook
In conclusion, INJUSD presents an interesting opportunity for investors due to the unique aspects of Injective Protocol. Its strong performance over time and healthy market indicators make it a potentially promising investment. However, as with all investments, potential investors should consider their risk tolerance and investment objectives before making a decision and consider seeking advice from financial professionals.
In terms of any kind of short term entry it has had quite a large pullback into a reasonably good value area. I would want to wait for the MACD to cross back up above its signal line for confirmation. For risk management, again being crypto it's something your really need to eyeball. A stop loss of around 20% would have kept you in most of this trade. If it broke below that it could have been a good sign to exit and look for a new entry when the trend resumed.
As always how you interpret and decide to act on any results is up to you. This is just data not financial or trading advice and past performance is in no way any guarantee of future performance. Think of it as a way to spot coins you might be interested in and can add to your watch list and perform further research on and or discuss with your broker.
Again. Not trading advice . Cryptocurrencies can pump and dump. Trends can end. Do your own research / discuss it with your advisor, but might be one to watch.

$INJ to $10 bounce off daily pennantCRYPTOCAP:INJ to $10 bounce off daily pennant. Floor to Ceiling VWAP bands bounce coming up!

INJINJ had a good run. In my opp. never finishes 5th. But stuff happens right kids? The mini bull run is done. As they say Pull it in may and go elsewhere till fall/ !! LOL Yeah!!!!
I;m putting in my own MA Lines to see how close I come. TY and GN SIR !!!
