Using MACD to Identify Overbought and Oversold ConditionsMoving Average Convergence Divergence (MACD) is a popular technical analysis indicator that can be used to identify overbought and oversold conditions in a security's price action. By monitoring the MACD line and the signal line, traders can gain insight into the strength and momentum of a trend, and identify potential trading opportunities.
When the MACD line is above the signal line, it may indicate that the security is overbought and a potential trend reversal may occur. Conversely, when the MACD line is below the signal line, it may indicate that the security is oversold and a potential uptrend may occur.
Traders can use the MACD to set entry and exit points for their trades based on overbought and oversold conditions. For example, if the MACD confirms that the security is overbought, a trader may consider entering a short position, while if the MACD confirms that the security is oversold, a trader may consider entering a long position.
Traders should also consider the timeframe of their trades when using the MACD to identify overbought and oversold conditions. For example, a long-term trader may use a longer period MACD to identify overbought and oversold conditions on a weekly or monthly chart, while a short-term trader may use a shorter period MACD to identify overbought and oversold conditions on an intraday chart.
It's important to note that while the MACD can be a useful tool for identifying overbought and oversold conditions, it is not always accurate. Traders should always use risk management techniques such as stop-loss orders to minimize their losses.
Traders can also use other technical analysis indicators in conjunction with the MACD to identify overbought and oversold conditions, such as trendlines and support and resistance levels. For example, if the MACD confirms that the security is overbought and the price chart is approaching a strong resistance level, it may indicate a potential trend reversal and a strong sell signal.
In addition to identifying potential trading opportunities, traders can also use the MACD to confirm the strength of the trend by monitoring the MACD's rising or falling trendline. If the MACD is making higher highs and higher lows, it may confirm a potential uptrend, while if the MACD is making lower highs and lower lows, it may confirm a potential downtrend.
Traders should also be aware of potential false signals when using the MACD to identify overbought and oversold conditions. For example, if the MACD confirms that the security is oversold, but the price chart continues to make lower lows, it may indicate a potential bearish trend continuation rather than a trend reversal.
In summary, the MACD can be a useful tool for identifying overbought and oversold conditions in a security's price action. Traders can use the MACD line and signal line to set entry and exit points for their trades, and use other technical analysis indicators to confirm potential trend reversals and continuations. However, traders should always use risk management techniques to minimize their losses, as the MACD is not always accurate.
INJUSD.P trade ideas

MACD Divergences: Confirming Trend Reversals and ContinuationsDivergences are a popular technical analysis tool used to confirm potential trend reversals and continuations in a security's price action. Moving Average Convergence Divergence (MACD) is a commonly used indicator to identify these divergences.
Bullish divergences occur when the price chart is making lower lows, but the MACD is making higher lows. This may indicate that the security is oversold and a potential uptrend may occur. Traders may look to enter long positions when the MACD confirms the bullish divergence by crossing above its centerline.
Conversely, bearish divergences occur when the price chart is making higher highs, but the MACD is making lower highs. This may indicate that the security is overbought and a potential downtrend may occur. Traders may look to enter short positions when the MACD confirms the bearish divergence by crossing below its centerline.
Traders can use divergences to confirm existing trades or to set entry and exit points for new trades. For example, if a trader enters a long position based on a bullish crossover, they may use the MACD to confirm the strength of the trend by monitoring for bullish divergences. If a bullish divergence occurs, the trader may add to their position or increase their profit target.
Traders should also consider the timeframe of their trades when using divergences. For example, a long-term trader may use a longer period MACD to identify divergences on a weekly or monthly chart, while a short-term trader may use a shorter period MACD to identify divergences on an intraday chart.
It's important to note that while divergences can be a useful tool for confirming trend reversals and continuations, they are not always accurate. Traders should always use risk management techniques such as stop-loss orders to minimize their losses.
Traders can also use other technical analysis indicators in conjunction with divergences, such as trendlines and support and resistance levels. For example, if a bullish divergence occurs near a strong support level, it may indicate a potential uptrend and a strong buy signal.
In addition to identifying potential trading opportunities, traders can also use the MACD to confirm the strength of the trend by monitoring the MACD's rising or falling trendline. If the MACD is making higher highs and higher lows, it may confirm a potential uptrend, while if the MACD is making lower highs and lower lows, it may confirm a potential downtrend.
In summary, divergences are a useful tool for confirming potential trend reversals and continuations in a security's price action. Traders can use bullish and bearish divergences, support and resistance levels, and other technical analysis indicators to set entry and exit points for their trades. However, traders should always use risk management techniques to minimize their losses, as divergences are not always accurate.

INJUSD BULLISH!!!If you're out here trying to short this I seriously have to question your mental health. Don't let your bias infect your thinking.

#INJUSD - Potential for Massive Short. 25% - 40%#INJ has been performing outstandingly well for our Crypto Tipster v2 Signal Generator recently, providing us with massive profit over and over again!
We've now got a Sell signal come through with the price rejected by an upper trend line and some large gaps to fall through on the underside.
Looks like a drop of 25% is likely, 40% is possible.
👀👀
What Do You Think?
If you enjoyed or agree with this idea - drop us a comment, like & follow! 😀
Ideas by theCrypster meet the guidance notes and disclaimer as mentioned below and within our website. See Signature for more info! ✌️
🔥🔥🔥
Crypto Tipster v2
theCrypster
🔥🔥🔥

INJUSD 3.05 is the target but wait for break or pullbackINJUSD the symbol of the Injective coin is rising parabolically and this is not the first time we see it on such a strong rise inside the accumulation pattern since May. Basically the Resistance levels are harmonic and we can see the pair getting rejected because of the 2.5050 harmonic Resistance. This RSI though is different that the parabola of August so this time be ready to buy the break of 2.5050 or better yet a 1day MA50/200 pullback if the parabola breaks downwards.
Follow us, like the idea and leave a comment below!!

Ascending Triangle - INJ $INJ #INJUSD Rally up to 3.80 in coming weeks seems likely. Ascending triangle + Adam/Eve bottom pattern forming.

INJ/USD pumping again??INJ/USD is maintaining the support we highlighted in our last trade.
Now we're watching for a bounce- breaking the falling wedge and destroying the H1 resistance.
We're in. Are you?

INJ/USD to the moon?The INJ/USD chart looks to be breaking up.
After more than 50 days of consolidation it appears that INJ wants to go higher.
Our plan is simple, we'll buy this break out. If the price goes back under the last low or hangs around too long under support , we'll cut the long.
We'll update here when TP or SL is hit.

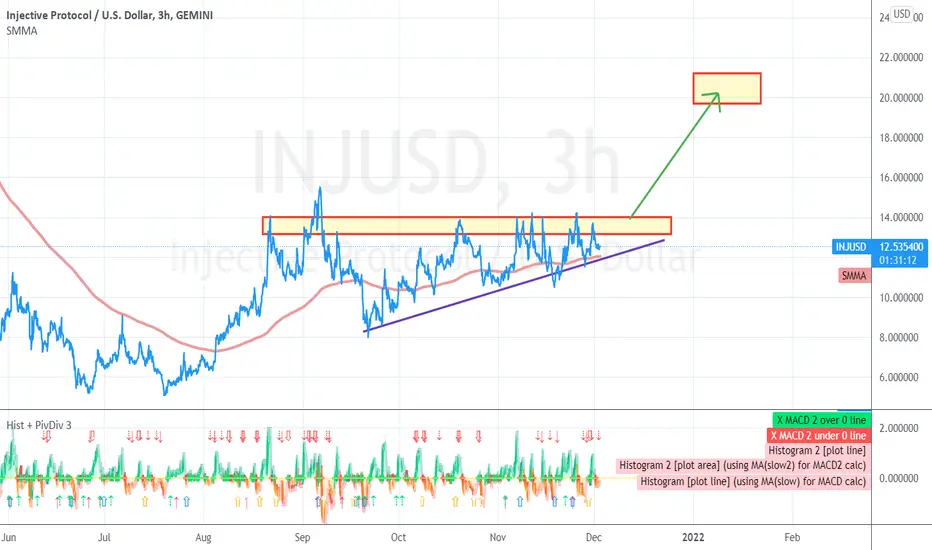
Wake Up Time is NearingRange bound for over 100 days! Most bullish traders would have exited their trades by now as this asset was going nowhere. I think the next big move is pretty close now and one can still add this to their portfolio. Allow it to break above $14 for confirmation. $20 will be the 1st profit target. Good luck.
INJSuper duper indepth technical analysis
I don't know what else to write tradingview I hope this meets your character minimum

$INJ injective protocol a Mark Cuban? special I say we pass $15Look at the chart !! We have volume confirming a break out on a small pendant... staying in a long channel, BULLISH :) Leave some love down below ! BINANCE:INJUSDT


INJ targetsHere are INJ targets
Good coin
Based on Cosmos Ecosystem (ATOM)
Invested by the following portfolios:
Binance Launchpad
Binance Labs Portfolio
CMS Holdings Portfolio
Pantera Capital Portfolio

INJUSDI'll try and keep it up to date but it would be worth counting the cycles and get a feel how rsi, tsi & %R looks at various points during each daily and weekly cycle.

INJ LONG to $14.6Outbreak of falling wedge pattern for INJUSD, long with $14.6 as target. Also MACD signals long


INJ - 5/9 - Breaking out - another 30% incomingINJ looks to be breaking out with some good volume coming in. Looking to hit at least $24 - probably more if it can close above its previous ATH.
*I am not a financial advisor*


Im here for my weekly INJECTIVEnot really a value area, but here's another showing a complex inverse head and shoudlers after maybe a harmonic in the middle of a monster run. class c macd div. on the 4hr. if nothing else easy to manage risk and get an equitable trade targeting the high w a stop near or below the head. i'll add more here i guess


INJ Mooning?Im a beginner when it comes to analysis, but with recent news and the trend that has been going for INJ, could we see a potential 2x here?

INJ: THE Blue Chip to Own137% against BTC in 30 days,
68.2% against ETH.
Market cap is still a TINY $156 million as of writing, and will eat up all the layer 1 DEX $.
And this space is going to explode, with trust dwindling into negatives in traditional stocks, projects like these offer a solution to retail investors and more.
Investing wise if you don’t own INJ you are doing a disservice to yourself, this coin is clearly marking itself as a golden opportunity, and it’s technicals, team, and partnerships show why.
Not financial advice, just my opinion.
