$INJ: presenting an opportunity to accumulate at a discount.After forming a triple top, CRYPTOCAP:INJ is now developing an “M” pattern.
This formation is generally bearish, suggesting that price may retrace into the green buy zone. Since this is unfolding on the daily timeframe, it could take several weeks before we see a potential bottom. Patience is key—

INJ/USDT: Approaching BO TP1: 24 → TP2: 35 → TP3: 43 → TP4: 53INJ/USDT is trading at 14.42 and approaching a key breakout level at 17.00. Price has been consolidating at the lower range, building energy for the next leg. A clean weekly break and close above 17 will confirm a major structure shift and ignite strong bullish momentum toward recent highs.
Above

TradersCity Pro | INJ Consolidates Below Descending Trendline👋 Welcome to TradersCity Pro!
In this analysis, I want to review the INJ coin for you. One of the RWA coins, with a market cap of $1.3 billion, ranked 68th on CoinMarketCap.
⌛️ 4-hour timeframe
This coin is on a very important Maker Buyer zone and has reacted to it several times.
✔️ On the other h

INJ NEXT TARGET⚫️ #INJ is another easy x2 in the market😉
Ascending Triangle reverse pattern at the bottom💁♂️
Breakout will take us to $31.2 like it's nothing✈️

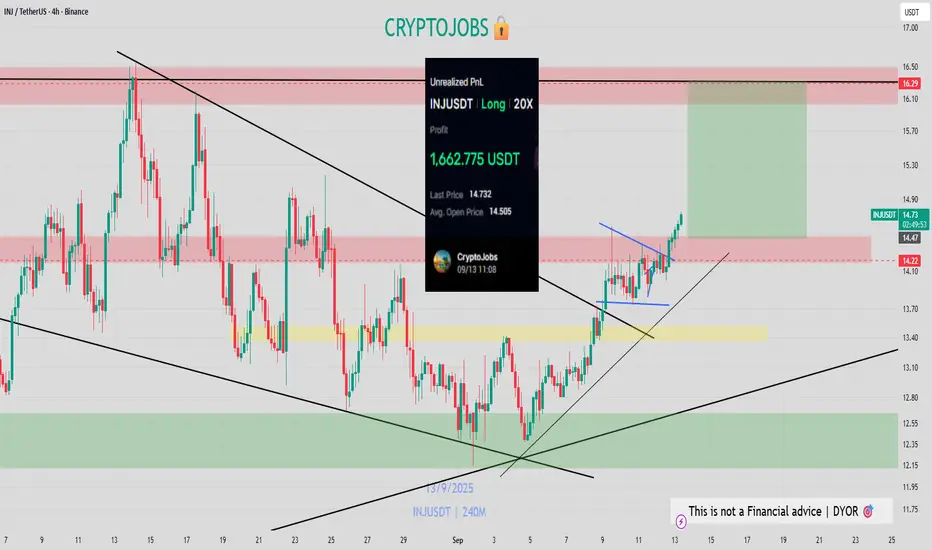
INJ - Printing Holding CRYPTOCAP:INJ , still in big profits, but following the plan!
16.00 - 16.30$ upper key level! 📈
INJ 4H Analysis - Key Triggers Ahead💀 Hey , how's it going ? Come over here — Satoshi got something for you !
⏰ We’re analyzing MKR on the 1-Day timeframe timeframe .
👀 4H timeframe on Injective (INJ) – After breaking its downtrend line, INJ moved toward the $13.41 resistance, broke through it successfully, and is now sitting just b

INJ/USDT – DISCOUNT ARRAY SetupINJ/USDT – DISCOUNT ARRAY Setup
The zone marked on chart may act as a DISCOUNT ARRAY and has the potential to move price higher after a SWEEP and a BREAKAWAY candle.
🚩 Invalidation: If the Daily FVG breaks with a clear breakaway candle, this setup is void.


njective (INJ/USD) Breaks Resistance, Eyes $14 TargetInjective (INJ/USD) has broken above a key resistance level, strengthening the bullish outlook. The pair has also formed a bullish wedge pattern and rebounded from major weekly support, adding further confirmation to the upward bias.
With momentum building, INJ/USD is likely to extend gains toward

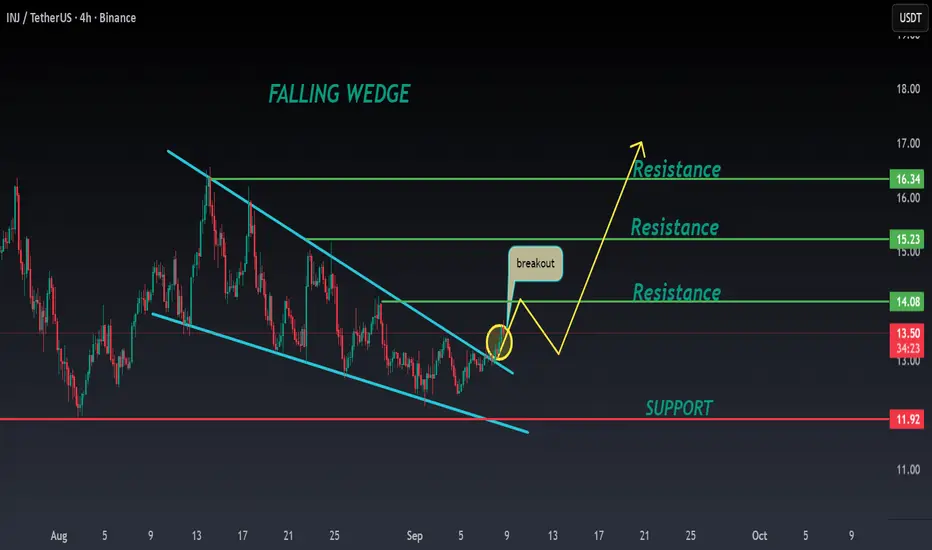
INJ ANALYSIS🔮 #INJ Analysis - Update 🚀🚀
💲 We can see that there is a formation of Falling Wedge Wedge Pattern in #INJ and we can see a bullish movement after a good breakout. Before that we would see a little retest and and then a bullish movement.
💸Current Price -- $13.49
📈Target Price -- $16.34
⁉️ What t
See all ideas
Summarizing what the indicators are suggesting.
Oscillators
Neutral
SellBuy
Strong sellStrong buy
Strong sellSellNeutralBuyStrong buy
Oscillators
Neutral
SellBuy
Strong sellStrong buy
Strong sellSellNeutralBuyStrong buy
Summary
Neutral
SellBuy
Strong sellStrong buy
Strong sellSellNeutralBuyStrong buy
Summary
Neutral
SellBuy
Strong sellStrong buy
Strong sellSellNeutralBuyStrong buy
Summary
Neutral
SellBuy
Strong sellStrong buy
Strong sellSellNeutralBuyStrong buy
Moving Averages
Neutral
SellBuy
Strong sellStrong buy
Strong sellSellNeutralBuyStrong buy
Moving Averages
Neutral
SellBuy
Strong sellStrong buy
Strong sellSellNeutralBuyStrong buy
Displays a symbol's price movements over previous years to identify recurring trends.