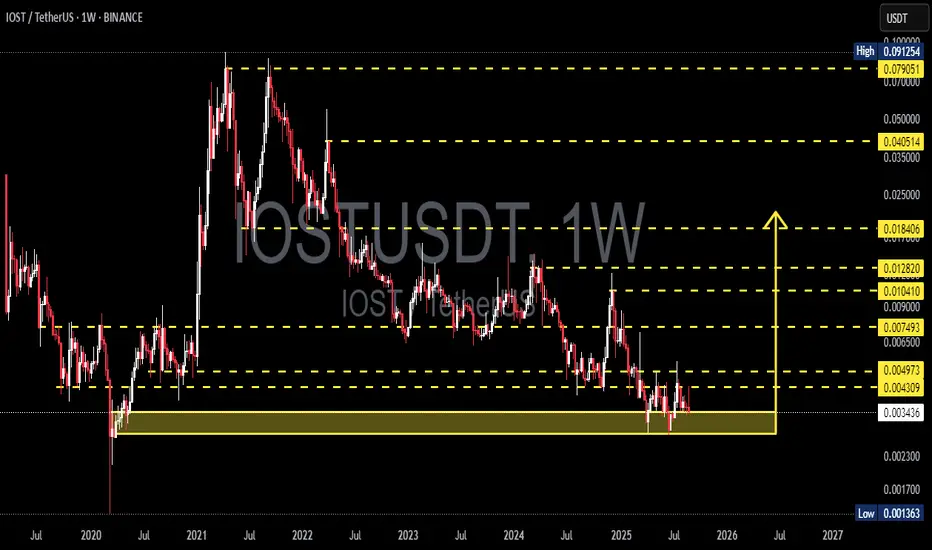
IOSTUSDT — At a Major Crossroad: Accumulation or Breakdown?🔎 Overview
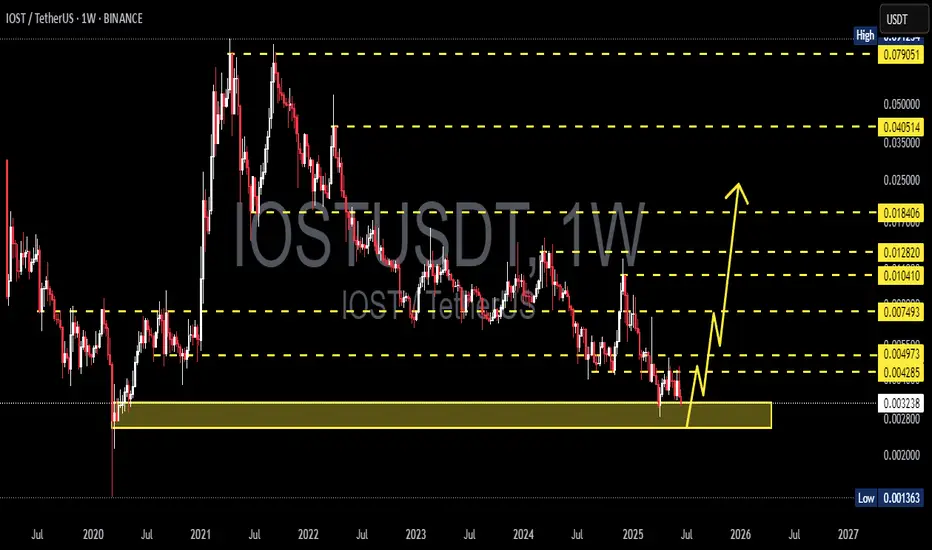
IOST is currently trading inside a multi-year demand zone (0.0024–0.0037) which has repeatedly acted as a strong support since 2019. Each touch of this area has been met with buying interest, leaving long rejection wicks and suggesting hidden accumulation.
However, the broader market st
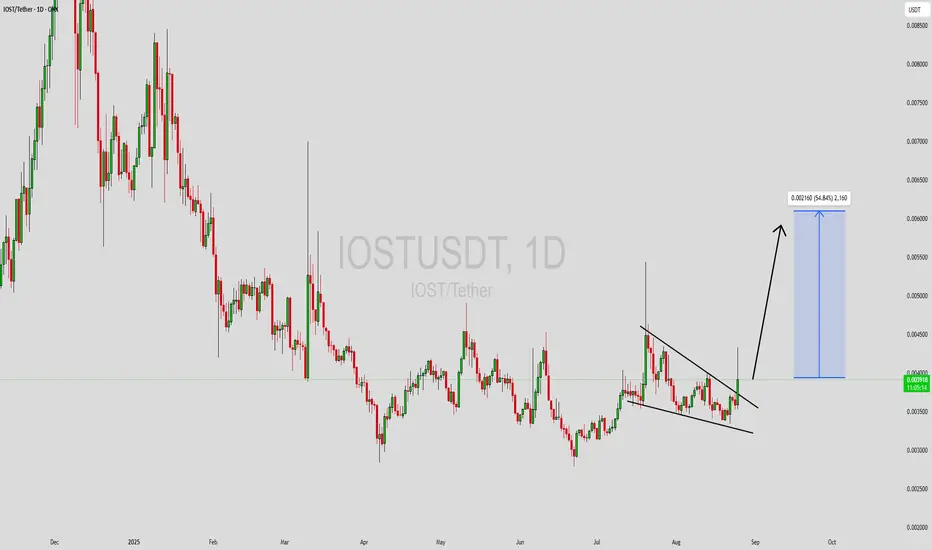
IOSTUSDT Forming Descending TriangleIOSTUSDT is currently trading within a descending triangle pattern, a setup that often signals a potential breakout move when accompanied by strong trading volume. The price action has been consolidating near a crucial support zone, while sellers are gradually losing momentum, creating an opportunit
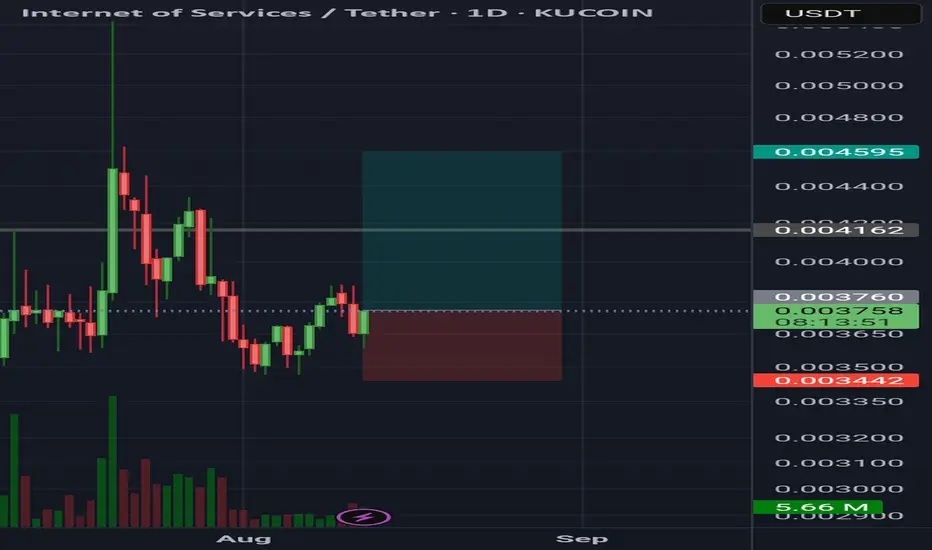
Internet of services (IoST)Iost usdt daily analysis
Time frame daily
Risk rewards ratio >2.6 👈👌
Target = 0.0046$
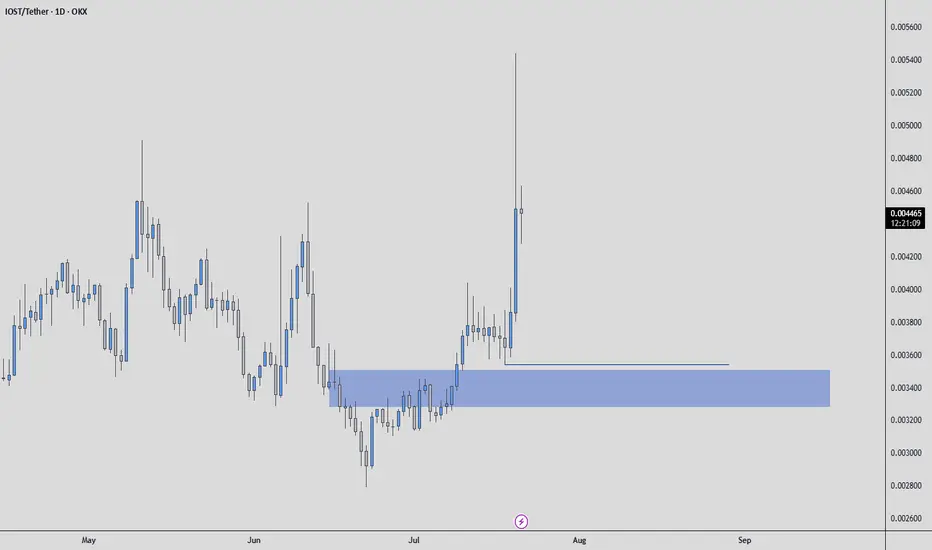
IOSTUSDT - Mid Term AnalysisThe coin is good, but everything is bad unless you buy it at the right price.
I like IOST, but I won’t touch it unless it comes to a price that makes sense for me. If it drops to my levels, I will look for:
✅ Footprint absorption
✅ CDV support
✅ Structure reclaim for confirmation
If these align,
IOSTUSDT 1D#IOST has broken above the falling wedge pattern on the chart, and the price is moving above the daily SMA100 and the Ichimoku Cloud — a strong bullish sign. Consider buying some #IOST here and near the support level at $0.003633.
Our targets for this setup are:
🎯 $0.004573
🎯 $0.004992
🎯 $0.005590

IOSTUSDT 1W AnalysisIOST ~ 1W Analysis
#IOST Buy back gradually from here with a short term target of at least 20%+ from this support.
IOSTUSDT.P SHORTAs we can see iost is forming a kind of head and shoulder pattern we enter short once we see the bearish momentum at right shoulder box or near the area it might spike with longer wick so wait for the confirmation before entering the trade
DYOR

IOSTUSDTIOST
Float
its just an idea please don't take it serious.
if u cant have an entry , go with flow

IOST: New All-Time High May 2026? Interesting... Must Read!The lowest price ever for IOST happened March 2020. The second lowest happened April 2025. We shouldn't expect for IOSTUSDT to go as low as March 2020, we can easily say/predict/assume that the bottom is already in.
Let me show you something really interesting.
IOST entered a bull market after the

IOSTUSDT 1WIOST ~ 1W Analysis
#IOST Buy gradually from here with a short -term target of at least 20%+. This is a very good support for now.

See all ideas
Summarizing what the indicators are suggesting.
Oscillators
Neutral
SellBuy
Strong sellStrong buy
Strong sellSellNeutralBuyStrong buy
Oscillators
Neutral
SellBuy
Strong sellStrong buy
Strong sellSellNeutralBuyStrong buy
Summary
Neutral
SellBuy
Strong sellStrong buy
Strong sellSellNeutralBuyStrong buy
Summary
Neutral
SellBuy
Strong sellStrong buy
Strong sellSellNeutralBuyStrong buy
Summary
Neutral
SellBuy
Strong sellStrong buy
Strong sellSellNeutralBuyStrong buy
Moving Averages
Neutral
SellBuy
Strong sellStrong buy
Strong sellSellNeutralBuyStrong buy
Moving Averages
Neutral
SellBuy
Strong sellStrong buy
Strong sellSellNeutralBuyStrong buy
Displays a symbol's price movements over previous years to identify recurring trends.