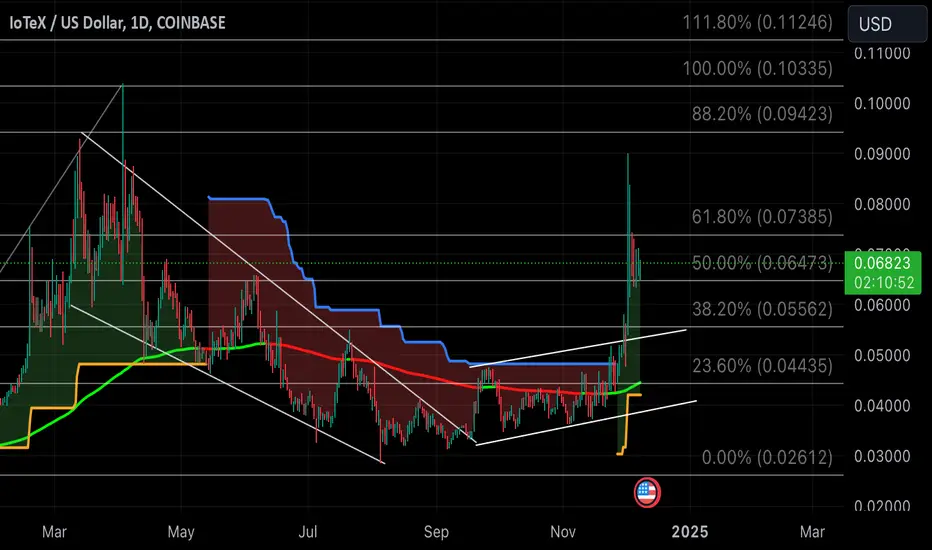
IOTX-Update: Great Buy zone = Don't ghost this opportunity Bounced off a low not seen since October 2024...a great opportunity!
Just look at the 3 Take Profit Zones plotted.
Easy money. Hold until profitable...my estimate within the next 30 days.
Key stats
Trading activity
Transactions 103
BuysSells
5152
Volume 25.67 KUSD
Buys volumeSells volume
13.97 K11.7 K
Traders 7
BuyersSellers
25
About IOTXSOL_CU8HVA.USD
Related DEX pairs

IOTX Consolidation Between Support and Resistance
To analyze the shared chart, I need to evaluate the drawings and key levels you have highlighted in the image. The horizontal area you marked appears to be a support or demand zone.
Support Zone (Shaded Area): It can be observed that the price has tested this level several times and reacted from i

$IOTX Update-Still Bullish to 2nd retest of $0.10Doing great and now macro bullish supertrend confirmation. We should see another strong retest of $0.10 soon. Still time to get in if you haven't already.
IoTeXOne of the great projects in the crypto market which show promising future. The technical analysis is straightforward; well, almost. After the previous impulse wave ended, price entered a corrective wave and now it seems finished around 0.5 Fibonacci retracement. Also, there is a consolidation zone

IOTEX and JASMY_chartsLooks like there is a strong similarity between IOTX and JASMY. Both were listed to coinbase around the same time,.

$IOTX-Update over 18% from last postUp 18% from last post...still hasn't blasted off, strap in it's happening soon!

IOTX looking primed up for a bullish runComing out of its descending channel after bouncing off near 0.0% Fib Retracement. Average resistance at nearly/exactly each Fib Level moving back up to at least 100% correction...nothing too scary. As you can see from this 12 month cycle, it's in a Discount Zone to accumulate.
Low Risk Entry: As

IOTXUSD 1W looking like H&S in play....bearish momentumAs above.
Looks like H&S formation on 1W and 1D charts. MACD on 1W is below the signal line and looking close to crossing baseline, which is bearish type momentum.
Overall, short term outlook looks bearish and may have potential for price action to tend towards previous bottom below 0.02 to 0.013

(IOTX) iotex In only a matter of five to six minutes this huge 15% candle was depleted on IOTX. How is that possible? How would other parties know as soon as it happened to sell on that candle? Was it internally? Was it an outside force? I'm baffled by how fast this candle was reduced. Why not add to the value r

See all ideas
Summarizing what the indicators are suggesting.
Oscillators
Neutral
SellBuy
Strong sellStrong buy
Strong sellSellNeutralBuyStrong buy
Oscillators
Neutral
SellBuy
Strong sellStrong buy
Strong sellSellNeutralBuyStrong buy
Summary
Neutral
SellBuy
Strong sellStrong buy
Strong sellSellNeutralBuyStrong buy
Summary
Neutral
SellBuy
Strong sellStrong buy
Strong sellSellNeutralBuyStrong buy
Summary
Neutral
SellBuy
Strong sellStrong buy
Strong sellSellNeutralBuyStrong buy
Moving Averages
Neutral
SellBuy
Strong sellStrong buy
Strong sellSellNeutralBuyStrong buy
Moving Averages
Neutral
SellBuy
Strong sellStrong buy
Strong sellSellNeutralBuyStrong buy