IOUSDT Forming Falling WedgeIOUSDT is forming a classic falling wedge pattern, a bullish reversal signal that often precedes a strong upward breakout. After an extended period of consolidation within narrowing trendlines, the pair is now showing signs of strength with improving momentum. Historically, falling wedge breakouts l

$IO Breakout falling wedge pattern The falling wedge is a bullish chart pattern in technical analysis that signals a potential price reversal to the upside.
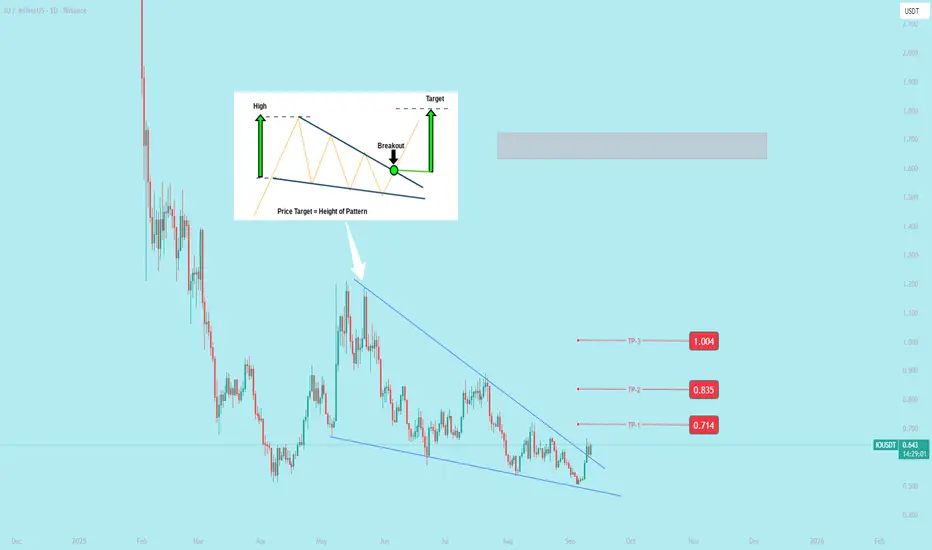
iousdt done liquidity sweep and falling wedge patternthis counter looks good.
done liquidity sweep for 150 days
and potential falling wedge pattern.
watch closely for breakout or breakdown.
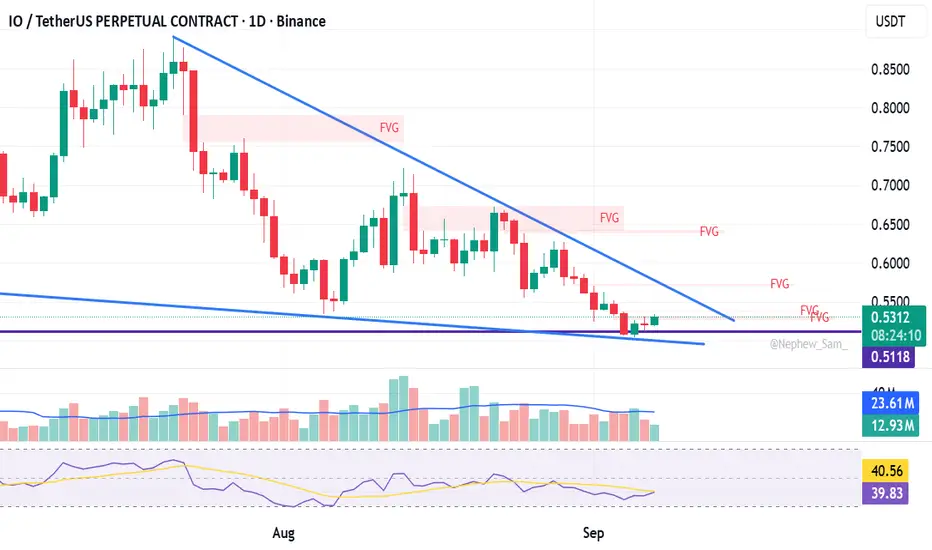
IOUSDT — Descending Triangle at Key Demand Zone!✨ Overview
The IOUSDT chart on the daily timeframe is showing a critical consolidation phase after a prolonged downtrend. Price is currently sitting inside the major demand zone 0.53–0.65, forming a descending triangle pattern — a classic setup that often leads to a decisive breakout move.
The fall
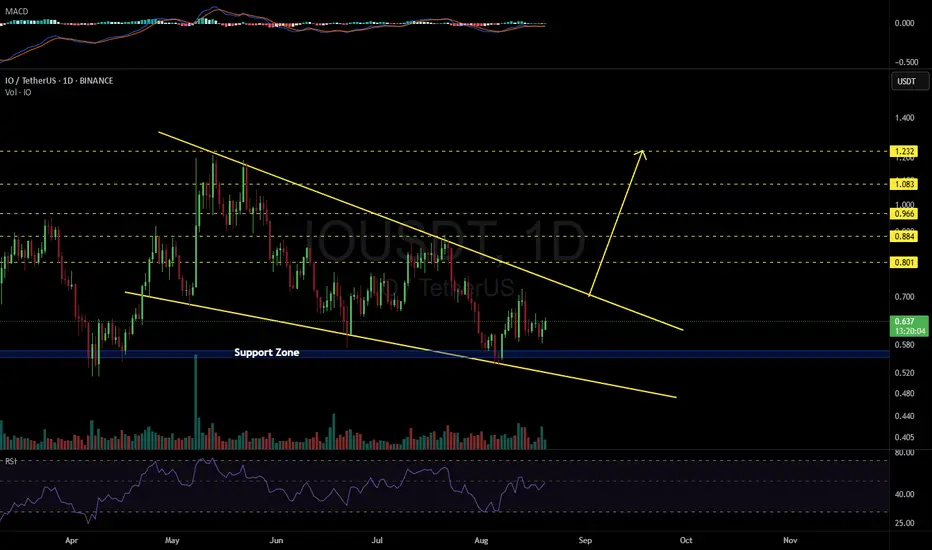
IOUSDT 1D#IO is moving inside a falling wedge pattern on the daily chart. Consider buying some #IO at the current price and near the support zone. In case of a breakout above the wedge resistance, the potential targets are:
🎯 $0.801
🎯 $0.884
🎯 $0.966
🎯 $1.083
🎯 $1.232
⚠️ As always, use a tight stop-loss an
IOUSDT Trade opportunityIOUSDT is trading within a robust descending channel, currently forming a potential bearish continuation pattern.
If the price breaks below the $1.482 level, it could lead to a new low. However, if this support holds, there could be a surprise reversal towards the key trendline shown on the chart.

IOUSDT Reversal SignalBINANCE:IOUSDT has broken out of a falling wedge on the 4H chart, signaling a potential trend reversal.
The price is trading above both the 50 EMA and 100 EMA, indicating growing bullish momentum.
A successful retest of the breakout zone could lead to a sharp move toward the $0.85–$1.10 level.
Res

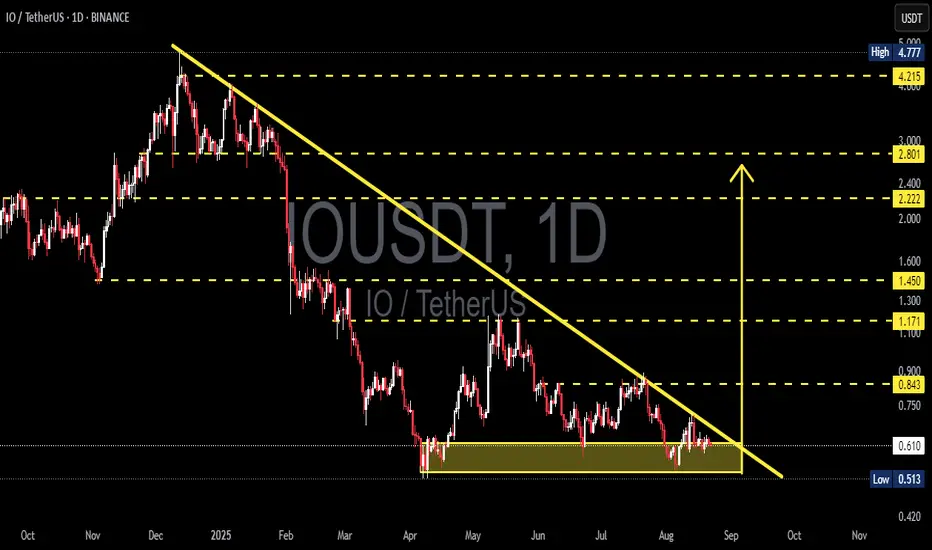
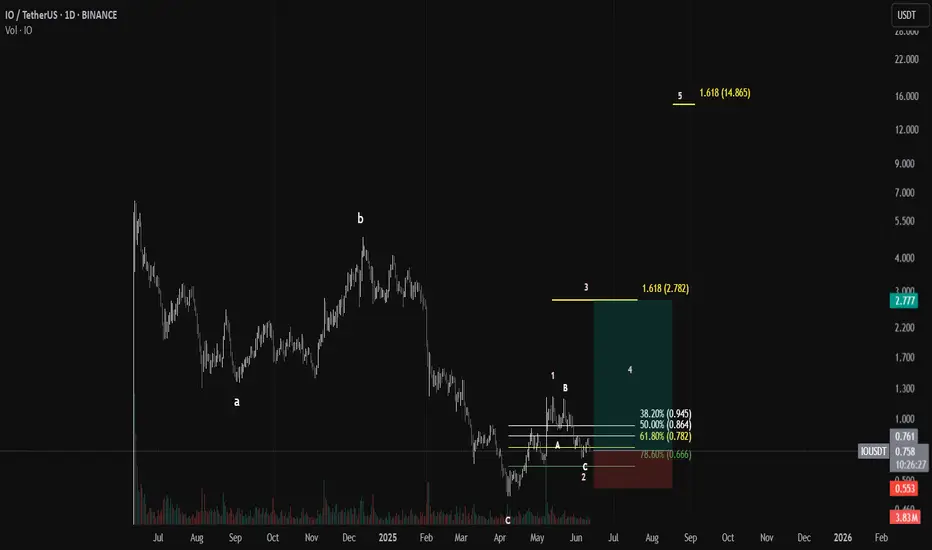
Io trade planIO/USDT Long Trade Setup | Daily Timeframe
📉 Structure: ABC Correction Completed
🚀 Elliott Wave Count: Wave 1 and 2 completed — potential Wave 3 breakout incoming
🔹 Entry Zone: 0.750 – 0.770 USDT
🔻 Stop-Loss: 0.666 USDT (below 78.6% Fib retracement)
🎯 Target 1 (Wave 3): 2.782 USDT (1.618 extension
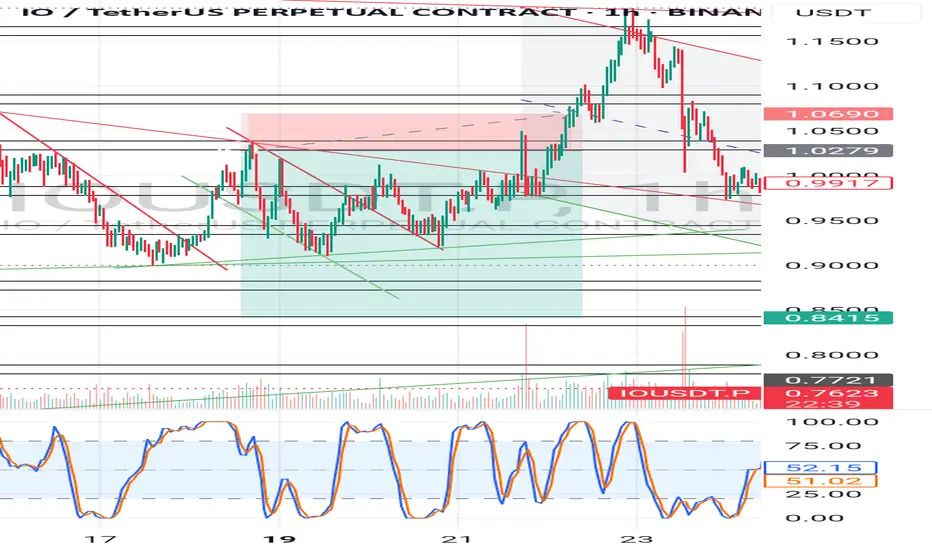
Trader Abdullah Masood Yu.TuIO/USDT pair on a 15-minute chart, and it looks like you're using LuxAlgo Fair Value Gaps, key levels/zones, and a lot of structural plotting to identify trade opportunities.
Observations:
Current Price: ~0.799 USDT
Just Rejected: From a significant 4H bearish fair value gap (FVG) zone around 0.80

IO SHORT RESULT Price was looking bearish overall at the moment and was also trading inside a minor bearish range and respecting resistance zones and Trendline, until price formed a symmetrical triangle and reversed to the upside hitting our sl.
Better Setups to Come 😉
_THE_KLASSIC_TRADER_.
See all ideas
Summarizing what the indicators are suggesting.
Oscillators
Neutral
SellBuy
Strong sellStrong buy
Strong sellSellNeutralBuyStrong buy
Oscillators
Neutral
SellBuy
Strong sellStrong buy
Strong sellSellNeutralBuyStrong buy
Summary
Neutral
SellBuy
Strong sellStrong buy
Strong sellSellNeutralBuyStrong buy
Summary
Neutral
SellBuy
Strong sellStrong buy
Strong sellSellNeutralBuyStrong buy
Summary
Neutral
SellBuy
Strong sellStrong buy
Strong sellSellNeutralBuyStrong buy
Moving Averages
Neutral
SellBuy
Strong sellStrong buy
Strong sellSellNeutralBuyStrong buy
Moving Averages
Neutral
SellBuy
Strong sellStrong buy
Strong sellSellNeutralBuyStrong buy
Displays a symbol's price movements over previous years to identify recurring trends.